
 Login Sign Up


| |||||
 |  | ||||

| 12Stocks.com Market Intelligence |
Best SmallCap Stocks
|
| In a hurry? Small Cap Stock Lists: Performance Trends Table, Stock Charts
Sort Small Cap stocks: Daily, Weekly, Year-to-Date, Market Cap & Trends. Filter Small Cap stocks list by sector: Show all, Tech, Finance, Energy, Staples, Retail, Industrial, Materials, Utilities and HealthCare Filter Small Cap stocks list by size: All Large Medium Small and MicroCap |
| 12Stocks.com Small Cap Stocks Performances & Trends Daily | |||||||||
|
|  The overall Smart Investing & Trading Score is 44 (0-bearish to 100-bullish) which puts Small Cap index in short term neutral trend. The Smart Investing & Trading Score from previous trading session is 13 and hence an improvement of trend.
| ||||||||
Here are the Smart Investing & Trading Scores of the most requested small cap stocks at 12Stocks.com (click stock name for detailed review):
|


| 12Stocks.com: Investing in Smallcap Index with Stocks | |
|
The following table helps investors and traders sort through current performance and trends (as measured by Smart Investing & Trading Score) of various
stocks in the Smallcap Index. Quick View: Move mouse or cursor over stock symbol (ticker) to view short-term technical chart and over stock name to view long term chart. Click on  to add stock symbol to your watchlist and to add stock symbol to your watchlist and  to view watchlist. Click on any ticker or stock name for detailed market intelligence report for that stock. to view watchlist. Click on any ticker or stock name for detailed market intelligence report for that stock. |
12Stocks.com Performance of Stocks in Smallcap Index
| Ticker | Stock Name | Watchlist | Category | Recent Price | Smart Investing & Trading Score | Change % | YTD Change% |
| ACEL | Accel Entertainment |   | Services & Goods | 11.22 | 41 | -0.58% | 9.20% |
| WRLD | World Acceptance | | Financials | 131.99 | 46 | 0.86% | 1.12% |
| GSAT | Globalstar | | Technology | 1.27 | 35 | -1.55% | -34.54% |
| NVEE | NV5 Global | | Services & Goods | 89.68 | 0 | -1.31% | -19.29% |
| MORF | Morphic Holding | | Health Care | 27.50 | 10 | -1.33% | -4.78% |
| WNC | Wabash National | | Consumer Staples | 24.92 | 36 | -3.78% | -2.73% |
| RCEL | Avita Medical | | Health Care | 8.84 | 10 | -5.81% | -35.60% |
| TRDA | Entrada | | Health Care | 12.05 | 0 | -1.39% | -26.57% |
| CIO | City Office | | Financials | 4.49 | 52 | 2.40% | -26.60% |
| TILE | Interface | | Industrials | 14.92 | 41 | 0.27% | 18.23% |
| AVTE | Aerovate | | Health Care | 21.43 | 36 | -4.03% | -5.05% |
| DCOM | Dime Community | | Financials | 17.76 | 27 | 0.17% | -34.05% |
| CASS | Cass Information | | Services & Goods | 43.84 | 26 | -1.98% | -2.67% |
| GPRO | GoPro | | Consumer Staples | 1.75 | 42 | -0.28% | -49.42% |
| CWH | Camping World | | Financials | 22.06 | 10 | 2.72% | -16.01% |
| FORR | Forrester Research | | Services & Goods | 18.29 | 20 | -1.30% | -31.78% |
| RDNT | RadNet | | Health Care | 47.67 | 68 | -0.27% | 37.10% |
| PACB | Pacific Biosciences | | Health Care | 1.44 | 0 | 2.50% | -85.37% |
| HRI | Herc | | Transports | 151.35 | 36 | -0.77% | 1.65% |
| AURA | Aura Biosciences | | Health Care | 7.05 | 17 | 0.21% | -20.28% |
| METCB | Ramaco Resources | | Materials | 11.41 | 32 | 0.04% | -13.89% |
| HLLY | Holley | | Services & Goods | 4.17 | 23 | 1.58% | -15.91% |
| OSUR | OraSure | | Health Care | 5.24 | 10 | -0.19% | -36.10% |
| BTMD | biote | | Health Care | 5.58 | 53 | 1.45% | 12.50% |
| UVSP | Univest Financial | | Financials | 18.55 | 28 | 0.60% | -15.80% |


| Too many stocks? View smallcap stocks filtered by marketcap & sector |
| Marketcap: All SmallCap Stocks (default-no microcap), Large, Mid-Range, Small |
| Smallcap Sector: Tech, Finance, Energy, Staples, Retail, Industrial, Materials, & Medical |
|
Get the most comprehensive stock market coverage daily at 12Stocks.com ➞ Best Stocks Today ➞ Best Stocks Weekly ➞ Best Stocks Year-to-Date ➞ Best Stocks Trends ➞  Best Stocks Today 12Stocks.com Best Nasdaq Stocks ➞ Best S&P 500 Stocks ➞ Best Tech Stocks ➞ Best Biotech Stocks ➞ |
| Detailed Overview of SmallCap Stocks |
| SmallCap Technical Overview, Leaders & Laggards, Top SmallCap ETF Funds & Detailed SmallCap Stocks List, Charts, Trends & More |
| Smallcap: Technical Analysis, Trends & YTD Performance | |
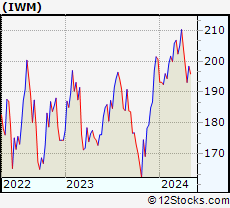
| SmallCap segment as represented by
IWM, an exchange-traded fund [ETF], holds basket of thousands of smallcap stocks from across all major sectors of the US stock market. The smallcap index (contains stocks like Riverbed & Sotheby's) is down by -3.99% and is currently underperforming the overall market by -8.02% year-to-date. Below is a quick view of technical charts and trends: | |
 IWM Weekly Chart |
|
| Long Term Trend: Good | |
| Medium Term Trend: Not Good | |
 IWM Daily Chart |
|
| Short Term Trend: Deteriorating | |
| Overall Trend Score: 44 | |
| YTD Performance: -3.99% | |
| **Trend Scores & Views Are Only For Educational Purposes And Not For Investing | |
| 12Stocks.com: Top Performing Small Cap Index Stocks | ||||||||||||||||||||||||||||||||||||||||||||||||
 The top performing Small Cap Index stocks year to date are
Now, more recently, over last week, the top performing Small Cap Index stocks on the move are


|
||||||||||||||||||||||||||||||||||||||||||||||||
| 12Stocks.com: Investing in Smallcap Index using Exchange Traded Funds | |
|
The following table shows list of key exchange traded funds (ETF) that
help investors track Smallcap index. The following list also includes leveraged ETF funds that track twice or thrice the daily returns of Smallcap indices. Short or inverse ETF funds move in the opposite direction to the index they track and are useful during market pullbacks or during bear markets. Quick View: Move mouse or cursor over ETF symbol (ticker) to view short-term technical chart and over ETF name to view long term chart. Click on ticker or stock name for detailed view. Click on to add stock symbol to your watchlist and to view watchlist. |
12Stocks.com List of ETFs that track Smallcap Index
| Ticker | ETF Name | Watchlist | Recent Price | Smart Investing & Trading Score | Change % | Week % | Year-to-date % |
| IWM | iShares Russell 2000 | | 192.71 | 44 | -0.15 | -3.01 | -3.99% |
| IJR | iShares Core S&P Small-Cap | | 102.18 | 38 | 0.05 | -2.23 | -5.61% |
| VTWO | Vanguard Russell 2000 ETF | | 77.90 | 23 | -0.19 | -3.01 | -3.95% |
| IWN | iShares Russell 2000 Value | | 146.15 | 10 | 0.08 | -2.81 | -5.91% |
| IWO | iShares Russell 2000 Growth | | 247.09 | 36 | -0.37 | -3.24 | -2.03% |
| IJS | iShares S&P Small-Cap 600 Value | | 94.40 | 10 | 0.30 | -1.84 | -8.41% |
| IJT | iShares S&P Small-Cap 600 Growth | | 122.58 | 23 | 0.61 | -1.76 | -2.05% |
| XSLV | PowerShares S&P SmallCap Low Volatil ETF | | 41.62 | 18 | 0.48 | -1.12 | -5.73% |
| SAA | ProShares Ultra SmallCap600 | | 21.71 | 10 | 0.25 | -3.75 | -12.97% |
| SMLV | SPDR SSGA US Small Cap Low Volatil ETF | | 104.02 | 18 | 0.34 | -0.95 | -7.56% |
| SBB | ProShares Short SmallCap600 | | 16.89 | 73 | 0.24 | 2.07 | 6.03% |
| SDD | ProShares UltraShort SmallCap600 | | 20.23 | 73 | -1.80 | 2.01 | 9.79% |
| 12Stocks.com: Charts, Trends, Fundamental Data and Performances of SmallCap Stocks | |
|
We now take in-depth look at all SmallCap stocks including charts, multi-period performances and overall trends (as measured by Smart Investing & Trading Score). One can sort SmallCap stocks (click link to choose) by Daily, Weekly and by Year-to-Date performances. Also, one can sort by size of the company or by market capitalization. |
| Select Your Default Chart Type: | |||||
| |||||
| Click on stock symbol or name for detailed view. Click on to add stock symbol to your watchlist and to view watchlist. Quick View: Move mouse or cursor over "Daily" to quickly view daily technical stock chart and over "Weekly" to view weekly technical stock chart. | |||||

 | ACEL Accel Entertainment, Inc. |
| Sector: Services & Goods | |
| SubSector: Gaming Activities | |
| MarketCap: 486.589 Millions | |
| Recent Price: 11.22 Smart Investing & Trading Score: 41 | |
| Day Percent Change: -0.58% Day Change: -0.06 | |
| Week Change: 1.86% Year-to-date Change: 9.2% | |
| ACEL Links: Profile News Message Board | |
| Charts:- Daily , Weekly | |
| Add ACEL to Watchlist: View: Get Complete ACEL Trend Analysis ➞ | |
 | WRLD World Acceptance Corporation |
| Sector: Financials | |
| SubSector: Credit Services | |
| MarketCap: 486.408 Millions | |
| Recent Price: 131.99 Smart Investing & Trading Score: 46 | |
| Day Percent Change: 0.86% Day Change: 1.13 | |
| Week Change: -2.06% Year-to-date Change: 1.1% | |
| WRLD Links: Profile News Message Board | |
| Charts:- Daily , Weekly | |
| Add WRLD to Watchlist: View: Get Complete WRLD Trend Analysis ➞ | |
 | GSAT Globalstar, Inc. |
| Sector: Technology | |
| SubSector: Wireless Communications | |
| MarketCap: 485.127 Millions | |
| Recent Price: 1.27 Smart Investing & Trading Score: 35 | |
| Day Percent Change: -1.55% Day Change: -0.02 | |
| Week Change: -4.51% Year-to-date Change: -34.5% | |
| GSAT Links: Profile News Message Board | |
| Charts:- Daily , Weekly | |
| Add GSAT to Watchlist: View: Get Complete GSAT Trend Analysis ➞ | |
 | NVEE NV5 Global, Inc. |
| Sector: Services & Goods | |
| SubSector: Technical Services | |
| MarketCap: 484.91 Millions | |
| Recent Price: 89.68 Smart Investing & Trading Score: 0 | |
| Day Percent Change: -1.31% Day Change: -1.19 | |
| Week Change: -5.43% Year-to-date Change: -19.3% | |
| NVEE Links: Profile News Message Board | |
| Charts:- Daily , Weekly | |
| Add NVEE to Watchlist: View: Get Complete NVEE Trend Analysis ➞ | |
 | MORF Morphic Holding, Inc. |
| Sector: Health Care | |
| SubSector: Biotechnology | |
| MarketCap: 484.885 Millions | |
| Recent Price: 27.50 Smart Investing & Trading Score: 10 | |
| Day Percent Change: -1.33% Day Change: -0.37 | |
| Week Change: -4.05% Year-to-date Change: -4.8% | |
| MORF Links: Profile News Message Board | |
| Charts:- Daily , Weekly | |
| Add MORF to Watchlist: View: Get Complete MORF Trend Analysis ➞ | |
 | WNC Wabash National Corporation |
| Sector: Consumer Staples | |
| SubSector: Trucks & Other Vehicles | |
| MarketCap: 482.597 Millions | |
| Recent Price: 24.92 Smart Investing & Trading Score: 36 | |
| Day Percent Change: -3.78% Day Change: -0.98 | |
| Week Change: -6.81% Year-to-date Change: -2.7% | |
| WNC Links: Profile News Message Board | |
| Charts:- Daily , Weekly | |
| Add WNC to Watchlist: View: Get Complete WNC Trend Analysis ➞ | |
 | RCEL Avita Medical Limited |
| Sector: Health Care | |
| SubSector: Medical Appliances & Equipment | |
| MarketCap: 481.18 Millions | |
| Recent Price: 8.84 Smart Investing & Trading Score: 10 | |
| Day Percent Change: -5.81% Day Change: -0.54 | |
| Week Change: -10.58% Year-to-date Change: -35.6% | |
| RCEL Links: Profile News Message Board | |
| Charts:- Daily , Weekly | |
| Add RCEL to Watchlist: View: Get Complete RCEL Trend Analysis ➞ | |
 | TRDA Entrada Therapeutics, Inc. |
| Sector: Health Care | |
| SubSector: Biotechnology | |
| MarketCap: 481 Millions | |
| Recent Price: 12.05 Smart Investing & Trading Score: 0 | |
| Day Percent Change: -1.39% Day Change: -0.17 | |
| Week Change: -6.95% Year-to-date Change: -26.6% | |
| TRDA Links: Profile News Message Board | |
| Charts:- Daily , Weekly | |
| Add TRDA to Watchlist: View: Get Complete TRDA Trend Analysis ➞ | |
 | CIO City Office REIT, Inc. |
| Sector: Financials | |
| SubSector: REIT - Office | |
| MarketCap: 478.566 Millions | |
| Recent Price: 4.49 Smart Investing & Trading Score: 52 | |
| Day Percent Change: 2.40% Day Change: 0.11 | |
| Week Change: -0.33% Year-to-date Change: -26.6% | |
| CIO Links: Profile News Message Board | |
| Charts:- Daily , Weekly | |
| Add CIO to Watchlist: View: Get Complete CIO Trend Analysis ➞ | |
 | TILE Interface, Inc. |
| Sector: Industrials | |
| SubSector: Textile Industrial | |
| MarketCap: 478 Millions | |
| Recent Price: 14.92 Smart Investing & Trading Score: 41 | |
| Day Percent Change: 0.27% Day Change: 0.04 | |
| Week Change: -3.31% Year-to-date Change: 18.2% | |
| TILE Links: Profile News Message Board | |
| Charts:- Daily , Weekly | |
| Add TILE to Watchlist: View: Get Complete TILE Trend Analysis ➞ | |
 | AVTE Aerovate Therapeutics, Inc. |
| Sector: Health Care | |
| SubSector: Biotechnology | |
| MarketCap: 478 Millions | |
| Recent Price: 21.43 Smart Investing & Trading Score: 36 | |
| Day Percent Change: -4.03% Day Change: -0.90 | |
| Week Change: -15.1% Year-to-date Change: -5.1% | |
| AVTE Links: Profile News Message Board | |
| Charts:- Daily , Weekly | |
| Add AVTE to Watchlist: View: Get Complete AVTE Trend Analysis ➞ | |
 | DCOM Dime Community Bancshares, Inc. |
| Sector: Financials | |
| SubSector: Savings & Loans | |
| MarketCap: 477.83 Millions | |
| Recent Price: 17.76 Smart Investing & Trading Score: 27 | |
| Day Percent Change: 0.17% Day Change: 0.03 | |
| Week Change: -4.05% Year-to-date Change: -34.1% | |
| DCOM Links: Profile News Message Board | |
| Charts:- Daily , Weekly | |
| Add DCOM to Watchlist: View: Get Complete DCOM Trend Analysis ➞ | |
 | CASS Cass Information Systems, Inc. |
| Sector: Services & Goods | |
| SubSector: Business Services | |
| MarketCap: 477.382 Millions | |
| Recent Price: 43.84 Smart Investing & Trading Score: 26 | |
| Day Percent Change: -1.98% Day Change: -0.88 | |
| Week Change: -3.51% Year-to-date Change: -2.7% | |
| CASS Links: Profile News Message Board | |
| Charts:- Daily , Weekly | |
| Add CASS to Watchlist: View: Get Complete CASS Trend Analysis ➞ | |
 | GPRO GoPro, Inc. |
| Sector: Consumer Staples | |
| SubSector: Photographic Equipment & Supplies | |
| MarketCap: 475.925 Millions | |
| Recent Price: 1.75 Smart Investing & Trading Score: 42 | |
| Day Percent Change: -0.28% Day Change: -0.01 | |
| Week Change: -3.57% Year-to-date Change: -49.4% | |
| GPRO Links: Profile News Message Board | |
| Charts:- Daily , Weekly | |
| Add GPRO to Watchlist: View: Get Complete GPRO Trend Analysis ➞ | |
 | CWH Camping World Holdings, Inc. |
| Sector: Financials | |
| SubSector: REIT - Office | |
| MarketCap: 473.566 Millions | |
| Recent Price: 22.06 Smart Investing & Trading Score: 10 | |
| Day Percent Change: 2.72% Day Change: 0.59 | |
| Week Change: -5.63% Year-to-date Change: -16.0% | |
| CWH Links: Profile News Message Board | |
| Charts:- Daily , Weekly | |
| Add CWH to Watchlist: View: Get Complete CWH Trend Analysis ➞ | |
 | FORR Forrester Research, Inc. |
| Sector: Services & Goods | |
| SubSector: Research Services | |
| MarketCap: 473.394 Millions | |
| Recent Price: 18.29 Smart Investing & Trading Score: 20 | |
| Day Percent Change: -1.30% Day Change: -0.24 | |
| Week Change: -6.16% Year-to-date Change: -31.8% | |
| FORR Links: Profile News Message Board | |
| Charts:- Daily , Weekly | |
| Add FORR to Watchlist: View: Get Complete FORR Trend Analysis ➞ | |
 | RDNT RadNet, Inc. |
| Sector: Health Care | |
| SubSector: Medical Laboratories & Research | |
| MarketCap: 473.2 Millions | |
| Recent Price: 47.67 Smart Investing & Trading Score: 68 | |
| Day Percent Change: -0.27% Day Change: -0.13 | |
| Week Change: -1.71% Year-to-date Change: 37.1% | |
| RDNT Links: Profile News Message Board | |
| Charts:- Daily , Weekly | |
| Add RDNT to Watchlist: View: Get Complete RDNT Trend Analysis ➞ | |
 | PACB Pacific Biosciences of California, Inc. |
| Sector: Health Care | |
| SubSector: Biotechnology | |
| MarketCap: 470.685 Millions | |
| Recent Price: 1.44 Smart Investing & Trading Score: 0 | |
| Day Percent Change: 2.50% Day Change: 0.04 | |
| Week Change: -54.73% Year-to-date Change: -85.4% | |
| PACB Links: Profile News Message Board | |
| Charts:- Daily , Weekly | |
| Add PACB to Watchlist: View: Get Complete PACB Trend Analysis ➞ | |
 | HRI Herc Holdings Inc. |
| Sector: Transports | |
| SubSector: Rental & Leasing Services | |
| MarketCap: 469.344 Millions | |
| Recent Price: 151.35 Smart Investing & Trading Score: 36 | |
| Day Percent Change: -0.77% Day Change: -1.18 | |
| Week Change: -4.12% Year-to-date Change: 1.7% | |
| HRI Links: Profile News Message Board | |
| Charts:- Daily , Weekly | |
| Add HRI to Watchlist: View: Get Complete HRI Trend Analysis ➞ | |
 | AURA Aura Biosciences, Inc. |
| Sector: Health Care | |
| SubSector: Biotechnology | |
| MarketCap: 469 Millions | |
| Recent Price: 7.05 Smart Investing & Trading Score: 17 | |
| Day Percent Change: 0.21% Day Change: 0.01 | |
| Week Change: -6.43% Year-to-date Change: -20.3% | |
| AURA Links: Profile News Message Board | |
| Charts:- Daily , Weekly | |
| Add AURA to Watchlist: View: Get Complete AURA Trend Analysis ➞ | |
 | METCB Ramaco Resources, Inc. |
| Sector: Materials | |
| SubSector: Coking Coal | |
| MarketCap: 469 Millions | |
| Recent Price: 11.41 Smart Investing & Trading Score: 32 | |
| Day Percent Change: 0.04% Day Change: 0.01 | |
| Week Change: 0% Year-to-date Change: -13.9% | |
| METCB Links: Profile News Message Board | |
| Charts:- Daily , Weekly | |
| Add METCB to Watchlist: View: Get Complete METCB Trend Analysis ➞ | |
 | HLLY Holley Inc. |
| Sector: Services & Goods | |
| SubSector: Auto Parts | |
| MarketCap: 469 Millions | |
| Recent Price: 4.17 Smart Investing & Trading Score: 23 | |
| Day Percent Change: 1.58% Day Change: 0.06 | |
| Week Change: -0.83% Year-to-date Change: -15.9% | |
| HLLY Links: Profile News Message Board | |
| Charts:- Daily , Weekly | |
| Add HLLY to Watchlist: View: Get Complete HLLY Trend Analysis ➞ | |
 | OSUR OraSure Technologies, Inc. |
| Sector: Health Care | |
| SubSector: Medical Instruments & Supplies | |
| MarketCap: 468.26 Millions | |
| Recent Price: 5.24 Smart Investing & Trading Score: 10 | |
| Day Percent Change: -0.19% Day Change: -0.01 | |
| Week Change: -5.07% Year-to-date Change: -36.1% | |
| OSUR Links: Profile News Message Board | |
| Charts:- Daily , Weekly | |
| Add OSUR to Watchlist: View: Get Complete OSUR Trend Analysis ➞ | |
 | BTMD biote Corp. |
| Sector: Health Care | |
| SubSector: Medical Care Facilities | |
| MarketCap: 468 Millions | |
| Recent Price: 5.58 Smart Investing & Trading Score: 53 | |
| Day Percent Change: 1.45% Day Change: 0.08 | |
| Week Change: -7.31% Year-to-date Change: 12.5% | |
| BTMD Links: Profile News Message Board | |
| Charts:- Daily , Weekly | |
| Add BTMD to Watchlist: View: Get Complete BTMD Trend Analysis ➞ | |
 | UVSP Univest Financial Corporation |
| Sector: Financials | |
| SubSector: Regional - Northeast Banks | |
| MarketCap: 467.999 Millions | |
| Recent Price: 18.55 Smart Investing & Trading Score: 28 | |
| Day Percent Change: 0.60% Day Change: 0.11 | |
| Week Change: -0.91% Year-to-date Change: -15.8% | |
| UVSP Links: Profile News Message Board | |
| Charts:- Daily , Weekly | |
| Add UVSP to Watchlist: View: Get Complete UVSP Trend Analysis ➞ | |
| Too many stocks? View smallcap stocks filtered by marketcap & sector |
| Marketcap: All SmallCap Stocks (default-no microcap), Large, Mid-Range, Small & MicroCap |
| Sector: Tech, Finance, Energy, Staples, Retail, Industrial, Materials, Utilities & Medical |
|
Best Stocks Today 12Stocks.com |
© 2024 12Stocks.com Terms & Conditions Privacy Contact Us
All Information Provided Only For Education And Not To Be Used For Investing or Trading. See Terms & Conditions


One More Thing ... Get Best Stocks Delivered Daily!
Never Ever Miss A Move With Our Top Ten Stocks Lists
Find Best Stocks In Any Market - Bull or Bear Market
Take A Peek At Our Top Ten Stocks Lists: Daily, Weekly, Year-to-Date & Top Trends
Find Best Stocks In Any Market - Bull or Bear Market
Take A Peek At Our Top Ten Stocks Lists: Daily, Weekly, Year-to-Date & Top Trends
Smallcap Stocks With Best Up Trends [0-bearish to 100-bullish]: Badger Meter[100], Cullinan Oncology[100], Oscar Health[100], Apogee Enterprises[100], NextNav [100], Geron [100], Richardson Electronics[100], Seneca Foods[100], Lantheus [100], Macatawa Bank[100], Regional Management[100]
Best Smallcap Stocks Year-to-Date:
Agenus [511.18%], CareMax [417.53%], Janux [348.12%], Viking [248.9%], Alpine Immune[238.6%], Super Micro[230.42%], Arcutis Bio[203.72%], Longboard [184.12%], Vera [161.3%], Avidity Biosciences[159.18%], Hippo [128.32%] Best Smallcap Stocks This Week:
Macatawa Bank[44.47%], 23andMe Holding[33.3%], ProKidney [32%], Snap One[29.73%], Vertex Energy[23.08%], ALX Oncology[22.79%], Vanda [20.63%], Expensify [18.37%], Badger Meter[15.7%], Cullinan Oncology[13.89%], Humacyte [12.67%] Best Smallcap Stocks Daily:
23andMe Holding[65.91%], Vertex Energy[30.72%], Badger Meter[15.63%], Expensify [15.23%], Zura Bio[10.99%], Vaxxinity [10.05%], Vuzix [9.87%], Montrose Environmental[8.91%], Cipher Mining[8.65%], FiscalNote [8.61%], Barnes Group[8.48%]