
 Login Sign Up


| |||||
 |  | ||||

| 12Stocks.com Market Intelligence |
Best SmallCap Stocks
|
| In a hurry? Small Cap Stock Lists: Performance Trends Table, Stock Charts
Sort Small Cap stocks: Daily, Weekly, Year-to-Date, Market Cap & Trends. Filter Small Cap stocks list by sector: Show all, Tech, Finance, Energy, Staples, Retail, Industrial, Materials, Utilities and HealthCare Filter Small Cap stocks list by size: All Large Medium Small and MicroCap |
| 12Stocks.com Small Cap Stocks Performances & Trends Daily | |||||||||
|
|  The overall Smart Investing & Trading Score is 23 (0-bearish to 100-bullish) which puts Small Cap index in short term bearish to neutral trend. The Smart Investing & Trading Score from previous trading session is 13 and an improvement of trend continues.
| ||||||||
Here are the Smart Investing & Trading Scores of the most requested small cap stocks at 12Stocks.com (click stock name for detailed review):
|


| 12Stocks.com: Investing in Smallcap Index with Stocks | |
|
The following table helps investors and traders sort through current performance and trends (as measured by Smart Investing & Trading Score) of various
stocks in the Smallcap Index. Quick View: Move mouse or cursor over stock symbol (ticker) to view short-term technical chart and over stock name to view long term chart. Click on  to add stock symbol to your watchlist and to add stock symbol to your watchlist and  to view watchlist. Click on any ticker or stock name for detailed market intelligence report for that stock. to view watchlist. Click on any ticker or stock name for detailed market intelligence report for that stock. |
12Stocks.com Performance of Stocks in Smallcap Index
| Ticker | Stock Name | Watchlist | Category | Recent Price | Smart Investing & Trading Score | Change % | YTD Change% |
| VERA | Vera |   | Health Care | 36.87 | 31 | -8.85% | 138.18% |
| MOND | Mondee | | Services & Goods | 2.08 | 10 | -4.59% | -25.18% |
| AZZ | AZZ | | Industrials | 76.49 | 41 | 1.34% | 31.67% |
| KIDS | OrthoPediatrics | | Health Care | 30.35 | 69 | 3.02% | -6.64% |
| BRP | BRP Group | | Financials | 27.58 | 54 | 2.87% | 14.82% |
| WEAV | Weave | | Technology | 10.75 | 0 | -2.97% | -7.49% |
| NPO | EnPro Industries | | Industrials | 149.02 | 23 | -0.16% | -4.93% |
| SMRT | SmartRent | | Technology | 2.29 | 0 | -2.97% | -28.21% |
| TYRA | Tyra Biosciences | | Health Care | 14.63 | 43 | 2.63% | 9.71% |
| ASTE | Astec Industries | | Industrials | 42.81 | 61 | 2.22% | 15.08% |
| GABC | German American | | Financials | 33.18 | 42 | 4.08% | 2.38% |
| GRC | Gorman-Rupp | | Industrials | 36.07 | 51 | 0.08% | 1.52% |
| PHAT | Phathom | | Health Care | 8.98 | 31 | -5.27% | -1.64% |
| PLUS | ePlus | | Technology | 75.32 | 13 | 0.05% | -5.66% |
| GVA | Granite Construction | | Industrials | 53.47 | 41 | -0.39% | 5.13% |
| BASE | Couchbase | | Technology | 22.57 | 0 | -6.66% | -0.97% |
| FARO | FARO | | Technology | 18.70 | 15 | 2.07% | -17.00% |
| SKT | Tanger Factory | | Financials | 26.67 | 25 | -0.56% | -3.79% |
| MLYS | Mineralys | | Health Care | 10.99 | 23 | -5.34% | 26.03% |
| VREX | Varex Imaging | | Health Care | 16.99 | 38 | 0.41% | -17.12% |
| REZI | Resideo | | Services & Goods | 19.27 | 36 | 0.36% | 2.39% |
| CIFR | Cipher Mining | | Financials | 3.84 | 58 | 3.64% | -6.57% |
| PLAB | Photronics | | Technology | 25.33 | 0 | -2.91% | -19.25% |
| NTLA | Intellia | | Health Care | 21.57 | 10 | 1.17% | -29.26% |
| PWP | Perella Weinberg | | Financials | 15.34 | 71 | 0.26% | 24.21% |


| Too many stocks? View smallcap stocks filtered by marketcap & sector |
| Marketcap: All SmallCap Stocks (default-no microcap), Large, Mid-Range, Small |
| Smallcap Sector: Tech, Finance, Energy, Staples, Retail, Industrial, Materials, & Medical |
|
Get the most comprehensive stock market coverage daily at 12Stocks.com ➞ Best Stocks Today ➞ Best Stocks Weekly ➞ Best Stocks Year-to-Date ➞ Best Stocks Trends ➞  Best Stocks Today 12Stocks.com Best Nasdaq Stocks ➞ Best S&P 500 Stocks ➞ Best Tech Stocks ➞ Best Biotech Stocks ➞ |
| Detailed Overview of SmallCap Stocks |
| SmallCap Technical Overview, Leaders & Laggards, Top SmallCap ETF Funds & Detailed SmallCap Stocks List, Charts, Trends & More |
| Smallcap: Technical Analysis, Trends & YTD Performance | |
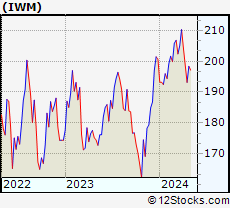
| SmallCap segment as represented by
IWM, an exchange-traded fund [ETF], holds basket of thousands of smallcap stocks from across all major sectors of the US stock market. The smallcap index (contains stocks like Riverbed & Sotheby's) is down by -3.77% and is currently underperforming the overall market by -7.16% year-to-date. Below is a quick view of technical charts and trends: | |
 IWM Weekly Chart |
|
| Long Term Trend: Not Good | |
| Medium Term Trend: Not Good | |
 IWM Daily Chart |
|
| Short Term Trend: Not Good | |
| Overall Trend Score: 23 | |
| YTD Performance: -3.77% | |
| **Trend Scores & Views Are Only For Educational Purposes And Not For Investing | |
| 12Stocks.com: Top Performing Small Cap Index Stocks | ||||||||||||||||||||||||||||||||||||||||||||||||
 The top performing Small Cap Index stocks year to date are
Now, more recently, over last week, the top performing Small Cap Index stocks on the move are


|
||||||||||||||||||||||||||||||||||||||||||||||||
| 12Stocks.com: Investing in Smallcap Index using Exchange Traded Funds | |
|
The following table shows list of key exchange traded funds (ETF) that
help investors track Smallcap index. The following list also includes leveraged ETF funds that track twice or thrice the daily returns of Smallcap indices. Short or inverse ETF funds move in the opposite direction to the index they track and are useful during market pullbacks or during bear markets. Quick View: Move mouse or cursor over ETF symbol (ticker) to view short-term technical chart and over ETF name to view long term chart. Click on ticker or stock name for detailed view. Click on to add stock symbol to your watchlist and to view watchlist. |
12Stocks.com List of ETFs that track Smallcap Index
| Ticker | ETF Name | Watchlist | Recent Price | Smart Investing & Trading Score | Change % | Week % | Year-to-date % |
| IWM | iShares Russell 2000 | | 193.14 | 23 | 0.16 | -2.79 | -3.77% |
| IJR | iShares Core S&P Small-Cap | | 103.15 | 10 | 0.79 | -1.3 | -4.71% |
| IWN | iShares Russell 2000 Value | | 147.78 | 10 | 0.99 | -1.73 | -4.86% |
| VTWO | Vanguard Russell 2000 ETF | | 78.06 | 23 | 0.14 | -2.81 | -3.75% |
| IWO | iShares Russell 2000 Growth | | 245.01 | 36 | -0.78 | -4.05 | -2.86% |
| IJS | iShares S&P Small-Cap 600 Value | | 95.61 | 17 | 1.16 | -0.58 | -7.24% |
| IJT | iShares S&P Small-Cap 600 Growth | | 121.96 | 23 | 0.32 | -2.26 | -2.54% |
| XSLV | PowerShares S&P SmallCap Low Volatil ETF | | 42.30 | 17 | 1.56 | 0.5 | -4.19% |
| SAA | ProShares Ultra SmallCap600 | | 21.80 | 18 | 0.83 | -3.37 | -12.63% |
| SMLV | SPDR SSGA US Small Cap Low Volatil ETF | | 106.09 | 32 | 2.18 | 1.03 | -5.71% |
| SDD | ProShares UltraShort SmallCap600 | | 20.34 | 76 | -1.69 | 2.57 | 10.38% |
| SBB | ProShares Short SmallCap600 | | 16.84 | 76 | -0.82 | 1.77 | 5.71% |
| 12Stocks.com: Charts, Trends, Fundamental Data and Performances of SmallCap Stocks | |
|
We now take in-depth look at all SmallCap stocks including charts, multi-period performances and overall trends (as measured by Smart Investing & Trading Score). One can sort SmallCap stocks (click link to choose) by Daily, Weekly and by Year-to-Date performances. Also, one can sort by size of the company or by market capitalization. |
| Select Your Default Chart Type: | |||||
| |||||
| Click on stock symbol or name for detailed view. Click on to add stock symbol to your watchlist and to view watchlist. Quick View: Move mouse or cursor over "Daily" to quickly view daily technical stock chart and over "Weekly" to view weekly technical stock chart. | |||||

 | VERA Vera Therapeutics, Inc. |
| Sector: Health Care | |
| SubSector: Biotechnology | |
| MarketCap: 746 Millions | |
| Recent Price: 36.87 Smart Investing & Trading Score: 31 | |
| Day Percent Change: -8.85% Day Change: -3.58 | |
| Week Change: -23.14% Year-to-date Change: 138.2% | |
| VERA Links: Profile News Message Board | |
| Charts:- Daily , Weekly | |
| Add VERA to Watchlist: View: Get Complete VERA Trend Analysis ➞ | |
 | MOND Mondee Holdings, Inc. |
| Sector: Services & Goods | |
| SubSector: Travel Services | |
| MarketCap: 744 Millions | |
| Recent Price: 2.08 Smart Investing & Trading Score: 10 | |
| Day Percent Change: -4.59% Day Change: -0.10 | |
| Week Change: -9.57% Year-to-date Change: -25.2% | |
| MOND Links: Profile News Message Board | |
| Charts:- Daily , Weekly | |
| Add MOND to Watchlist: View: Get Complete MOND Trend Analysis ➞ | |
 | AZZ AZZ Inc. |
| Sector: Industrials | |
| SubSector: Diversified Machinery | |
| MarketCap: 743.416 Millions | |
| Recent Price: 76.49 Smart Investing & Trading Score: 41 | |
| Day Percent Change: 1.34% Day Change: 1.01 | |
| Week Change: -1.91% Year-to-date Change: 31.7% | |
| AZZ Links: Profile News Message Board | |
| Charts:- Daily , Weekly | |
| Add AZZ to Watchlist: View: Get Complete AZZ Trend Analysis ➞ | |
 | KIDS OrthoPediatrics Corp. |
| Sector: Health Care | |
| SubSector: Medical Appliances & Equipment | |
| MarketCap: 742.28 Millions | |
| Recent Price: 30.35 Smart Investing & Trading Score: 69 | |
| Day Percent Change: 3.02% Day Change: 0.89 | |
| Week Change: -2.38% Year-to-date Change: -6.6% | |
| KIDS Links: Profile News Message Board | |
| Charts:- Daily , Weekly | |
| Add KIDS to Watchlist: View: Get Complete KIDS Trend Analysis ➞ | |
 | BRP BRP Group, Inc. |
| Sector: Financials | |
| SubSector: Real Estate Development | |
| MarketCap: 741.219 Millions | |
| Recent Price: 27.58 Smart Investing & Trading Score: 54 | |
| Day Percent Change: 2.87% Day Change: 0.77 | |
| Week Change: -0.18% Year-to-date Change: 14.8% | |
| BRP Links: Profile News Message Board | |
| Charts:- Daily , Weekly | |
| Add BRP to Watchlist: View: Get Complete BRP Trend Analysis ➞ | |
 | WEAV Weave Communications, Inc. |
| Sector: Technology | |
| SubSector: Software - Application | |
| MarketCap: 740 Millions | |
| Recent Price: 10.75 Smart Investing & Trading Score: 0 | |
| Day Percent Change: -2.97% Day Change: -0.33 | |
| Week Change: -7.17% Year-to-date Change: -7.5% | |
| WEAV Links: Profile News Message Board | |
| Charts:- Daily , Weekly | |
| Add WEAV to Watchlist: View: Get Complete WEAV Trend Analysis ➞ | |
 | NPO EnPro Industries, Inc. |
| Sector: Industrials | |
| SubSector: Industrial Equipment & Components | |
| MarketCap: 734.309 Millions | |
| Recent Price: 149.02 Smart Investing & Trading Score: 23 | |
| Day Percent Change: -0.16% Day Change: -0.24 | |
| Week Change: -5.34% Year-to-date Change: -4.9% | |
| NPO Links: Profile News Message Board | |
| Charts:- Daily , Weekly | |
| Add NPO to Watchlist: View: Get Complete NPO Trend Analysis ➞ | |
 | SMRT SmartRent, Inc. |
| Sector: Technology | |
| SubSector: Software - Application | |
| MarketCap: 733 Millions | |
| Recent Price: 2.29 Smart Investing & Trading Score: 0 | |
| Day Percent Change: -2.97% Day Change: -0.07 | |
| Week Change: -6.15% Year-to-date Change: -28.2% | |
| SMRT Links: Profile News Message Board | |
| Charts:- Daily , Weekly | |
| Add SMRT to Watchlist: View: Get Complete SMRT Trend Analysis ➞ | |
 | TYRA Tyra Biosciences, Inc. |
| Sector: Health Care | |
| SubSector: Biotechnology | |
| MarketCap: 732 Millions | |
| Recent Price: 14.63 Smart Investing & Trading Score: 43 | |
| Day Percent Change: 2.63% Day Change: 0.38 | |
| Week Change: -1.78% Year-to-date Change: 9.7% | |
| TYRA Links: Profile News Message Board | |
| Charts:- Daily , Weekly | |
| Add TYRA to Watchlist: View: Get Complete TYRA Trend Analysis ➞ | |
 | ASTE Astec Industries, Inc. |
| Sector: Industrials | |
| SubSector: Farm & Construction Machinery | |
| MarketCap: 731.607 Millions | |
| Recent Price: 42.81 Smart Investing & Trading Score: 61 | |
| Day Percent Change: 2.22% Day Change: 0.93 | |
| Week Change: 0.75% Year-to-date Change: 15.1% | |
| ASTE Links: Profile News Message Board | |
| Charts:- Daily , Weekly | |
| Add ASTE to Watchlist: View: Get Complete ASTE Trend Analysis ➞ | |
 | GABC German American Bancorp, Inc. |
| Sector: Financials | |
| SubSector: Regional - Midwest Banks | |
| MarketCap: 731.47 Millions | |
| Recent Price: 33.18 Smart Investing & Trading Score: 42 | |
| Day Percent Change: 4.08% Day Change: 1.30 | |
| Week Change: 3.46% Year-to-date Change: 2.4% | |
| GABC Links: Profile News Message Board | |
| Charts:- Daily , Weekly | |
| Add GABC to Watchlist: View: Get Complete GABC Trend Analysis ➞ | |
 | GRC The Gorman-Rupp Company |
| Sector: Industrials | |
| SubSector: Diversified Machinery | |
| MarketCap: 729.616 Millions | |
| Recent Price: 36.07 Smart Investing & Trading Score: 51 | |
| Day Percent Change: 0.08% Day Change: 0.03 | |
| Week Change: -1.66% Year-to-date Change: 1.5% | |
| GRC Links: Profile News Message Board | |
| Charts:- Daily , Weekly | |
| Add GRC to Watchlist: View: Get Complete GRC Trend Analysis ➞ | |
 | PHAT Phathom Pharmaceuticals, Inc. |
| Sector: Health Care | |
| SubSector: Biotechnology | |
| MarketCap: 728.785 Millions | |
| Recent Price: 8.98 Smart Investing & Trading Score: 31 | |
| Day Percent Change: -5.27% Day Change: -0.50 | |
| Week Change: -11.44% Year-to-date Change: -1.6% | |
| PHAT Links: Profile News Message Board | |
| Charts:- Daily , Weekly | |
| Add PHAT to Watchlist: View: Get Complete PHAT Trend Analysis ➞ | |
 | PLUS ePlus inc. |
| Sector: Technology | |
| SubSector: Application Software | |
| MarketCap: 728.262 Millions | |
| Recent Price: 75.32 Smart Investing & Trading Score: 13 | |
| Day Percent Change: 0.05% Day Change: 0.04 | |
| Week Change: -2.27% Year-to-date Change: -5.7% | |
| PLUS Links: Profile News Message Board | |
| Charts:- Daily , Weekly | |
| Add PLUS to Watchlist: View: Get Complete PLUS Trend Analysis ➞ | |
 | GVA Granite Construction Incorporated |
| Sector: Industrials | |
| SubSector: Heavy Construction | |
| MarketCap: 725.895 Millions | |
| Recent Price: 53.47 Smart Investing & Trading Score: 41 | |
| Day Percent Change: -0.39% Day Change: -0.21 | |
| Week Change: -3.38% Year-to-date Change: 5.1% | |
| GVA Links: Profile News Message Board | |
| Charts:- Daily , Weekly | |
| Add GVA to Watchlist: View: Get Complete GVA Trend Analysis ➞ | |
 | BASE Couchbase, Inc. |
| Sector: Technology | |
| SubSector: Software - Infrastructure | |
| MarketCap: 724 Millions | |
| Recent Price: 22.57 Smart Investing & Trading Score: 0 | |
| Day Percent Change: -6.66% Day Change: -1.61 | |
| Week Change: -8.51% Year-to-date Change: -1.0% | |
| BASE Links: Profile News Message Board | |
| Charts:- Daily , Weekly | |
| Add BASE to Watchlist: View: Get Complete BASE Trend Analysis ➞ | |
 | FARO FARO Technologies, Inc. |
| Sector: Technology | |
| SubSector: Scientific & Technical Instruments | |
| MarketCap: 721.953 Millions | |
| Recent Price: 18.70 Smart Investing & Trading Score: 15 | |
| Day Percent Change: 2.07% Day Change: 0.38 | |
| Week Change: -6.41% Year-to-date Change: -17.0% | |
| FARO Links: Profile News Message Board | |
| Charts:- Daily , Weekly | |
| Add FARO to Watchlist: View: Get Complete FARO Trend Analysis ➞ | |
 | SKT Tanger Factory Outlet Centers, Inc. |
| Sector: Financials | |
| SubSector: REIT - Retail | |
| MarketCap: 720.214 Millions | |
| Recent Price: 26.67 Smart Investing & Trading Score: 25 | |
| Day Percent Change: -0.56% Day Change: -0.15 | |
| Week Change: -0.34% Year-to-date Change: -3.8% | |
| SKT Links: Profile News Message Board | |
| Charts:- Daily , Weekly | |
| Add SKT to Watchlist: View: Get Complete SKT Trend Analysis ➞ | |
 | MLYS Mineralys Therapeutics, Inc. |
| Sector: Health Care | |
| SubSector: Biotechnology | |
| MarketCap: 719 Millions | |
| Recent Price: 10.99 Smart Investing & Trading Score: 23 | |
| Day Percent Change: -5.34% Day Change: -0.62 | |
| Week Change: -15.53% Year-to-date Change: 26.0% | |
| MLYS Links: Profile News Message Board | |
| Charts:- Daily , Weekly | |
| Add MLYS to Watchlist: View: Get Complete MLYS Trend Analysis ➞ | |
 | VREX Varex Imaging Corporation |
| Sector: Health Care | |
| SubSector: Medical Appliances & Equipment | |
| MarketCap: 718.78 Millions | |
| Recent Price: 16.99 Smart Investing & Trading Score: 38 | |
| Day Percent Change: 0.41% Day Change: 0.07 | |
| Week Change: -1.51% Year-to-date Change: -17.1% | |
| VREX Links: Profile News Message Board | |
| Charts:- Daily , Weekly | |
| Add VREX to Watchlist: View: Get Complete VREX Trend Analysis ➞ | |
 | REZI Resideo Technologies, Inc. |
| Sector: Services & Goods | |
| SubSector: Security & Protection Services | |
| MarketCap: 712.603 Millions | |
| Recent Price: 19.27 Smart Investing & Trading Score: 36 | |
| Day Percent Change: 0.36% Day Change: 0.07 | |
| Week Change: -8.59% Year-to-date Change: 2.4% | |
| REZI Links: Profile News Message Board | |
| Charts:- Daily , Weekly | |
| Add REZI to Watchlist: View: Get Complete REZI Trend Analysis ➞ | |
 | CIFR Cipher Mining Inc. |
| Sector: Financials | |
| SubSector: Capital Markets | |
| MarketCap: 712 Millions | |
| Recent Price: 3.84 Smart Investing & Trading Score: 58 | |
| Day Percent Change: 3.64% Day Change: 0.13 | |
| Week Change: 0.39% Year-to-date Change: -6.6% | |
| CIFR Links: Profile News Message Board | |
| Charts:- Daily , Weekly | |
| Add CIFR to Watchlist: View: Get Complete CIFR Trend Analysis ➞ | |
 | PLAB Photronics, Inc. |
| Sector: Technology | |
| SubSector: Semiconductor Equipment & Materials | |
| MarketCap: 709.018 Millions | |
| Recent Price: 25.33 Smart Investing & Trading Score: 0 | |
| Day Percent Change: -2.91% Day Change: -0.76 | |
| Week Change: -8.32% Year-to-date Change: -19.3% | |
| PLAB Links: Profile News Message Board | |
| Charts:- Daily , Weekly | |
| Add PLAB to Watchlist: View: Get Complete PLAB Trend Analysis ➞ | |
 | NTLA Intellia Therapeutics, Inc. |
| Sector: Health Care | |
| SubSector: Biotechnology | |
| MarketCap: 707.185 Millions | |
| Recent Price: 21.57 Smart Investing & Trading Score: 10 | |
| Day Percent Change: 1.17% Day Change: 0.25 | |
| Week Change: -11.12% Year-to-date Change: -29.3% | |
| NTLA Links: Profile News Message Board | |
| Charts:- Daily , Weekly | |
| Add NTLA to Watchlist: View: Get Complete NTLA Trend Analysis ➞ | |
 | PWP Perella Weinberg Partners |
| Sector: Financials | |
| SubSector: Capital Markets | |
| MarketCap: 705 Millions | |
| Recent Price: 15.34 Smart Investing & Trading Score: 71 | |
| Day Percent Change: 0.26% Day Change: 0.04 | |
| Week Change: 0.79% Year-to-date Change: 24.2% | |
| PWP Links: Profile News Message Board | |
| Charts:- Daily , Weekly | |
| Add PWP to Watchlist: View: Get Complete PWP Trend Analysis ➞ | |
| Too many stocks? View smallcap stocks filtered by marketcap & sector |
| Marketcap: All SmallCap Stocks (default-no microcap), Large, Mid-Range, Small & MicroCap |
| Sector: Tech, Finance, Energy, Staples, Retail, Industrial, Materials, Utilities & Medical |
|
Best Stocks Today 12Stocks.com |
© 2024 12Stocks.com Terms & Conditions Privacy Contact Us
All Information Provided Only For Education And Not To Be Used For Investing or Trading. See Terms & Conditions


One More Thing ... Get Best Stocks Delivered Daily!
Never Ever Miss A Move With Our Top Ten Stocks Lists
Find Best Stocks In Any Market - Bull or Bear Market
Take A Peek At Our Top Ten Stocks Lists: Daily, Weekly, Year-to-Date & Top Trends
Find Best Stocks In Any Market - Bull or Bear Market
Take A Peek At Our Top Ten Stocks Lists: Daily, Weekly, Year-to-Date & Top Trends
Smallcap Stocks With Best Up Trends [0-bearish to 100-bullish]: Humacyte [100], Old Second[100], Gannett Co[100], Tejon Ranch[100], Cricut [100], Victory Capital[100], United Fire[100], Century Aluminum[100], Portland General[100], Lantheus [100], Oscar Health[100]
Best Smallcap Stocks Year-to-Date:
Agenus [540.17%], CareMax [423.71%], Janux [336.95%], Viking [240.57%], Alpine Immune[238.42%], Longboard [194.11%], Arcutis Bio[181.42%], Avidity Biosciences[153.65%], Super Micro[151.19%], Vera [138.18%], Stoke [129.66%] Best Smallcap Stocks This Week:
Macatawa Bank[46.82%], Vertex Energy[43.27%], Snap One[29.61%], Vanda [24.03%], Humacyte [23.78%], ALX Oncology[22.49%], ContextLogic [20%], ProKidney [16.57%], Calavo Growers[16.33%], Badger Meter[15.61%], Accolade [13.45%] Best Smallcap Stocks Daily:
Tellurian [28.11%], Origin Materials[20.44%], Metropolitan Bank[18.01%], Vertex Energy[13.74%], Genelux [10.37%], Emergent BioSolutions[10.22%], Gevo [10.14%], Riot Blockchain[10.07%], Humacyte [9.86%], Marathon Patent[9.78%], Fossil Group[9.64%]