
 Login Sign Up


| |||||
 |  | ||||

| 12Stocks.com Market Intelligence |
Best SmallCap Stocks
|
| In a hurry? Small Cap Stock Lists: Performance Trends Table, Stock Charts
Sort Small Cap stocks: Daily, Weekly, Year-to-Date, Market Cap & Trends. Filter Small Cap stocks list by sector: Show all, Tech, Finance, Energy, Staples, Retail, Industrial, Materials, Utilities and HealthCare Filter Small Cap stocks list by size: All Large Medium Small and MicroCap |
| 12Stocks.com Small Cap Stocks Performances & Trends Daily | |||||||||
|
|  The overall Smart Investing & Trading Score is 23 (0-bearish to 100-bullish) which puts Small Cap index in short term bearish to neutral trend. The Smart Investing & Trading Score from previous trading session is 13 and hence an improvement of trend.
| ||||||||
Here are the Smart Investing & Trading Scores of the most requested small cap stocks at 12Stocks.com (click stock name for detailed review):
|


| 12Stocks.com: Investing in Smallcap Index with Stocks | |
|
The following table helps investors and traders sort through current performance and trends (as measured by Smart Investing & Trading Score) of various
stocks in the Smallcap Index. Quick View: Move mouse or cursor over stock symbol (ticker) to view short-term technical chart and over stock name to view long term chart. Click on  to add stock symbol to your watchlist and to add stock symbol to your watchlist and  to view watchlist. Click on any ticker or stock name for detailed market intelligence report for that stock. to view watchlist. Click on any ticker or stock name for detailed market intelligence report for that stock. |
12Stocks.com Performance of Stocks in Smallcap Index
| Ticker | Stock Name | Watchlist | Category | Recent Price | Smart Investing & Trading Score | Change % | YTD Change% |
| MSBI | Midland States |   | Financials | 22.81 | 10 | 0.35% | -17.24% |
| CMTL | Comtech Tele | | Technology | 1.88 | 15 | -6.72% | -77.76% |
| HWKN | Hawkins | | Materials | 74.70 | 31 | -0.05% | 6.08% |
| REVG | REV Group | | Consumer Staples | 21.15 | 44 | -0.42% | 16.40% |
| TALO | Talos Energy | | Energy | 13.28 | 36 | 0.08% | -6.68% |
| TNYA | Tenaya | | Health Care | 4.30 | 43 | 0.23% | 35.22% |
| VHI | Valhi | | Materials | 15.10 | 54 | -1.11% | -0.59% |
| LOB | Live Oak | | Financials | 36.71 | 36 | 0.08% | -19.32% |
| ASIX | AdvanSix | | Materials | 26.84 | 43 | 0.56% | -10.41% |
| SKYT | SkyWater | | Technology | 8.79 | 33 | 0.46% | -8.77% |
| FCBC | First Community | | Financials | 31.92 | 42 | 0.69% | -13.96% |
| VCEL | Vericel | | Health Care | 43.86 | 26 | -5.19% | 23.17% |
| AGYS | Agilysys | | Technology | 81.75 | 20 | -0.76% | -3.62% |
| BLX | Banco Latinoamericano | | Financials | 29.56 | 63 | 1.30% | 19.48% |
| CALX | Calix | | Technology | 29.44 | 28 | 0.89% | -32.62% |
| AMSWA | American | | Technology | 10.57 | 10 | -0.19% | -6.46% |
| RSVR | Reservoir Media | | Services & Goods | 7.80 | 68 | 2.97% | 9.62% |
| VKTX | Viking | | Health Care | 64.67 | 41 | -2.71% | 247.50% |
| ZYXI | Zynex | | Health Care | 11.45 | 0 | -5.14% | 5.14% |
| SRDX | Surmodics | | Health Care | 26.39 | 18 | -0.49% | -27.40% |
| SWIM | Latham Group | | Industrials | 3.21 | 53 | 1.10% | 21.40% |
| ONTF | ON24 | | Technology | 6.79 | 13 | 0.97% | -13.95% |
| CUBI | Customers Bancorp | | Financials | 46.83 | 25 | 0.86% | -18.73% |
| TPC | Tutor Perini | | Industrials | 13.38 | 46 | -0.37% | 47.03% |
| TPB | Turning Point | | Consumer Staples | 27.00 | 63 | 1.54% | 2.58% |


| Too many stocks? View smallcap stocks filtered by marketcap & sector |
| Marketcap: All SmallCap Stocks (default-no microcap), Large, Mid-Range, Small |
| Smallcap Sector: Tech, Finance, Energy, Staples, Retail, Industrial, Materials, & Medical |
|
Get the most comprehensive stock market coverage daily at 12Stocks.com ➞ Best Stocks Today ➞ Best Stocks Weekly ➞ Best Stocks Year-to-Date ➞ Best Stocks Trends ➞  Best Stocks Today 12Stocks.com Best Nasdaq Stocks ➞ Best S&P 500 Stocks ➞ Best Tech Stocks ➞ Best Biotech Stocks ➞ |
| Detailed Overview of SmallCap Stocks |
| SmallCap Technical Overview, Leaders & Laggards, Top SmallCap ETF Funds & Detailed SmallCap Stocks List, Charts, Trends & More |
| Smallcap: Technical Analysis, Trends & YTD Performance | |
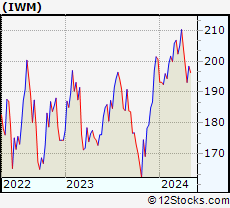
| SmallCap segment as represented by
IWM, an exchange-traded fund [ETF], holds basket of thousands of smallcap stocks from across all major sectors of the US stock market. The smallcap index (contains stocks like Riverbed & Sotheby's) is down by -3.92% and is currently underperforming the overall market by -8.11% year-to-date. Below is a quick view of technical charts and trends: | |
 IWM Weekly Chart |
|
| Long Term Trend: Not Good | |
| Medium Term Trend: Not Good | |
 IWM Daily Chart |
|
| Short Term Trend: Not Good | |
| Overall Trend Score: 23 | |
| YTD Performance: -3.92% | |
| **Trend Scores & Views Are Only For Educational Purposes And Not For Investing | |
| 12Stocks.com: Top Performing Small Cap Index Stocks | ||||||||||||||||||||||||||||||||||||||||||||||||
 The top performing Small Cap Index stocks year to date are
Now, more recently, over last week, the top performing Small Cap Index stocks on the move are


|
||||||||||||||||||||||||||||||||||||||||||||||||
| 12Stocks.com: Investing in Smallcap Index using Exchange Traded Funds | |
|
The following table shows list of key exchange traded funds (ETF) that
help investors track Smallcap index. The following list also includes leveraged ETF funds that track twice or thrice the daily returns of Smallcap indices. Short or inverse ETF funds move in the opposite direction to the index they track and are useful during market pullbacks or during bear markets. Quick View: Move mouse or cursor over ETF symbol (ticker) to view short-term technical chart and over ETF name to view long term chart. Click on ticker or stock name for detailed view. Click on to add stock symbol to your watchlist and to view watchlist. |
12Stocks.com List of ETFs that track Smallcap Index
| Ticker | ETF Name | Watchlist | Recent Price | Smart Investing & Trading Score | Change % | Week % | Year-to-date % |
| IWM | iShares Russell 2000 | | 192.84 | 23 | -0.08 | -2.94 | -3.92% |
| IJR | iShares Core S&P Small-Cap | | 102.34 | 31 | 0.21 | -2.08 | -5.46% |
| VTWO | Vanguard Russell 2000 ETF | | 77.95 | 23 | -0.13 | -2.95 | -3.88% |
| IWN | iShares Russell 2000 Value | | 146.33 | 10 | 0.21 | -2.69 | -5.79% |
| IJS | iShares S&P Small-Cap 600 Value | | 94.51 | 10 | 0.41 | -1.73 | -8.31% |
| IWO | iShares Russell 2000 Growth | | 246.94 | 36 | -0.44 | -3.3 | -2.09% |
| IJT | iShares S&P Small-Cap 600 Growth | | 121.57 | 23 | -0.22 | -2.57 | -2.85% |
| XSLV | PowerShares S&P SmallCap Low Volatil ETF | | 41.65 | 25 | 0.56 | -1.05 | -5.66% |
| SAA | ProShares Ultra SmallCap600 | | 21.62 | 10 | -0.18 | -4.17 | -13.35% |
| SMLV | SPDR SSGA US Small Cap Low Volatil ETF | | 103.83 | 10 | 0.16 | -1.13 | -7.72% |
| SBB | ProShares Short SmallCap600 | | 16.98 | 95 | 0.77 | 2.62 | 6.59% |
| SDD | ProShares UltraShort SmallCap600 | | 20.69 | 83 | 0.44 | 4.33 | 12.28% |
| 12Stocks.com: Charts, Trends, Fundamental Data and Performances of SmallCap Stocks | |
|
We now take in-depth look at all SmallCap stocks including charts, multi-period performances and overall trends (as measured by Smart Investing & Trading Score). One can sort SmallCap stocks (click link to choose) by Daily, Weekly and by Year-to-Date performances. Also, one can sort by size of the company or by market capitalization. |
| Select Your Default Chart Type: | |||||
| |||||
| Click on stock symbol or name for detailed view. Click on to add stock symbol to your watchlist and to view watchlist. Quick View: Move mouse or cursor over "Daily" to quickly view daily technical stock chart and over "Weekly" to view weekly technical stock chart. | |||||

 | MSBI Midland States Bancorp, Inc. |
| Sector: Financials | |
| SubSector: Regional - Midwest Banks | |
| MarketCap: 400.27 Millions | |
| Recent Price: 22.81 Smart Investing & Trading Score: 10 | |
| Day Percent Change: 0.35% Day Change: 0.08 | |
| Week Change: -2.6% Year-to-date Change: -17.2% | |
| MSBI Links: Profile News Message Board | |
| Charts:- Daily , Weekly | |
| Add MSBI to Watchlist: View: Get Complete MSBI Trend Analysis ➞ | |
 | CMTL Comtech Telecommunications Corp. |
| Sector: Technology | |
| SubSector: Communication Equipment | |
| MarketCap: 399.539 Millions | |
| Recent Price: 1.88 Smart Investing & Trading Score: 15 | |
| Day Percent Change: -6.72% Day Change: -0.13 | |
| Week Change: -19.35% Year-to-date Change: -77.8% | |
| CMTL Links: Profile News Message Board | |
| Charts:- Daily , Weekly | |
| Add CMTL to Watchlist: View: Get Complete CMTL Trend Analysis ➞ | |
 | HWKN Hawkins, Inc. |
| Sector: Materials | |
| SubSector: Specialty Chemicals | |
| MarketCap: 398.957 Millions | |
| Recent Price: 74.70 Smart Investing & Trading Score: 31 | |
| Day Percent Change: -0.05% Day Change: -0.04 | |
| Week Change: -3.25% Year-to-date Change: 6.1% | |
| HWKN Links: Profile News Message Board | |
| Charts:- Daily , Weekly | |
| Add HWKN to Watchlist: View: Get Complete HWKN Trend Analysis ➞ | |
 | REVG REV Group, Inc. |
| Sector: Consumer Staples | |
| SubSector: Trucks & Other Vehicles | |
| MarketCap: 398.597 Millions | |
| Recent Price: 21.15 Smart Investing & Trading Score: 44 | |
| Day Percent Change: -0.42% Day Change: -0.09 | |
| Week Change: -5.83% Year-to-date Change: 16.4% | |
| REVG Links: Profile News Message Board | |
| Charts:- Daily , Weekly | |
| Add REVG to Watchlist: View: Get Complete REVG Trend Analysis ➞ | |
 | TALO Talos Energy Inc. |
| Sector: Energy | |
| SubSector: Independent Oil & Gas | |
| MarketCap: 396.293 Millions | |
| Recent Price: 13.28 Smart Investing & Trading Score: 36 | |
| Day Percent Change: 0.08% Day Change: 0.01 | |
| Week Change: -5.61% Year-to-date Change: -6.7% | |
| TALO Links: Profile News Message Board | |
| Charts:- Daily , Weekly | |
| Add TALO to Watchlist: View: Get Complete TALO Trend Analysis ➞ | |
 | TNYA Tenaya Therapeutics, Inc. |
| Sector: Health Care | |
| SubSector: Biotechnology | |
| MarketCap: 395 Millions | |
| Recent Price: 4.30 Smart Investing & Trading Score: 43 | |
| Day Percent Change: 0.23% Day Change: 0.01 | |
| Week Change: -3.59% Year-to-date Change: 35.2% | |
| TNYA Links: Profile News Message Board | |
| Charts:- Daily , Weekly | |
| Add TNYA to Watchlist: View: Get Complete TNYA Trend Analysis ➞ | |
 | VHI Valhi, Inc. |
| Sector: Materials | |
| SubSector: Chemicals - Major Diversified | |
| MarketCap: 394.336 Millions | |
| Recent Price: 15.10 Smart Investing & Trading Score: 54 | |
| Day Percent Change: -1.11% Day Change: -0.17 | |
| Week Change: -0.13% Year-to-date Change: -0.6% | |
| VHI Links: Profile News Message Board | |
| Charts:- Daily , Weekly | |
| Add VHI to Watchlist: View: Get Complete VHI Trend Analysis ➞ | |
 | LOB Live Oak Bancshares, Inc. |
| Sector: Financials | |
| SubSector: Savings & Loans | |
| MarketCap: 394.23 Millions | |
| Recent Price: 36.71 Smart Investing & Trading Score: 36 | |
| Day Percent Change: 0.08% Day Change: 0.03 | |
| Week Change: -3.22% Year-to-date Change: -19.3% | |
| LOB Links: Profile News Message Board | |
| Charts:- Daily , Weekly | |
| Add LOB to Watchlist: View: Get Complete LOB Trend Analysis ➞ | |
 | ASIX AdvanSix Inc. |
| Sector: Materials | |
| SubSector: Chemicals - Major Diversified | |
| MarketCap: 394.136 Millions | |
| Recent Price: 26.84 Smart Investing & Trading Score: 43 | |
| Day Percent Change: 0.56% Day Change: 0.15 | |
| Week Change: -2.26% Year-to-date Change: -10.4% | |
| ASIX Links: Profile News Message Board | |
| Charts:- Daily , Weekly | |
| Add ASIX to Watchlist: View: Get Complete ASIX Trend Analysis ➞ | |
 | SKYT SkyWater Technology, Inc. |
| Sector: Technology | |
| SubSector: Semiconductors | |
| MarketCap: 394 Millions | |
| Recent Price: 8.79 Smart Investing & Trading Score: 33 | |
| Day Percent Change: 0.46% Day Change: 0.04 | |
| Week Change: -9.79% Year-to-date Change: -8.8% | |
| SKYT Links: Profile News Message Board | |
| Charts:- Daily , Weekly | |
| Add SKYT to Watchlist: View: Get Complete SKYT Trend Analysis ➞ | |
 | FCBC First Community Bankshares, Inc. |
| Sector: Financials | |
| SubSector: Regional - Mid-Atlantic Banks | |
| MarketCap: 393.459 Millions | |
| Recent Price: 31.92 Smart Investing & Trading Score: 42 | |
| Day Percent Change: 0.69% Day Change: 0.22 | |
| Week Change: -0.65% Year-to-date Change: -14.0% | |
| FCBC Links: Profile News Message Board | |
| Charts:- Daily , Weekly | |
| Add FCBC to Watchlist: View: Get Complete FCBC Trend Analysis ➞ | |
 | VCEL Vericel Corporation |
| Sector: Health Care | |
| SubSector: Biotechnology | |
| MarketCap: 391.885 Millions | |
| Recent Price: 43.86 Smart Investing & Trading Score: 26 | |
| Day Percent Change: -5.19% Day Change: -2.40 | |
| Week Change: -8.43% Year-to-date Change: 23.2% | |
| VCEL Links: Profile News Message Board | |
| Charts:- Daily , Weekly | |
| Add VCEL to Watchlist: View: Get Complete VCEL Trend Analysis ➞ | |
 | AGYS Agilysys, Inc. |
| Sector: Technology | |
| SubSector: Application Software | |
| MarketCap: 391.862 Millions | |
| Recent Price: 81.75 Smart Investing & Trading Score: 20 | |
| Day Percent Change: -0.76% Day Change: -0.63 | |
| Week Change: -0.78% Year-to-date Change: -3.6% | |
| AGYS Links: Profile News Message Board | |
| Charts:- Daily , Weekly | |
| Add AGYS to Watchlist: View: Get Complete AGYS Trend Analysis ➞ | |
 | BLX Banco Latinoamericano de Comercio Exterior, S.A |
| Sector: Financials | |
| SubSector: Foreign Money Center Banks | |
| MarketCap: 390.471 Millions | |
| Recent Price: 29.56 Smart Investing & Trading Score: 63 | |
| Day Percent Change: 1.30% Day Change: 0.38 | |
| Week Change: 0.48% Year-to-date Change: 19.5% | |
| BLX Links: Profile News Message Board | |
| Charts:- Daily , Weekly | |
| Add BLX to Watchlist: View: Get Complete BLX Trend Analysis ➞ | |
 | CALX Calix, Inc. |
| Sector: Technology | |
| SubSector: Communication Equipment | |
| MarketCap: 390.039 Millions | |
| Recent Price: 29.44 Smart Investing & Trading Score: 28 | |
| Day Percent Change: 0.89% Day Change: 0.26 | |
| Week Change: -2.81% Year-to-date Change: -32.6% | |
| CALX Links: Profile News Message Board | |
| Charts:- Daily , Weekly | |
| Add CALX to Watchlist: View: Get Complete CALX Trend Analysis ➞ | |
 | AMSWA American Software, Inc. |
| Sector: Technology | |
| SubSector: Application Software | |
| MarketCap: 389.862 Millions | |
| Recent Price: 10.57 Smart Investing & Trading Score: 10 | |
| Day Percent Change: -0.19% Day Change: -0.02 | |
| Week Change: -6.04% Year-to-date Change: -6.5% | |
| AMSWA Links: Profile News Message Board | |
| Charts:- Daily , Weekly | |
| Add AMSWA to Watchlist: View: Get Complete AMSWA Trend Analysis ➞ | |
 | RSVR Reservoir Media, Inc. |
| Sector: Services & Goods | |
| SubSector: Entertainment | |
| MarketCap: 389 Millions | |
| Recent Price: 7.80 Smart Investing & Trading Score: 68 | |
| Day Percent Change: 2.97% Day Change: 0.22 | |
| Week Change: 0.45% Year-to-date Change: 9.6% | |
| RSVR Links: Profile News Message Board | |
| Charts:- Daily , Weekly | |
| Add RSVR to Watchlist: View: Get Complete RSVR Trend Analysis ➞ | |
 | VKTX Viking Therapeutics, Inc. |
| Sector: Health Care | |
| SubSector: Biotechnology | |
| MarketCap: 388.585 Millions | |
| Recent Price: 64.67 Smart Investing & Trading Score: 41 | |
| Day Percent Change: -2.71% Day Change: -1.80 | |
| Week Change: -5.76% Year-to-date Change: 247.5% | |
| VKTX Links: Profile News Message Board | |
| Charts:- Daily , Weekly | |
| Add VKTX to Watchlist: View: Get Complete VKTX Trend Analysis ➞ | |
 | ZYXI Zynex, Inc. |
| Sector: Health Care | |
| SubSector: Medical Appliances & Equipment | |
| MarketCap: 388.58 Millions | |
| Recent Price: 11.45 Smart Investing & Trading Score: 0 | |
| Day Percent Change: -5.14% Day Change: -0.62 | |
| Week Change: -3.86% Year-to-date Change: 5.1% | |
| ZYXI Links: Profile News Message Board | |
| Charts:- Daily , Weekly | |
| Add ZYXI to Watchlist: View: Get Complete ZYXI Trend Analysis ➞ | |
 | SRDX Surmodics, Inc. |
| Sector: Health Care | |
| SubSector: Diagnostic Substances | |
| MarketCap: 388.171 Millions | |
| Recent Price: 26.39 Smart Investing & Trading Score: 18 | |
| Day Percent Change: -0.49% Day Change: -0.13 | |
| Week Change: -2.26% Year-to-date Change: -27.4% | |
| SRDX Links: Profile News Message Board | |
| Charts:- Daily , Weekly | |
| Add SRDX to Watchlist: View: Get Complete SRDX Trend Analysis ➞ | |
 | SWIM Latham Group, Inc. |
| Sector: Industrials | |
| SubSector: Building Products & Equipment | |
| MarketCap: 388 Millions | |
| Recent Price: 3.21 Smart Investing & Trading Score: 53 | |
| Day Percent Change: 1.10% Day Change: 0.04 | |
| Week Change: -6.83% Year-to-date Change: 21.4% | |
| SWIM Links: Profile News Message Board | |
| Charts:- Daily , Weekly | |
| Add SWIM to Watchlist: View: Get Complete SWIM Trend Analysis ➞ | |
 | ONTF ON24, Inc. |
| Sector: Technology | |
| SubSector: Software - Application | |
| MarketCap: 386 Millions | |
| Recent Price: 6.79 Smart Investing & Trading Score: 13 | |
| Day Percent Change: 0.97% Day Change: 0.07 | |
| Week Change: -2.93% Year-to-date Change: -14.0% | |
| ONTF Links: Profile News Message Board | |
| Charts:- Daily , Weekly | |
| Add ONTF to Watchlist: View: Get Complete ONTF Trend Analysis ➞ | |
 | CUBI Customers Bancorp, Inc. |
| Sector: Financials | |
| SubSector: Regional - Northeast Banks | |
| MarketCap: 385.399 Millions | |
| Recent Price: 46.83 Smart Investing & Trading Score: 25 | |
| Day Percent Change: 0.86% Day Change: 0.40 | |
| Week Change: -4.47% Year-to-date Change: -18.7% | |
| CUBI Links: Profile News Message Board | |
| Charts:- Daily , Weekly | |
| Add CUBI to Watchlist: View: Get Complete CUBI Trend Analysis ➞ | |
 | TPC Tutor Perini Corporation |
| Sector: Industrials | |
| SubSector: Heavy Construction | |
| MarketCap: 382.595 Millions | |
| Recent Price: 13.38 Smart Investing & Trading Score: 46 | |
| Day Percent Change: -0.37% Day Change: -0.05 | |
| Week Change: -3.46% Year-to-date Change: 47.0% | |
| TPC Links: Profile News Message Board | |
| Charts:- Daily , Weekly | |
| Add TPC to Watchlist: View: Get Complete TPC Trend Analysis ➞ | |
 | TPB Turning Point Brands, Inc. |
| Sector: Consumer Staples | |
| SubSector: Tobacco Products, Other | |
| MarketCap: 381.97 Millions | |
| Recent Price: 27.00 Smart Investing & Trading Score: 63 | |
| Day Percent Change: 1.54% Day Change: 0.41 | |
| Week Change: 0.15% Year-to-date Change: 2.6% | |
| TPB Links: Profile News Message Board | |
| Charts:- Daily , Weekly | |
| Add TPB to Watchlist: View: Get Complete TPB Trend Analysis ➞ | |
| Too many stocks? View smallcap stocks filtered by marketcap & sector |
| Marketcap: All SmallCap Stocks (default-no microcap), Large, Mid-Range, Small & MicroCap |
| Sector: Tech, Finance, Energy, Staples, Retail, Industrial, Materials, Utilities & Medical |
|
Best Stocks Today 12Stocks.com |
© 2024 12Stocks.com Terms & Conditions Privacy Contact Us
All Information Provided Only For Education And Not To Be Used For Investing or Trading. See Terms & Conditions


One More Thing ... Get Best Stocks Delivered Daily!
Never Ever Miss A Move With Our Top Ten Stocks Lists
Find Best Stocks In Any Market - Bull or Bear Market
Take A Peek At Our Top Ten Stocks Lists: Daily, Weekly, Year-to-Date & Top Trends
Find Best Stocks In Any Market - Bull or Bear Market
Take A Peek At Our Top Ten Stocks Lists: Daily, Weekly, Year-to-Date & Top Trends
Smallcap Stocks With Best Up Trends [0-bearish to 100-bullish]: Badger Meter[100], Cullinan Oncology[100], Oscar Health[100], NextNav [100], EchoStar [100], Victory Capital[100], Macatawa Bank[100], IMAX [100], Envestnet [100], ALX Oncology[100], Argan [95]
Best Smallcap Stocks Year-to-Date:
Agenus [500.31%], CareMax [417.53%], Janux [348.12%], Viking [247.5%], Alpine Immune[238.5%], Super Micro[226.63%], Longboard [194.76%], Arcutis Bio[192.57%], Vera [161.3%], Avidity Biosciences[154.87%], Hippo [128.32%] Best Smallcap Stocks This Week:
Macatawa Bank[44.42%], 23andMe Holding[33.3%], ProKidney [32%], Snap One[29.73%], Vertex Energy[25.96%], ALX Oncology[20.64%], Vanda [20.63%], Expensify [18.37%], Badger Meter[16.72%], ContextLogic [15%], Cullinan Oncology[13.89%] Best Smallcap Stocks Daily:
23andMe Holding[65.91%], Vertex Energy[33.78%], Zura Bio[17.20%], Badger Meter[16.65%], ContextLogic [15.81%], Expensify [15.23%], Montrose Environmental[12.84%], Vaxxinity [10.05%], Cipher Mining[8.65%], FiscalNote [8.61%], Vuzix [8.15%]