
 Login Sign Up


| |||||
 |  | ||||

| 12Stocks.com Market Intelligence |
Best SmallCap Stocks
|
| In a hurry? Small Cap Stock Lists: Performance Trends Table, Stock Charts
Sort Small Cap stocks: Daily, Weekly, Year-to-Date, Market Cap & Trends. Filter Small Cap stocks list by sector: Show all, Tech, Finance, Energy, Staples, Retail, Industrial, Materials, Utilities and HealthCare Filter Small Cap stocks list by size: All Large Medium Small and MicroCap |
| 12Stocks.com Small Cap Stocks Performances & Trends Daily | |||||||||
|
|  The overall Smart Investing & Trading Score is 43 (0-bearish to 100-bullish) which puts Small Cap index in short term neutral trend. The Smart Investing & Trading Score from previous trading session is 26 and hence an improvement of trend.
| ||||||||
Here are the Smart Investing & Trading Scores of the most requested small cap stocks at 12Stocks.com (click stock name for detailed review):
|


| 12Stocks.com: Investing in Smallcap Index with Stocks | |
|
The following table helps investors and traders sort through current performance and trends (as measured by Smart Investing & Trading Score) of various
stocks in the Smallcap Index. Quick View: Move mouse or cursor over stock symbol (ticker) to view short-term technical chart and over stock name to view long term chart. Click on  to add stock symbol to your watchlist and to add stock symbol to your watchlist and  to view watchlist. Click on any ticker or stock name for detailed market intelligence report for that stock. to view watchlist. Click on any ticker or stock name for detailed market intelligence report for that stock. |
12Stocks.com Performance of Stocks in Smallcap Index
| Ticker | Stock Name | Watchlist | Category | Recent Price | Smart Investing & Trading Score | Change % | YTD Change% |
| SSD | Simpson |   | Industrials | 181.35 | 23 | -1.82% | -8.40% |
| HRMY | Harmony Biosciences | | Health Care | 29.57 | 35 | -0.69% | -8.41% |
| PJT | PJT Partners | | Financials | 93.27 | 25 | 1.22% | -8.44% |
| INBX | Inhibrx | | Health Care | 34.79 | 0 | 0.52% | -8.47% |
| NBN | Northeast Bank | | Financials | 50.51 | 10 | -0.77% | -8.48% |
| YOU | Clear Secure | | Technology | 18.95 | 28 | -0.21% | -8.54% |
| AAT | American Assets | | Financials | 20.58 | 10 | 1.08% | -8.57% |
| FHTX | Foghorn | | Health Care | 5.87 | 36 | -2.74% | -8.57% |
| TCBX | Third Coast | | Financials | 18.27 | 15 | -0.14% | -8.67% |
| AMKR | Amkor | | Technology | 30.37 | 0 | -2.69% | -8.72% |
| RMNI | Rimini Street | | Technology | 2.98 | 17 | 2.93% | -8.72% |
| DOCN | DigitalOcean | | Technology | 33.76 | 30 | 1.03% | -8.72% |
| ARR | ARMOUR Residential | | Financials | 17.63 | 17 | 1.56% | -8.75% |
| DNUT | Krispy Kreme | | Consumer Staples | 13.87 | 26 | -1.39% | -8.75% |
| PDM | Piedmont Office | | Financials | 6.49 | 17 | 1.81% | -8.79% |
| VRTS | Virtus | | Financials | 220.49 | 17 | 0.46% | -8.80% |
| CTBI | Community Trust | | Financials | 39.99 | 27 | 1.27% | -8.82% |
| BEAM | Beam | | Health Care | 24.82 | 36 | -3.42% | -8.82% |
| PCYO | Pure Cycle | | Utilities | 9.54 | 42 | 0.32% | -8.88% |
| XNCR | Xencor | | Health Care | 19.34 | 46 | 2.22% | -8.90% |
| SIG | Signet Jewelers | | Services & Goods | 97.69 | 42 | 1.10% | -8.92% |
| RDVT | Red Violet | | Technology | 18.18 | 20 | -0.16% | -8.96% |
| HSTM | HealthStream | | Technology | 24.57 | 25 | -0.43% | -9.12% |
| LKFN | Lakeland Financial | | Financials | 59.21 | 37 | -0.22% | -9.13% |
| CNO | CNO Financial | | Financials | 25.34 | 25 | -1.03% | -9.16% |


| Too many stocks? View smallcap stocks filtered by marketcap & sector |
| Marketcap: All SmallCap Stocks (default-no microcap), Large, Mid-Range, Small |
| Smallcap Sector: Tech, Finance, Energy, Staples, Retail, Industrial, Materials, & Medical |
|
Get the most comprehensive stock market coverage daily at 12Stocks.com ➞ Best Stocks Today ➞ Best Stocks Weekly ➞ Best Stocks Year-to-Date ➞ Best Stocks Trends ➞  Best Stocks Today 12Stocks.com Best Nasdaq Stocks ➞ Best S&P 500 Stocks ➞ Best Tech Stocks ➞ Best Biotech Stocks ➞ |
| Detailed Overview of SmallCap Stocks |
| SmallCap Technical Overview, Leaders & Laggards, Top SmallCap ETF Funds & Detailed SmallCap Stocks List, Charts, Trends & More |
| Smallcap: Technical Analysis, Trends & YTD Performance | |
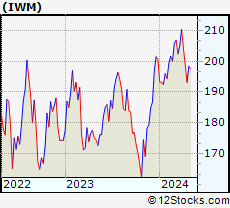
| SmallCap segment as represented by
IWM, an exchange-traded fund [ETF], holds basket of thousands of smallcap stocks from across all major sectors of the US stock market. The smallcap index (contains stocks like Riverbed & Sotheby's) is down by -2.93% and is currently underperforming the overall market by -7.9% year-to-date. Below is a quick view of technical charts and trends: | |
 IWM Weekly Chart |
|
| Long Term Trend: Good | |
| Medium Term Trend: Not Good | |
 IWM Daily Chart |
|
| Short Term Trend: Not Good | |
| Overall Trend Score: 43 | |
| YTD Performance: -2.93% | |
| **Trend Scores & Views Are Only For Educational Purposes And Not For Investing | |
| 12Stocks.com: Top Performing Small Cap Index Stocks | ||||||||||||||||||||||||||||||||||||||||||||||||
 The top performing Small Cap Index stocks year to date are
Now, more recently, over last week, the top performing Small Cap Index stocks on the move are


|
||||||||||||||||||||||||||||||||||||||||||||||||
| 12Stocks.com: Investing in Smallcap Index using Exchange Traded Funds | |
|
The following table shows list of key exchange traded funds (ETF) that
help investors track Smallcap index. The following list also includes leveraged ETF funds that track twice or thrice the daily returns of Smallcap indices. Short or inverse ETF funds move in the opposite direction to the index they track and are useful during market pullbacks or during bear markets. Quick View: Move mouse or cursor over ETF symbol (ticker) to view short-term technical chart and over ETF name to view long term chart. Click on ticker or stock name for detailed view. Click on to add stock symbol to your watchlist and to view watchlist. |
12Stocks.com List of ETFs that track Smallcap Index
| Ticker | ETF Name | Watchlist | Recent Price | Smart Investing & Trading Score | Change % | Week % | Year-to-date % |
| IWM | iShares Russell 2000 | | 194.83 | 43 | -0.12 | -1.94 | -2.93% |
| VTWO | Vanguard Russell 2000 ETF | | 78.77 | 36 | -0.13 | -1.93 | -2.87% |
| IJR | iShares Core S&P Small-Cap | | 102.94 | 17 | 0.21 | -1.5 | -4.91% |
| IWN | iShares Russell 2000 Value | | 147.37 | 30 | 0.14 | -2 | -5.12% |
| IWO | iShares Russell 2000 Growth | | 250.93 | 43 | 0.27 | -1.73 | -0.51% |
| IJS | iShares S&P Small-Cap 600 Value | | 94.92 | 17 | 0.27 | -1.3 | -7.91% |
| IJT | iShares S&P Small-Cap 600 Growth | | 122.69 | 41 | -0.33 | -1.67 | -1.96% |
| XSLV | PowerShares S&P SmallCap Low Volatil ETF | | 41.58 | 17 | 0.00 | -1.21 | -5.82% |
| SMLV | SPDR SSGA US Small Cap Low Volatil ETF | | 103.94 | 25 | 0.09 | -1.03 | -7.63% |
| SAA | ProShares Ultra SmallCap600 | | 21.83 | 17 | -0.41 | -3.24 | -12.51% |
| SBB | ProShares Short SmallCap600 | | 16.85 | 73 | 0.42 | 1.83 | 5.78% |
| SDD | ProShares UltraShort SmallCap600 | | 20.49 | 73 | 0.69 | 3.33 | 11.2% |
| 12Stocks.com: Charts, Trends, Fundamental Data and Performances of SmallCap Stocks | |
|
We now take in-depth look at all SmallCap stocks including charts, multi-period performances and overall trends (as measured by Smart Investing & Trading Score). One can sort SmallCap stocks (click link to choose) by Daily, Weekly and by Year-to-Date performances. Also, one can sort by size of the company or by market capitalization. |
| Select Your Default Chart Type: | |||||
| |||||
| Click on stock symbol or name for detailed view. Click on to add stock symbol to your watchlist and to view watchlist. Quick View: Move mouse or cursor over "Daily" to quickly view daily technical stock chart and over "Weekly" to view weekly technical stock chart. | |||||

 | SSD Simpson Manufacturing Co., Inc. |
| Sector: Industrials | |
| SubSector: Small Tools & Accessories | |
| MarketCap: 2850.16 Millions | |
| Recent Price: 181.35 Smart Investing & Trading Score: 23 | |
| Day Percent Change: -1.82% Day Change: -3.37 | |
| Week Change: -1.9% Year-to-date Change: -8.4% | |
| SSD Links: Profile News Message Board | |
| Charts:- Daily , Weekly | |
| Add SSD to Watchlist: View: Get Complete SSD Trend Analysis ➞ | |
 | HRMY Harmony Biosciences Holdings, Inc. |
| Sector: Health Care | |
| SubSector: Biotechnology | |
| MarketCap: 24487 Millions | |
| Recent Price: 29.57 Smart Investing & Trading Score: 35 | |
| Day Percent Change: -0.69% Day Change: -0.21 | |
| Week Change: 0.25% Year-to-date Change: -8.4% | |
| HRMY Links: Profile News Message Board | |
| Charts:- Daily , Weekly | |
| Add HRMY to Watchlist: View: Get Complete HRMY Trend Analysis ➞ | |
 | PJT PJT Partners Inc. |
| Sector: Financials | |
| SubSector: Asset Management | |
| MarketCap: 1100.93 Millions | |
| Recent Price: 93.27 Smart Investing & Trading Score: 25 | |
| Day Percent Change: 1.22% Day Change: 1.12 | |
| Week Change: 0.27% Year-to-date Change: -8.4% | |
| PJT Links: Profile News Message Board | |
| Charts:- Daily , Weekly | |
| Add PJT to Watchlist: View: Get Complete PJT Trend Analysis ➞ | |
 | INBX Inhibrx, Inc. |
| Sector: Health Care | |
| SubSector: Biotechnology | |
| MarketCap: 14187 Millions | |
| Recent Price: 34.79 Smart Investing & Trading Score: 0 | |
| Day Percent Change: 0.52% Day Change: 0.18 | |
| Week Change: -0.54% Year-to-date Change: -8.5% | |
| INBX Links: Profile News Message Board | |
| Charts:- Daily , Weekly | |
| Add INBX to Watchlist: View: Get Complete INBX Trend Analysis ➞ | |
 | NBN Northeast Bank |
| Sector: Financials | |
| SubSector: Regional - Northeast Banks | |
| MarketCap: 114.199 Millions | |
| Recent Price: 50.51 Smart Investing & Trading Score: 10 | |
| Day Percent Change: -0.77% Day Change: -0.39 | |
| Week Change: -2.3% Year-to-date Change: -8.5% | |
| NBN Links: Profile News Message Board | |
| Charts:- Daily , Weekly | |
| Add NBN to Watchlist: View: Get Complete NBN Trend Analysis ➞ | |
 | YOU Clear Secure, Inc. |
| Sector: Technology | |
| SubSector: Software - Application | |
| MarketCap: 3510 Millions | |
| Recent Price: 18.95 Smart Investing & Trading Score: 28 | |
| Day Percent Change: -0.21% Day Change: -0.04 | |
| Week Change: -2.17% Year-to-date Change: -8.5% | |
| YOU Links: Profile News Message Board | |
| Charts:- Daily , Weekly | |
| Add YOU to Watchlist: View: Get Complete YOU Trend Analysis ➞ | |
 | AAT American Assets Trust, Inc. |
| Sector: Financials | |
| SubSector: REIT - Retail | |
| MarketCap: 1580.54 Millions | |
| Recent Price: 20.58 Smart Investing & Trading Score: 10 | |
| Day Percent Change: 1.08% Day Change: 0.22 | |
| Week Change: -0.91% Year-to-date Change: -8.6% | |
| AAT Links: Profile News Message Board | |
| Charts:- Daily , Weekly | |
| Add AAT to Watchlist: View: Get Complete AAT Trend Analysis ➞ | |
 | FHTX Foghorn Therapeutics Inc. |
| Sector: Health Care | |
| SubSector: Biotechnology | |
| MarketCap: 74487 Millions | |
| Recent Price: 5.87 Smart Investing & Trading Score: 36 | |
| Day Percent Change: -2.74% Day Change: -0.17 | |
| Week Change: -26.69% Year-to-date Change: -8.6% | |
| FHTX Links: Profile News Message Board | |
| Charts:- Daily , Weekly | |
| Add FHTX to Watchlist: View: Get Complete FHTX Trend Analysis ➞ | |
 | TCBX Third Coast Bancshares, Inc. |
| Sector: Financials | |
| SubSector: Banks - Regional | |
| MarketCap: 212 Millions | |
| Recent Price: 18.27 Smart Investing & Trading Score: 15 | |
| Day Percent Change: -0.14% Day Change: -0.03 | |
| Week Change: -1.22% Year-to-date Change: -8.7% | |
| TCBX Links: Profile News Message Board | |
| Charts:- Daily , Weekly | |
| Add TCBX to Watchlist: View: Get Complete TCBX Trend Analysis ➞ | |
 | AMKR Amkor Technology, Inc. |
| Sector: Technology | |
| SubSector: Semiconductor - Integrated Circuits | |
| MarketCap: 1966.2 Millions | |
| Recent Price: 30.37 Smart Investing & Trading Score: 0 | |
| Day Percent Change: -2.69% Day Change: -0.84 | |
| Week Change: -6.18% Year-to-date Change: -8.7% | |
| AMKR Links: Profile News Message Board | |
| Charts:- Daily , Weekly | |
| Add AMKR to Watchlist: View: Get Complete AMKR Trend Analysis ➞ | |
 | RMNI Rimini Street, Inc. |
| Sector: Technology | |
| SubSector: Application Software | |
| MarketCap: 288.762 Millions | |
| Recent Price: 2.98 Smart Investing & Trading Score: 17 | |
| Day Percent Change: 2.93% Day Change: 0.08 | |
| Week Change: 4.37% Year-to-date Change: -8.7% | |
| RMNI Links: Profile News Message Board | |
| Charts:- Daily , Weekly | |
| Add RMNI to Watchlist: View: Get Complete RMNI Trend Analysis ➞ | |
 | DOCN DigitalOcean Holdings, Inc. |
| Sector: Technology | |
| SubSector: Software - Infrastructure | |
| MarketCap: 3620 Millions | |
| Recent Price: 33.76 Smart Investing & Trading Score: 30 | |
| Day Percent Change: 1.03% Day Change: 0.35 | |
| Week Change: -3.86% Year-to-date Change: -8.7% | |
| DOCN Links: Profile News Message Board | |
| Charts:- Daily , Weekly | |
| Add DOCN to Watchlist: View: Get Complete DOCN Trend Analysis ➞ | |
 | ARR ARMOUR Residential REIT, Inc. |
| Sector: Financials | |
| SubSector: Mortgage Investment | |
| MarketCap: 578.739 Millions | |
| Recent Price: 17.63 Smart Investing & Trading Score: 17 | |
| Day Percent Change: 1.56% Day Change: 0.27 | |
| Week Change: -4.29% Year-to-date Change: -8.8% | |
| ARR Links: Profile News Message Board | |
| Charts:- Daily , Weekly | |
| Add ARR to Watchlist: View: Get Complete ARR Trend Analysis ➞ | |
 | DNUT Krispy Kreme, Inc. |
| Sector: Consumer Staples | |
| SubSector: Grocery Stores | |
| MarketCap: 2480 Millions | |
| Recent Price: 13.87 Smart Investing & Trading Score: 26 | |
| Day Percent Change: -1.39% Day Change: -0.20 | |
| Week Change: -6.32% Year-to-date Change: -8.8% | |
| DNUT Links: Profile News Message Board | |
| Charts:- Daily , Weekly | |
| Add DNUT to Watchlist: View: Get Complete DNUT Trend Analysis ➞ | |
 | PDM Piedmont Office Realty Trust, Inc. |
| Sector: Financials | |
| SubSector: REIT - Office | |
| MarketCap: 2097.46 Millions | |
| Recent Price: 6.49 Smart Investing & Trading Score: 17 | |
| Day Percent Change: 1.81% Day Change: 0.12 | |
| Week Change: -1.74% Year-to-date Change: -8.8% | |
| PDM Links: Profile News Message Board | |
| Charts:- Daily , Weekly | |
| Add PDM to Watchlist: View: Get Complete PDM Trend Analysis ➞ | |
 | VRTS Virtus Investment Partners, Inc. |
| Sector: Financials | |
| SubSector: Asset Management | |
| MarketCap: 601.303 Millions | |
| Recent Price: 220.49 Smart Investing & Trading Score: 17 | |
| Day Percent Change: 0.46% Day Change: 1.02 | |
| Week Change: -2.28% Year-to-date Change: -8.8% | |
| VRTS Links: Profile News Message Board | |
| Charts:- Daily , Weekly | |
| Add VRTS to Watchlist: View: Get Complete VRTS Trend Analysis ➞ | |
 | CTBI Community Trust Bancorp, Inc. |
| Sector: Financials | |
| SubSector: Regional - Southeast Banks | |
| MarketCap: 608.435 Millions | |
| Recent Price: 39.99 Smart Investing & Trading Score: 27 | |
| Day Percent Change: 1.27% Day Change: 0.50 | |
| Week Change: -0.17% Year-to-date Change: -8.8% | |
| CTBI Links: Profile News Message Board | |
| Charts:- Daily , Weekly | |
| Add CTBI to Watchlist: View: Get Complete CTBI Trend Analysis ➞ | |
 | BEAM Beam Therapeutics Inc. |
| Sector: Health Care | |
| SubSector: Biotechnology | |
| MarketCap: 44987 Millions | |
| Recent Price: 24.82 Smart Investing & Trading Score: 36 | |
| Day Percent Change: -3.42% Day Change: -0.88 | |
| Week Change: -4.28% Year-to-date Change: -8.8% | |
| BEAM Links: Profile News Message Board | |
| Charts:- Daily , Weekly | |
| Add BEAM to Watchlist: View: Get Complete BEAM Trend Analysis ➞ | |
 | PCYO Pure Cycle Corporation |
| Sector: Utilities | |
| SubSector: Water Utilities | |
| MarketCap: 247.102 Millions | |
| Recent Price: 9.54 Smart Investing & Trading Score: 42 | |
| Day Percent Change: 0.32% Day Change: 0.03 | |
| Week Change: -0.83% Year-to-date Change: -8.9% | |
| PCYO Links: Profile News Message Board | |
| Charts:- Daily , Weekly | |
| Add PCYO to Watchlist: View: Get Complete PCYO Trend Analysis ➞ | |
 | XNCR Xencor, Inc. |
| Sector: Health Care | |
| SubSector: Biotechnology | |
| MarketCap: 1744.35 Millions | |
| Recent Price: 19.34 Smart Investing & Trading Score: 46 | |
| Day Percent Change: 2.22% Day Change: 0.42 | |
| Week Change: -5.57% Year-to-date Change: -8.9% | |
| XNCR Links: Profile News Message Board | |
| Charts:- Daily , Weekly | |
| Add XNCR to Watchlist: View: Get Complete XNCR Trend Analysis ➞ | |
 | SIG Signet Jewelers Limited |
| Sector: Services & Goods | |
| SubSector: Jewelry Stores | |
| MarketCap: 518.1 Millions | |
| Recent Price: 97.69 Smart Investing & Trading Score: 42 | |
| Day Percent Change: 1.10% Day Change: 1.06 | |
| Week Change: 2% Year-to-date Change: -8.9% | |
| SIG Links: Profile News Message Board | |
| Charts:- Daily , Weekly | |
| Add SIG to Watchlist: View: Get Complete SIG Trend Analysis ➞ | |
 | RDVT Red Violet, Inc. |
| Sector: Technology | |
| SubSector: Application Software | |
| MarketCap: 215.162 Millions | |
| Recent Price: 18.18 Smart Investing & Trading Score: 20 | |
| Day Percent Change: -0.16% Day Change: -0.03 | |
| Week Change: -2.57% Year-to-date Change: -9.0% | |
| RDVT Links: Profile News Message Board | |
| Charts:- Daily , Weekly | |
| Add RDVT to Watchlist: View: Get Complete RDVT Trend Analysis ➞ | |
 | HSTM HealthStream, Inc. |
| Sector: Technology | |
| SubSector: Healthcare Information Services | |
| MarketCap: 770.255 Millions | |
| Recent Price: 24.57 Smart Investing & Trading Score: 25 | |
| Day Percent Change: -0.43% Day Change: -0.11 | |
| Week Change: -0.79% Year-to-date Change: -9.1% | |
| HSTM Links: Profile News Message Board | |
| Charts:- Daily , Weekly | |
| Add HSTM to Watchlist: View: Get Complete HSTM Trend Analysis ➞ | |
 | LKFN Lakeland Financial Corporation |
| Sector: Financials | |
| SubSector: Regional - Midwest Banks | |
| MarketCap: 903.27 Millions | |
| Recent Price: 59.21 Smart Investing & Trading Score: 37 | |
| Day Percent Change: -0.22% Day Change: -0.13 | |
| Week Change: 1.25% Year-to-date Change: -9.1% | |
| LKFN Links: Profile News Message Board | |
| Charts:- Daily , Weekly | |
| Add LKFN to Watchlist: View: Get Complete LKFN Trend Analysis ➞ | |
 | CNO CNO Financial Group, Inc. |
| Sector: Financials | |
| SubSector: Accident & Health Insurance | |
| MarketCap: 1746.9 Millions | |
| Recent Price: 25.34 Smart Investing & Trading Score: 25 | |
| Day Percent Change: -1.03% Day Change: -0.27 | |
| Week Change: -0.3% Year-to-date Change: -9.2% | |
| CNO Links: Profile News Message Board | |
| Charts:- Daily , Weekly | |
| Add CNO to Watchlist: View: Get Complete CNO Trend Analysis ➞ | |
| Too many stocks? View smallcap stocks filtered by marketcap & sector |
| Marketcap: All SmallCap Stocks (default-no microcap), Large, Mid-Range, Small & MicroCap |
| Sector: Tech, Finance, Energy, Staples, Retail, Industrial, Materials, Utilities & Medical |
|
Best Stocks Today 12Stocks.com |
© 2024 12Stocks.com Terms & Conditions Privacy Contact Us
All Information Provided Only For Education And Not To Be Used For Investing or Trading. See Terms & Conditions


One More Thing ... Get Best Stocks Delivered Daily!
Never Ever Miss A Move With Our Top Ten Stocks Lists
Find Best Stocks In Any Market - Bull or Bear Market
Take A Peek At Our Top Ten Stocks Lists: Daily, Weekly, Year-to-Date & Top Trends
Find Best Stocks In Any Market - Bull or Bear Market
Take A Peek At Our Top Ten Stocks Lists: Daily, Weekly, Year-to-Date & Top Trends
Smallcap Stocks With Best Up Trends [0-bearish to 100-bullish]: Vanda [100], ALX Oncology[100], Reneo [100], ProKidney [100], Cullinan Oncology[100], IMAX [100], Oscar Health[100], Envestnet [100], Macatawa Bank[100], Intra-Cellular Therapies[100], NextNav [100]
Best Smallcap Stocks Year-to-Date:
Agenus [578.83%], CareMax [418.56%], Janux [362.82%], Viking [265.5%], Super Micro[241.81%], Alpine Immune[238.58%], Arcutis Bio[218.73%], Longboard [181.01%], Vera [166.99%], Avidity Biosciences[164.93%], Stoke [131.18%] Best Smallcap Stocks This Week:
ProKidney [70.86%], Macatawa Bank[42.54%], Snap One[29.61%], ALX Oncology[27.82%], Vanda [27.18%], Intra-Cellular Therapies[20.54%], Zuora [14.36%], Escalade [13.71%], Encore Wire[10.31%], Cullinan Oncology[10.29%], Design [9.89%] Best Smallcap Stocks Daily:
Vanda [29.38%], WW [17.31%], Karyopharm [17.27%], Children s[16.60%], Zuora [16.12%], ALX Oncology[14.94%], Cutera [12.94%], Lineage Cell[12.17%], Citius [11.62%], Reneo [11.52%], Maxeon Solar[9.97%]