
 Login Sign Up


| |||||
 |  | ||||

| 12Stocks.com Market Intelligence |
Best SmallCap Stocks
|
| In a hurry? Small Cap Stock Lists: Performance Trends Table, Stock Charts
Sort Small Cap stocks: Daily, Weekly, Year-to-Date, Market Cap & Trends. Filter Small Cap stocks list by sector: Show all, Tech, Finance, Energy, Staples, Retail, Industrial, Materials, Utilities and HealthCare Filter Small Cap stocks list by size: All Large Medium Small and MicroCap |
| 12Stocks.com Small Cap Stocks Performances & Trends Daily | |||||||||
|
|  The overall Smart Investing & Trading Score is 63 (0-bearish to 100-bullish) which puts Small Cap index in short term neutral to bullish trend. The Smart Investing & Trading Score from previous trading session is 58 and hence an improvement of trend.
| ||||||||
Here are the Smart Investing & Trading Scores of the most requested small cap stocks at 12Stocks.com (click stock name for detailed review):
|


| 12Stocks.com: Investing in Smallcap Index with Stocks | |
|
The following table helps investors and traders sort through current performance and trends (as measured by Smart Investing & Trading Score) of various
stocks in the Smallcap Index. Quick View: Move mouse or cursor over stock symbol (ticker) to view short-term technical chart and over stock name to view long term chart. Click on  to add stock symbol to your watchlist and to add stock symbol to your watchlist and  to view watchlist. Click on any ticker or stock name for detailed market intelligence report for that stock. to view watchlist. Click on any ticker or stock name for detailed market intelligence report for that stock. |
12Stocks.com Performance of Stocks in Smallcap Index
| Ticker | Stock Name | Watchlist | Category | Recent Price | Smart Investing & Trading Score | Change % | YTD Change% |
| SNCY | Sun Country |   | Industrials | 14.85 | 75 | -1.33% | -6.10% |
| PJT | PJT Partners | | Financials | 95.64 | 62 | 0.25% | -6.12% |
| OB | Outbrain | | Services & Goods | 4.11 | 93 | 0.98% | -6.16% |
| SIG | Signet Jewelers | | Services & Goods | 100.64 | 80 | 0.53% | -6.17% |
| PNRG | PrimeEnergy Resources | | Energy | 99.79 | 58 | -0.21% | -6.17% |
| APLE | Apple Hospitality | | Financials | 15.59 | 42 | 1.07% | -6.17% |
| DEI | Douglas Emmett | | Financials | 13.60 | 87 | 1.95% | -6.21% |
| DLX | Deluxe | | Services & Goods | 20.11 | 95 | 1.46% | -6.25% |
| LPG | Dorian LPG | | Transports | 41.13 | 95 | 0.59% | -6.25% |
| FRME | First Merchants | | Financials | 34.75 | 100 | 2.24% | -6.28% |
| GTY | Getty Realty | | Financials | 27.36 | 74 | 0.51% | -6.37% |
| BUSE | First Busey | | Financials | 23.23 | 67 | 1.49% | -6.41% |
| DX | Dynex Capital | | Financials | 11.70 | 37 | 2.09% | -6.55% |
| CSGS | CSG Systems | | Technology | 49.72 | 74 | 1.00% | -6.56% |
| PDFS | PDF Solutions | | Technology | 30.03 | 10 | 1.15% | -6.57% |
| COMP | Compass | | Technology | 3.48 | 63 | 4.82% | -6.58% |
| NSP | Insperity | | Services & Goods | 109.48 | 74 | 0.43% | -6.60% |
| AMSWA | American | | Technology | 10.55 | 28 | 0.67% | -6.64% |
| VGR | Vector Group | | Consumer Staples | 10.52 | 87 | 0.77% | -6.74% |
| ARI | Apollo Commercial | | Financials | 10.94 | 67 | 1.44% | -6.86% |
| NBHC | National Bank | | Financials | 34.63 | 67 | 1.94% | -6.88% |
| FBRT | Franklin BSP | | Financials | 12.69 | 67 | 1.85% | -6.89% |
| PLPC | Preformed Line | | Industrials | 124.60 | 58 | 1.78% | -6.92% |
| WSR | Whitestone REIT | | Financials | 11.44 | 57 | 0.97% | -6.92% |
| UNTY | Unity Bancorp | | Financials | 27.51 | 64 | 1.89% | -7.03% |
| For chart view version of above stock list: Chart View ➞ 0 - 25 , 25 - 50 , 50 - 75 , 75 - 100 , 100 - 125 , 125 - 150 , 150 - 175 , 175 - 200 , 200 - 225 , 225 - 250 , 250 - 275 , 275 - 300 , 300 - 325 , 325 - 350 , 350 - 375 , 375 - 400 , 400 - 425 , 425 - 450 , 450 - 475 , 475 - 500 , 500 - 525 , 525 - 550 , 550 - 575 , 575 - 600 , 600 - 625 , 625 - 650 , 650 - 675 , 675 - 700 , 700 - 725 , 725 - 750 , 750 - 775 , 775 - 800 , 800 - 825 , 825 - 850 , 850 - 875 , 875 - 900 , 900 - 925 , 925 - 950 , 950 - 975 , 975 - 1000 , 1000 - 1025 , 1025 - 1050 , 1050 - 1075 , 1075 - 1100 , 1100 - 1125 , 1125 - 1150 , 1150 - 1175 , 1175 - 1200 , 1200 - 1225 , 1225 - 1250 , 1250 - 1275 , 1275 - 1300 , 1300 - 1325 , 1325 - 1350 , 1350 - 1375 | ||
 | Click To Change The Sort Order: By Market Cap or Company Size Performance: Year-to-date, Week and Day |  |
| Too many stocks? View smallcap stocks filtered by marketcap & sector |
| Marketcap: All SmallCap Stocks (default-no microcap), Large, Mid-Range, Small |
| Smallcap Sector: Tech, Finance, Energy, Staples, Retail, Industrial, Materials, & Medical |
|
Get the most comprehensive stock market coverage daily at 12Stocks.com ➞ Best Stocks Today ➞ Best Stocks Weekly ➞ Best Stocks Year-to-Date ➞ Best Stocks Trends ➞  Best Stocks Today 12Stocks.com Best Nasdaq Stocks ➞ Best S&P 500 Stocks ➞ Best Tech Stocks ➞ Best Biotech Stocks ➞ |
| Detailed Overview of SmallCap Stocks |
| SmallCap Technical Overview, Leaders & Laggards, Top SmallCap ETF Funds & Detailed SmallCap Stocks List, Charts, Trends & More |
| Smallcap: Technical Analysis, Trends & YTD Performance | |
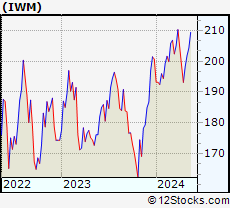
| SmallCap segment as represented by
IWM, an exchange-traded fund [ETF], holds basket of thousands of smallcap stocks from across all major sectors of the US stock market. The smallcap index (contains stocks like Riverbed & Sotheby's) is down by -1.27% and is currently underperforming the overall market by -6.76% year-to-date. Below is a quick view of technical charts and trends: | |
 IWM Weekly Chart |
|
| Long Term Trend: Good | |
| Medium Term Trend: Not Good | |
 IWM Daily Chart |
|
| Short Term Trend: Very Good | |
| Overall Trend Score: 63 | |
| YTD Performance: -1.27% | |
| **Trend Scores & Views Are Only For Educational Purposes And Not For Investing | |
| 12Stocks.com: Top Performing Small Cap Index Stocks | ||||||||||||||||||||||||||||||||||||||||||||||||
 The top performing Small Cap Index stocks year to date are
Now, more recently, over last week, the top performing Small Cap Index stocks on the move are


|
||||||||||||||||||||||||||||||||||||||||||||||||
| 12Stocks.com: Investing in Smallcap Index using Exchange Traded Funds | |
|
The following table shows list of key exchange traded funds (ETF) that
help investors track Smallcap index. The following list also includes leveraged ETF funds that track twice or thrice the daily returns of Smallcap indices. Short or inverse ETF funds move in the opposite direction to the index they track and are useful during market pullbacks or during bear markets. Quick View: Move mouse or cursor over ETF symbol (ticker) to view short-term technical chart and over ETF name to view long term chart. Click on ticker or stock name for detailed view. Click on to add stock symbol to your watchlist and to view watchlist. |
12Stocks.com List of ETFs that track Smallcap Index
| Ticker | ETF Name | Watchlist | Recent Price | Smart Investing & Trading Score | Change % | Week % | Year-to-date % |
| IWM | iShares Russell 2000 | | 198.16 | 63 | 1.46 | 2.6 | -1.27% |
| VTWO | Vanguard Russell 2000 ETF | | 80.14 | 70 | 1.54 | 2.63 | -1.19% |
| IJR | iShares Core S&P Small-Cap | | 105.44 | 75 | 1.91 | 2.16 | -2.59% |
| IWN | iShares Russell 2000 Value | | 151.50 | 68 | 1.33 | 2.52 | -2.47% |
| IWO | iShares Russell 2000 Growth | | 252.16 | 58 | 1.71 | 2.8 | -0.02% |
| IJS | iShares S&P Small-Cap 600 Value | | 97.77 | 67 | 1.39 | 2.26 | -5.14% |
| IJT | iShares S&P Small-Cap 600 Growth | | 123.36 | 70 | 0.00 | 0.94 | -1.42% |
| XSLV | PowerShares S&P SmallCap Low Volatil ETF | | 42.95 | 80 | 1.21 | 1.84 | -2.71% |
| SMLV | SPDR SSGA US Small Cap Low Volatil ETF | | 107.10 | 65 | -0.35 | 0.95 | -4.82% |
| 12Stocks.com: Charts, Trends, Fundamental Data and Performances of SmallCap Stocks | |
|
We now take in-depth look at all SmallCap stocks including charts, multi-period performances and overall trends (as measured by Smart Investing & Trading Score). One can sort SmallCap stocks (click link to choose) by Daily, Weekly and by Year-to-Date performances. Also, one can sort by size of the company or by market capitalization. |
| Select Your Default Chart Type: | |||||
| |||||
| Click on stock symbol or name for detailed view. Click on to add stock symbol to your watchlist and to view watchlist. Quick View: Move mouse or cursor over "Daily" to quickly view daily technical stock chart and over "Weekly" to view weekly technical stock chart. | |||||

 | SNCY Sun Country Airlines Holdings, Inc. |
| Sector: Industrials | |
| SubSector: Airlines | |
| MarketCap: 1230 Millions | |
| Recent Price: 14.85 Smart Investing & Trading Score: 75 | |
| Day Percent Change: -1.33% Day Change: -0.20 | |
| Week Change: -0.13% Year-to-date Change: -6.1% | |
| SNCY Links: Profile News Message Board | |
| Charts:- Daily , Weekly | |
| Add SNCY to Watchlist: View: Get Complete SNCY Trend Analysis ➞ | |
 | PJT PJT Partners Inc. |
| Sector: Financials | |
| SubSector: Asset Management | |
| MarketCap: 1100.93 Millions | |
| Recent Price: 95.64 Smart Investing & Trading Score: 62 | |
| Day Percent Change: 0.25% Day Change: 0.24 | |
| Week Change: 4.23% Year-to-date Change: -6.1% | |
| PJT Links: Profile News Message Board | |
| Charts:- Daily , Weekly | |
| Add PJT to Watchlist: View: Get Complete PJT Trend Analysis ➞ | |
 | OB Outbrain Inc. |
| Sector: Services & Goods | |
| SubSector: Internet Content & Information | |
| MarketCap: 250 Millions | |
| Recent Price: 4.11 Smart Investing & Trading Score: 93 | |
| Day Percent Change: 0.98% Day Change: 0.04 | |
| Week Change: 0.49% Year-to-date Change: -6.2% | |
| OB Links: Profile News Message Board | |
| Charts:- Daily , Weekly | |
| Add OB to Watchlist: View: Get Complete OB Trend Analysis ➞ | |
 | SIG Signet Jewelers Limited |
| Sector: Services & Goods | |
| SubSector: Jewelry Stores | |
| MarketCap: 518.1 Millions | |
| Recent Price: 100.64 Smart Investing & Trading Score: 80 | |
| Day Percent Change: 0.53% Day Change: 0.53 | |
| Week Change: 5.42% Year-to-date Change: -6.2% | |
| SIG Links: Profile News Message Board | |
| Charts:- Daily , Weekly | |
| Add SIG to Watchlist: View: Get Complete SIG Trend Analysis ➞ | |
 | PNRG PrimeEnergy Resources Corporation |
| Sector: Energy | |
| SubSector: Independent Oil & Gas | |
| MarketCap: 112.593 Millions | |
| Recent Price: 99.79 Smart Investing & Trading Score: 58 | |
| Day Percent Change: -0.21% Day Change: -0.21 | |
| Week Change: -1.24% Year-to-date Change: -6.2% | |
| PNRG Links: Profile News Message Board | |
| Charts:- Daily , Weekly | |
| Add PNRG to Watchlist: View: Get Complete PNRG Trend Analysis ➞ | |
 | APLE Apple Hospitality REIT, Inc. |
| Sector: Financials | |
| SubSector: REIT - Hotel/Motel | |
| MarketCap: 1515.74 Millions | |
| Recent Price: 15.59 Smart Investing & Trading Score: 42 | |
| Day Percent Change: 1.07% Day Change: 0.17 | |
| Week Change: 2.94% Year-to-date Change: -6.2% | |
| APLE Links: Profile News Message Board | |
| Charts:- Daily , Weekly | |
| Add APLE to Watchlist: View: Get Complete APLE Trend Analysis ➞ | |
 | DEI Douglas Emmett, Inc. |
| Sector: Financials | |
| SubSector: REIT - Diversified | |
| MarketCap: 4917.83 Millions | |
| Recent Price: 13.60 Smart Investing & Trading Score: 87 | |
| Day Percent Change: 1.95% Day Change: 0.26 | |
| Week Change: 2.18% Year-to-date Change: -6.2% | |
| DEI Links: Profile News Message Board | |
| Charts:- Daily , Weekly | |
| Add DEI to Watchlist: View: Get Complete DEI Trend Analysis ➞ | |
 | DLX Deluxe Corporation |
| Sector: Services & Goods | |
| SubSector: Business Services | |
| MarketCap: 1025.82 Millions | |
| Recent Price: 20.11 Smart Investing & Trading Score: 95 | |
| Day Percent Change: 1.46% Day Change: 0.29 | |
| Week Change: 2.03% Year-to-date Change: -6.3% | |
| DLX Links: Profile News Message Board | |
| Charts:- Daily , Weekly | |
| Add DLX to Watchlist: View: Get Complete DLX Trend Analysis ➞ | |
 | LPG Dorian LPG Ltd. |
| Sector: Transports | |
| SubSector: Shipping | |
| MarketCap: 426.414 Millions | |
| Recent Price: 41.13 Smart Investing & Trading Score: 95 | |
| Day Percent Change: 0.59% Day Change: 0.24 | |
| Week Change: 3.34% Year-to-date Change: -6.3% | |
| LPG Links: Profile News Message Board | |
| Charts:- Daily , Weekly | |
| Add LPG to Watchlist: View: Get Complete LPG Trend Analysis ➞ | |
 | FRME First Merchants Corporation |
| Sector: Financials | |
| SubSector: Regional - Midwest Banks | |
| MarketCap: 1490.4 Millions | |
| Recent Price: 34.75 Smart Investing & Trading Score: 100 | |
| Day Percent Change: 2.24% Day Change: 0.76 | |
| Week Change: 2% Year-to-date Change: -6.3% | |
| FRME Links: Profile News Message Board | |
| Charts:- Daily , Weekly | |
| Add FRME to Watchlist: View: Get Complete FRME Trend Analysis ➞ | |
 | GTY Getty Realty Corp. |
| Sector: Financials | |
| SubSector: REIT - Retail | |
| MarketCap: 926.114 Millions | |
| Recent Price: 27.36 Smart Investing & Trading Score: 74 | |
| Day Percent Change: 0.51% Day Change: 0.14 | |
| Week Change: 1.37% Year-to-date Change: -6.4% | |
| GTY Links: Profile News Message Board | |
| Charts:- Daily , Weekly | |
| Add GTY to Watchlist: View: Get Complete GTY Trend Analysis ➞ | |
 | BUSE First Busey Corporation |
| Sector: Financials | |
| SubSector: Regional - Midwest Banks | |
| MarketCap: 876.97 Millions | |
| Recent Price: 23.23 Smart Investing & Trading Score: 67 | |
| Day Percent Change: 1.49% Day Change: 0.34 | |
| Week Change: 1.84% Year-to-date Change: -6.4% | |
| BUSE Links: Profile News Message Board | |
| Charts:- Daily , Weekly | |
| Add BUSE to Watchlist: View: Get Complete BUSE Trend Analysis ➞ | |
 | DX Dynex Capital, Inc. |
| Sector: Financials | |
| SubSector: Mortgage Investment | |
| MarketCap: 327.839 Millions | |
| Recent Price: 11.70 Smart Investing & Trading Score: 37 | |
| Day Percent Change: 2.09% Day Change: 0.24 | |
| Week Change: -0.09% Year-to-date Change: -6.6% | |
| DX Links: Profile News Message Board | |
| Charts:- Daily , Weekly | |
| Add DX to Watchlist: View: Get Complete DX Trend Analysis ➞ | |
 | CSGS CSG Systems International, Inc. |
| Sector: Technology | |
| SubSector: Business Software & Services | |
| MarketCap: 1336.78 Millions | |
| Recent Price: 49.72 Smart Investing & Trading Score: 74 | |
| Day Percent Change: 1.00% Day Change: 0.49 | |
| Week Change: 1.68% Year-to-date Change: -6.6% | |
| CSGS Links: Profile News Message Board | |
| Charts:- Daily , Weekly | |
| Add CSGS to Watchlist: View: Get Complete CSGS Trend Analysis ➞ | |
 | PDFS PDF Solutions, Inc. |
| Sector: Technology | |
| SubSector: Technical & System Software | |
| MarketCap: 345.1 Millions | |
| Recent Price: 30.03 Smart Investing & Trading Score: 10 | |
| Day Percent Change: 1.15% Day Change: 0.34 | |
| Week Change: 1.59% Year-to-date Change: -6.6% | |
| PDFS Links: Profile News Message Board | |
| Charts:- Daily , Weekly | |
| Add PDFS to Watchlist: View: Get Complete PDFS Trend Analysis ➞ | |
 | COMP Compass, Inc. |
| Sector: Technology | |
| SubSector: Software - Application | |
| MarketCap: 1580 Millions | |
| Recent Price: 3.48 Smart Investing & Trading Score: 63 | |
| Day Percent Change: 4.82% Day Change: 0.16 | |
| Week Change: 7.41% Year-to-date Change: -6.6% | |
| COMP Links: Profile News Message Board | |
| Charts:- Daily , Weekly | |
| Add COMP to Watchlist: View: Get Complete COMP Trend Analysis ➞ | |
 | NSP Insperity, Inc. |
| Sector: Services & Goods | |
| SubSector: Business Services | |
| MarketCap: 1385.32 Millions | |
| Recent Price: 109.48 Smart Investing & Trading Score: 74 | |
| Day Percent Change: 0.43% Day Change: 0.47 | |
| Week Change: 1.04% Year-to-date Change: -6.6% | |
| NSP Links: Profile News Message Board | |
| Charts:- Daily , Weekly | |
| Add NSP to Watchlist: View: Get Complete NSP Trend Analysis ➞ | |
 | AMSWA American Software, Inc. |
| Sector: Technology | |
| SubSector: Application Software | |
| MarketCap: 389.862 Millions | |
| Recent Price: 10.55 Smart Investing & Trading Score: 28 | |
| Day Percent Change: 0.67% Day Change: 0.07 | |
| Week Change: -0.66% Year-to-date Change: -6.6% | |
| AMSWA Links: Profile News Message Board | |
| Charts:- Daily , Weekly | |
| Add AMSWA to Watchlist: View: Get Complete AMSWA Trend Analysis ➞ | |
 | VGR Vector Group Ltd. |
| Sector: Consumer Staples | |
| SubSector: Cigarettes | |
| MarketCap: 1676.53 Millions | |
| Recent Price: 10.52 Smart Investing & Trading Score: 87 | |
| Day Percent Change: 0.77% Day Change: 0.08 | |
| Week Change: 2.33% Year-to-date Change: -6.7% | |
| VGR Links: Profile News Message Board | |
| Charts:- Daily , Weekly | |
| Add VGR to Watchlist: View: Get Complete VGR Trend Analysis ➞ | |
 | ARI Apollo Commercial Real Estate Finance, Inc. |
| Sector: Financials | |
| SubSector: Mortgage Investment | |
| MarketCap: 1302.19 Millions | |
| Recent Price: 10.94 Smart Investing & Trading Score: 67 | |
| Day Percent Change: 1.44% Day Change: 0.16 | |
| Week Change: 2.01% Year-to-date Change: -6.9% | |
| ARI Links: Profile News Message Board | |
| Charts:- Daily , Weekly | |
| Add ARI to Watchlist: View: Get Complete ARI Trend Analysis ➞ | |
 | NBHC National Bank Holdings Corporation |
| Sector: Financials | |
| SubSector: Regional - Midwest Banks | |
| MarketCap: 766.87 Millions | |
| Recent Price: 34.63 Smart Investing & Trading Score: 67 | |
| Day Percent Change: 1.94% Day Change: 0.66 | |
| Week Change: 1.88% Year-to-date Change: -6.9% | |
| NBHC Links: Profile News Message Board | |
| Charts:- Daily , Weekly | |
| Add NBHC to Watchlist: View: Get Complete NBHC Trend Analysis ➞ | |
 | FBRT Franklin BSP Realty Trust, Inc. |
| Sector: Financials | |
| SubSector: REIT - Mortgage | |
| MarketCap: 1170 Millions | |
| Recent Price: 12.69 Smart Investing & Trading Score: 67 | |
| Day Percent Change: 1.85% Day Change: 0.23 | |
| Week Change: 0.95% Year-to-date Change: -6.9% | |
| FBRT Links: Profile News Message Board | |
| Charts:- Daily , Weekly | |
| Add FBRT to Watchlist: View: Get Complete FBRT Trend Analysis ➞ | |
 | PLPC Preformed Line Products Company |
| Sector: Industrials | |
| SubSector: Industrial Electrical Equipment | |
| MarketCap: 221.779 Millions | |
| Recent Price: 124.60 Smart Investing & Trading Score: 58 | |
| Day Percent Change: 1.78% Day Change: 2.18 | |
| Week Change: -0.05% Year-to-date Change: -6.9% | |
| PLPC Links: Profile News Message Board | |
| Charts:- Daily , Weekly | |
| Add PLPC to Watchlist: View: Get Complete PLPC Trend Analysis ➞ | |
 | WSR Whitestone REIT |
| Sector: Financials | |
| SubSector: REIT - Retail | |
| MarketCap: 316.114 Millions | |
| Recent Price: 11.44 Smart Investing & Trading Score: 57 | |
| Day Percent Change: 0.97% Day Change: 0.11 | |
| Week Change: 1.96% Year-to-date Change: -6.9% | |
| WSR Links: Profile News Message Board | |
| Charts:- Daily , Weekly | |
| Add WSR to Watchlist: View: Get Complete WSR Trend Analysis ➞ | |
 | UNTY Unity Bancorp, Inc. |
| Sector: Financials | |
| SubSector: Money Center Banks | |
| MarketCap: 149.099 Millions | |
| Recent Price: 27.51 Smart Investing & Trading Score: 64 | |
| Day Percent Change: 1.89% Day Change: 0.51 | |
| Week Change: 2.23% Year-to-date Change: -7.0% | |
| UNTY Links: Profile News Message Board | |
| Charts:- Daily , Weekly | |
| Add UNTY to Watchlist: View: Get Complete UNTY Trend Analysis ➞ | |
| For tabular summary view of above stock list: Summary View ➞ 0 - 25 , 25 - 50 , 50 - 75 , 75 - 100 , 100 - 125 , 125 - 150 , 150 - 175 , 175 - 200 , 200 - 225 , 225 - 250 , 250 - 275 , 275 - 300 , 300 - 325 , 325 - 350 , 350 - 375 , 375 - 400 , 400 - 425 , 425 - 450 , 450 - 475 , 475 - 500 , 500 - 525 , 525 - 550 , 550 - 575 , 575 - 600 , 600 - 625 , 625 - 650 , 650 - 675 , 675 - 700 , 700 - 725 , 725 - 750 , 750 - 775 , 775 - 800 , 800 - 825 , 825 - 850 , 850 - 875 , 875 - 900 , 900 - 925 , 925 - 950 , 950 - 975 , 975 - 1000 , 1000 - 1025 , 1025 - 1050 , 1050 - 1075 , 1075 - 1100 , 1100 - 1125 , 1125 - 1150 , 1150 - 1175 , 1175 - 1200 , 1200 - 1225 , 1225 - 1250 , 1250 - 1275 , 1275 - 1300 , 1300 - 1325 , 1325 - 1350 , 1350 - 1375 | ||
| Click To Change The Sort Order: By Market Cap or Company Size Performance: Year-to-date, Week and Day | |
| Select Chart Type: | ||
| Too many stocks? View smallcap stocks filtered by marketcap & sector |
| Marketcap: All SmallCap Stocks (default-no microcap), Large, Mid-Range, Small & MicroCap |
| Sector: Tech, Finance, Energy, Staples, Retail, Industrial, Materials, Utilities & Medical |
|
Best Stocks Today 12Stocks.com |
© 2024 12Stocks.com Terms & Conditions Privacy Contact Us
All Information Provided Only For Education And Not To Be Used For Investing or Trading. See Terms & Conditions


One More Thing ... Get Best Stocks Delivered Daily!
Never Ever Miss A Move With Our Top Ten Stocks Lists
Find Best Stocks In Any Market - Bull or Bear Market
Take A Peek At Our Top Ten Stocks Lists: Daily, Weekly, Year-to-Date & Top Trends
Find Best Stocks In Any Market - Bull or Bear Market
Take A Peek At Our Top Ten Stocks Lists: Daily, Weekly, Year-to-Date & Top Trends
Smallcap Stocks With Best Up Trends [0-bearish to 100-bullish]: Hibbett Sports[100], BioLife Solutions[100], AZZ [100], Mueller Industries[100], Oscar Health[100], Boot Barn[100], Calavo Growers[100], NBT Bancorp[100], Peoples Bancorp[100], Riot Blockchain[100], Piedmont Office[100]
Best Smallcap Stocks Year-to-Date:
Janux [365.24%], Viking [258.89%], Longboard [219.64%], Super Micro[175.13%], Vera [163.02%], Hippo [129.8%], MicroStrategy [115.12%], Sana [99.88%], SoundHound AI[97.2%], Verde Clean[97%], Dyne [96.24%] Best Smallcap Stocks This Week:
Matterport [164.08%], Riot Blockchain[28.59%], ProKidney [25.74%], Cipher Mining[23.83%], Seres [21.4%], Hibbett Sports[21.34%], SoundHound AI[18.87%], BigBear.ai [18.62%], Marathon Patent[15.94%], MicroStrategy [15.73%], Heron [15.72%] Best Smallcap Stocks Daily:
Hibbett Sports[19.08%], Marathon Patent[18.12%], Heron [17.95%], SES AI[16.52%], SoundHound AI[11.64%], FuelCell Energy[10.86%], BigBear.ai [10.26%], Summit [9.31%], HealthStream [9.25%], Super Micro[9.07%], Seres [8.82%]