
 Login Sign Up


| |||||
 |  | ||||

| 12Stocks.com Market Intelligence |
Best SmallCap Stocks
|
| In a hurry? Small Cap Stock Lists: Performance Trends Table, Stock Charts
Sort Small Cap stocks: Daily, Weekly, Year-to-Date, Market Cap & Trends. Filter Small Cap stocks list by sector: Show all, Tech, Finance, Energy, Staples, Retail, Industrial, Materials, Utilities and HealthCare Filter Small Cap stocks list by size: All Large Medium Small and MicroCap |
| 12Stocks.com Small Cap Stocks Performances & Trends Daily | |||||||||
|
|  The overall Smart Investing & Trading Score is 23 (0-bearish to 100-bullish) which puts Small Cap index in short term bearish to neutral trend. The Smart Investing & Trading Score from previous trading session is 13 and hence an improvement of trend.
| ||||||||
Here are the Smart Investing & Trading Scores of the most requested small cap stocks at 12Stocks.com (click stock name for detailed review):
|


| 12Stocks.com: Investing in Smallcap Index with Stocks | |
|
The following table helps investors and traders sort through current performance and trends (as measured by Smart Investing & Trading Score) of various
stocks in the Smallcap Index. Quick View: Move mouse or cursor over stock symbol (ticker) to view short-term technical chart and over stock name to view long term chart. Click on  to add stock symbol to your watchlist and to add stock symbol to your watchlist and  to view watchlist. Click on any ticker or stock name for detailed market intelligence report for that stock. to view watchlist. Click on any ticker or stock name for detailed market intelligence report for that stock. |
12Stocks.com Performance of Stocks in Smallcap Index
| Ticker | Stock Name | Watchlist | Category | Recent Price | Smart Investing & Trading Score | Change % | YTD Change% |
| CLFD | Clearfield |   | Technology | 28.32 | 36 | 0.23% | -2.63% |
| ANNX | Annexon | | Health Care | 4.43 | 33 | -3.17% | -2.74% |
| BKH | Black Hills | | Utilities | 52.46 | 48 | 1.41% | -2.76% |
| GOLF | Acushnet | | Services & Goods | 61.42 | 32 | -0.11% | -2.77% |
| ACLX | Arcellx | | Health Care | 54.24 | 17 | 1.35% | -2.80% |
| NTGR | NETGEAR | | Technology | 14.16 | 28 | 1.43% | -2.88% |
| JELD | JELD-WEN Holding | | Industrials | 18.33 | 10 | 1.66% | -2.91% |
| CASS | Cass Information | | Services & Goods | 43.73 | 26 | -2.24% | -2.93% |
| VPG | Vishay Precision | | Technology | 33.07 | 46 | 0.88% | -2.94% |
| AMWD | American Woodmark | | Consumer Staples | 90.11 | 23 | -1.40% | -2.95% |
| CPK | Chesapeake Utilities | | Utilities | 102.51 | 55 | 1.75% | -2.95% |
| EPM | Evolution | | Energy | 5.63 | 46 | 0.36% | -3.10% |
| OTTR | Otter Tail | | Utilities | 82.26 | 8 | 0.16% | -3.19% |
| PRDO | Perdoceo Education | | Services & Goods | 17.00 | 18 | 0.98% | -3.19% |
| TRNS | Transcat | | Technology | 105.82 | 0 | 1.06% | -3.21% |
| HROW | Harrow Health | | Health Care | 10.84 | 36 | -8.29% | -3.21% |
| SKT | Tanger Factory | | Financials | 26.82 | 38 | 1.28% | -3.25% |
| IMXI | Money | | Services & Goods | 21.37 | 46 | 0.28% | -3.26% |
| HLNE | Hamilton Lane | | Financials | 109.72 | 20 | -0.47% | -3.27% |
| KBH | KB Home | | Industrials | 60.41 | 43 | -0.84% | -3.28% |
| WISH | ContextLogic | | Services & Goods | 5.75 | 63 | 15.81% | -3.28% |
| MYGN | Myriad Genetics | | Services & Goods | 18.51 | 10 | -0.70% | -3.29% |
| IBOC | Bancshares | | Financials | 52.53 | 48 | 0.67% | -3.30% |
| OFIX | Orthofix Medical | | Health Care | 13.03 | 28 | 0.23% | -3.34% |
| CAKE | Cheesecake Factory | | Services & Goods | 33.83 | 42 | 1.05% | -3.37% |


| Too many stocks? View smallcap stocks filtered by marketcap & sector |
| Marketcap: All SmallCap Stocks (default-no microcap), Large, Mid-Range, Small |
| Smallcap Sector: Tech, Finance, Energy, Staples, Retail, Industrial, Materials, & Medical |
|
Get the most comprehensive stock market coverage daily at 12Stocks.com ➞ Best Stocks Today ➞ Best Stocks Weekly ➞ Best Stocks Year-to-Date ➞ Best Stocks Trends ➞  Best Stocks Today 12Stocks.com Best Nasdaq Stocks ➞ Best S&P 500 Stocks ➞ Best Tech Stocks ➞ Best Biotech Stocks ➞ |
| Detailed Overview of SmallCap Stocks |
| SmallCap Technical Overview, Leaders & Laggards, Top SmallCap ETF Funds & Detailed SmallCap Stocks List, Charts, Trends & More |
| Smallcap: Technical Analysis, Trends & YTD Performance | |
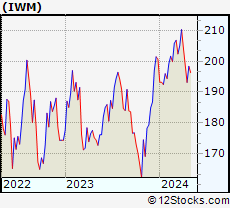
| SmallCap segment as represented by
IWM, an exchange-traded fund [ETF], holds basket of thousands of smallcap stocks from across all major sectors of the US stock market. The smallcap index (contains stocks like Riverbed & Sotheby's) is down by -3.92% and is currently underperforming the overall market by -8.11% year-to-date. Below is a quick view of technical charts and trends: | |
 IWM Weekly Chart |
|
| Long Term Trend: Not Good | |
| Medium Term Trend: Not Good | |
 IWM Daily Chart |
|
| Short Term Trend: Not Good | |
| Overall Trend Score: 23 | |
| YTD Performance: -3.92% | |
| **Trend Scores & Views Are Only For Educational Purposes And Not For Investing | |
| 12Stocks.com: Top Performing Small Cap Index Stocks | ||||||||||||||||||||||||||||||||||||||||||||||||
 The top performing Small Cap Index stocks year to date are
Now, more recently, over last week, the top performing Small Cap Index stocks on the move are


|
||||||||||||||||||||||||||||||||||||||||||||||||
| 12Stocks.com: Investing in Smallcap Index using Exchange Traded Funds | |
|
The following table shows list of key exchange traded funds (ETF) that
help investors track Smallcap index. The following list also includes leveraged ETF funds that track twice or thrice the daily returns of Smallcap indices. Short or inverse ETF funds move in the opposite direction to the index they track and are useful during market pullbacks or during bear markets. Quick View: Move mouse or cursor over ETF symbol (ticker) to view short-term technical chart and over ETF name to view long term chart. Click on ticker or stock name for detailed view. Click on to add stock symbol to your watchlist and to view watchlist. |
12Stocks.com List of ETFs that track Smallcap Index
| Ticker | ETF Name | Watchlist | Recent Price | Smart Investing & Trading Score | Change % | Week % | Year-to-date % |
| IWM | iShares Russell 2000 | | 192.84 | 23 | -0.08 | -2.94 | -3.92% |
| IJR | iShares Core S&P Small-Cap | | 102.34 | 31 | 0.21 | -2.08 | -5.46% |
| VTWO | Vanguard Russell 2000 ETF | | 77.94 | 23 | -0.14 | -2.96 | -3.9% |
| IWN | iShares Russell 2000 Value | | 146.33 | 10 | 0.21 | -2.69 | -5.79% |
| IJS | iShares S&P Small-Cap 600 Value | | 94.51 | 10 | 0.41 | -1.73 | -8.31% |
| IWO | iShares Russell 2000 Growth | | 246.94 | 36 | -0.44 | -3.3 | -2.09% |
| IJT | iShares S&P Small-Cap 600 Growth | | 121.59 | 23 | -0.21 | -2.56 | -2.84% |
| XSLV | PowerShares S&P SmallCap Low Volatil ETF | | 41.65 | 25 | 0.56 | -1.05 | -5.66% |
| SAA | ProShares Ultra SmallCap600 | | 21.62 | 10 | -0.18 | -4.17 | -13.35% |
| SMLV | SPDR SSGA US Small Cap Low Volatil ETF | | 103.83 | 18 | 0.16 | -1.13 | -7.72% |
| SBB | ProShares Short SmallCap600 | | 16.77 | 80 | -0.50 | 1.32 | 5.24% |
| SDD | ProShares UltraShort SmallCap600 | | 20.16 | 73 | -2.14 | 1.66 | 9.41% |
| 12Stocks.com: Charts, Trends, Fundamental Data and Performances of SmallCap Stocks | |
|
We now take in-depth look at all SmallCap stocks including charts, multi-period performances and overall trends (as measured by Smart Investing & Trading Score). One can sort SmallCap stocks (click link to choose) by Daily, Weekly and by Year-to-Date performances. Also, one can sort by size of the company or by market capitalization. |
| Select Your Default Chart Type: | |||||
| |||||
| Click on stock symbol or name for detailed view. Click on to add stock symbol to your watchlist and to view watchlist. Quick View: Move mouse or cursor over "Daily" to quickly view daily technical stock chart and over "Weekly" to view weekly technical stock chart. | |||||

 | CLFD Clearfield, Inc. |
| Sector: Technology | |
| SubSector: Communication Equipment | |
| MarketCap: 138.439 Millions | |
| Recent Price: 28.32 Smart Investing & Trading Score: 36 | |
| Day Percent Change: 0.23% Day Change: 0.07 | |
| Week Change: -6.27% Year-to-date Change: -2.6% | |
| CLFD Links: Profile News Message Board | |
| Charts:- Daily , Weekly | |
| Add CLFD to Watchlist: View: Get Complete CLFD Trend Analysis ➞ | |
 | ANNX Annexon, Inc. |
| Sector: Health Care | |
| SubSector: Biotechnology | |
| MarketCap: 94487 Millions | |
| Recent Price: 4.43 Smart Investing & Trading Score: 33 | |
| Day Percent Change: -3.17% Day Change: -0.15 | |
| Week Change: -25.84% Year-to-date Change: -2.7% | |
| ANNX Links: Profile News Message Board | |
| Charts:- Daily , Weekly | |
| Add ANNX to Watchlist: View: Get Complete ANNX Trend Analysis ➞ | |
 | BKH Black Hills Corporation |
| Sector: Utilities | |
| SubSector: Electric Utilities | |
| MarketCap: 3666.94 Millions | |
| Recent Price: 52.46 Smart Investing & Trading Score: 48 | |
| Day Percent Change: 1.41% Day Change: 0.73 | |
| Week Change: 0.42% Year-to-date Change: -2.8% | |
| BKH Links: Profile News Message Board | |
| Charts:- Daily , Weekly | |
| Add BKH to Watchlist: View: Get Complete BKH Trend Analysis ➞ | |
 | GOLF Acushnet Holdings Corp. |
| Sector: Services & Goods | |
| SubSector: Sporting Goods Stores | |
| MarketCap: 1717.74 Millions | |
| Recent Price: 61.42 Smart Investing & Trading Score: 32 | |
| Day Percent Change: -0.11% Day Change: -0.07 | |
| Week Change: -0.87% Year-to-date Change: -2.8% | |
| GOLF Links: Profile News Message Board | |
| Charts:- Daily , Weekly | |
| Add GOLF to Watchlist: View: Get Complete GOLF Trend Analysis ➞ | |
 | ACLX Arcellx, Inc. |
| Sector: Health Care | |
| SubSector: Biotechnology | |
| MarketCap: 1530 Millions | |
| Recent Price: 54.24 Smart Investing & Trading Score: 17 | |
| Day Percent Change: 1.35% Day Change: 0.72 | |
| Week Change: -6.6% Year-to-date Change: -2.8% | |
| ACLX Links: Profile News Message Board | |
| Charts:- Daily , Weekly | |
| Add ACLX to Watchlist: View: Get Complete ACLX Trend Analysis ➞ | |
 | NTGR NETGEAR, Inc. |
| Sector: Technology | |
| SubSector: Communication Equipment | |
| MarketCap: 558.839 Millions | |
| Recent Price: 14.16 Smart Investing & Trading Score: 28 | |
| Day Percent Change: 1.43% Day Change: 0.20 | |
| Week Change: -3.54% Year-to-date Change: -2.9% | |
| NTGR Links: Profile News Message Board | |
| Charts:- Daily , Weekly | |
| Add NTGR to Watchlist: View: Get Complete NTGR Trend Analysis ➞ | |
 | JELD JELD-WEN Holding, Inc. |
| Sector: Industrials | |
| SubSector: General Building Materials | |
| MarketCap: 1022.53 Millions | |
| Recent Price: 18.33 Smart Investing & Trading Score: 10 | |
| Day Percent Change: 1.66% Day Change: 0.30 | |
| Week Change: -5.37% Year-to-date Change: -2.9% | |
| JELD Links: Profile News Message Board | |
| Charts:- Daily , Weekly | |
| Add JELD to Watchlist: View: Get Complete JELD Trend Analysis ➞ | |
 | CASS Cass Information Systems, Inc. |
| Sector: Services & Goods | |
| SubSector: Business Services | |
| MarketCap: 477.382 Millions | |
| Recent Price: 43.73 Smart Investing & Trading Score: 26 | |
| Day Percent Change: -2.24% Day Change: -1.00 | |
| Week Change: -3.76% Year-to-date Change: -2.9% | |
| CASS Links: Profile News Message Board | |
| Charts:- Daily , Weekly | |
| Add CASS to Watchlist: View: Get Complete CASS Trend Analysis ➞ | |
 | VPG Vishay Precision Group, Inc. |
| Sector: Technology | |
| SubSector: Scientific & Technical Instruments | |
| MarketCap: 261.553 Millions | |
| Recent Price: 33.07 Smart Investing & Trading Score: 46 | |
| Day Percent Change: 0.88% Day Change: 0.29 | |
| Week Change: 0.15% Year-to-date Change: -2.9% | |
| VPG Links: Profile News Message Board | |
| Charts:- Daily , Weekly | |
| Add VPG to Watchlist: View: Get Complete VPG Trend Analysis ➞ | |
 | AMWD American Woodmark Corporation |
| Sector: Consumer Staples | |
| SubSector: Home Furnishings & Fixtures | |
| MarketCap: 958.435 Millions | |
| Recent Price: 90.11 Smart Investing & Trading Score: 23 | |
| Day Percent Change: -1.40% Day Change: -1.28 | |
| Week Change: -6.15% Year-to-date Change: -3.0% | |
| AMWD Links: Profile News Message Board | |
| Charts:- Daily , Weekly | |
| Add AMWD to Watchlist: View: Get Complete AMWD Trend Analysis ➞ | |
 | CPK Chesapeake Utilities Corporation |
| Sector: Utilities | |
| SubSector: Gas Utilities | |
| MarketCap: 1465.77 Millions | |
| Recent Price: 102.51 Smart Investing & Trading Score: 55 | |
| Day Percent Change: 1.75% Day Change: 1.76 | |
| Week Change: 0.44% Year-to-date Change: -3.0% | |
| CPK Links: Profile News Message Board | |
| Charts:- Daily , Weekly | |
| Add CPK to Watchlist: View: Get Complete CPK Trend Analysis ➞ | |
 | EPM Evolution Petroleum Corporation |
| Sector: Energy | |
| SubSector: Independent Oil & Gas | |
| MarketCap: 98.0593 Millions | |
| Recent Price: 5.63 Smart Investing & Trading Score: 46 | |
| Day Percent Change: 0.36% Day Change: 0.02 | |
| Week Change: -2.26% Year-to-date Change: -3.1% | |
| EPM Links: Profile News Message Board | |
| Charts:- Daily , Weekly | |
| Add EPM to Watchlist: View: Get Complete EPM Trend Analysis ➞ | |
 | OTTR Otter Tail Corporation |
| Sector: Utilities | |
| SubSector: Diversified Utilities | |
| MarketCap: 1728.2 Millions | |
| Recent Price: 82.26 Smart Investing & Trading Score: 8 | |
| Day Percent Change: 0.16% Day Change: 0.13 | |
| Week Change: -0.9% Year-to-date Change: -3.2% | |
| OTTR Links: Profile News Message Board | |
| Charts:- Daily , Weekly | |
| Add OTTR to Watchlist: View: Get Complete OTTR Trend Analysis ➞ | |
 | PRDO Perdoceo Education Corporation |
| Sector: Services & Goods | |
| SubSector: Education & Training Services | |
| MarketCap: 631.006 Millions | |
| Recent Price: 17.00 Smart Investing & Trading Score: 18 | |
| Day Percent Change: 0.98% Day Change: 0.16 | |
| Week Change: -0.64% Year-to-date Change: -3.2% | |
| PRDO Links: Profile News Message Board | |
| Charts:- Daily , Weekly | |
| Add PRDO to Watchlist: View: Get Complete PRDO Trend Analysis ➞ | |
 | TRNS Transcat, Inc. |
| Sector: Technology | |
| SubSector: Scientific & Technical Instruments | |
| MarketCap: 216.653 Millions | |
| Recent Price: 105.82 Smart Investing & Trading Score: 0 | |
| Day Percent Change: 1.06% Day Change: 1.11 | |
| Week Change: -4.05% Year-to-date Change: -3.2% | |
| TRNS Links: Profile News Message Board | |
| Charts:- Daily , Weekly | |
| Add TRNS to Watchlist: View: Get Complete TRNS Trend Analysis ➞ | |
 | HROW Harrow Health, Inc. |
| Sector: Health Care | |
| SubSector: Drug Manufacturers - Other | |
| MarketCap: 104.033 Millions | |
| Recent Price: 10.84 Smart Investing & Trading Score: 36 | |
| Day Percent Change: -8.29% Day Change: -0.98 | |
| Week Change: -14.31% Year-to-date Change: -3.2% | |
| HROW Links: Profile News Message Board | |
| Charts:- Daily , Weekly | |
| Add HROW to Watchlist: View: Get Complete HROW Trend Analysis ➞ | |
 | SKT Tanger Factory Outlet Centers, Inc. |
| Sector: Financials | |
| SubSector: REIT - Retail | |
| MarketCap: 720.214 Millions | |
| Recent Price: 26.82 Smart Investing & Trading Score: 38 | |
| Day Percent Change: 1.28% Day Change: 0.34 | |
| Week Change: 0.22% Year-to-date Change: -3.3% | |
| SKT Links: Profile News Message Board | |
| Charts:- Daily , Weekly | |
| Add SKT to Watchlist: View: Get Complete SKT Trend Analysis ➞ | |
 | IMXI International Money Express, Inc. |
| Sector: Services & Goods | |
| SubSector: Business Services | |
| MarketCap: 326.582 Millions | |
| Recent Price: 21.37 Smart Investing & Trading Score: 46 | |
| Day Percent Change: 0.28% Day Change: 0.06 | |
| Week Change: -1.57% Year-to-date Change: -3.3% | |
| IMXI Links: Profile News Message Board | |
| Charts:- Daily , Weekly | |
| Add IMXI to Watchlist: View: Get Complete IMXI Trend Analysis ➞ | |
 | HLNE Hamilton Lane Incorporated |
| Sector: Financials | |
| SubSector: Asset Management | |
| MarketCap: 2484.13 Millions | |
| Recent Price: 109.72 Smart Investing & Trading Score: 20 | |
| Day Percent Change: -0.47% Day Change: -0.52 | |
| Week Change: -0.73% Year-to-date Change: -3.3% | |
| HLNE Links: Profile News Message Board | |
| Charts:- Daily , Weekly | |
| Add HLNE to Watchlist: View: Get Complete HLNE Trend Analysis ➞ | |
 | KBH KB Home |
| Sector: Industrials | |
| SubSector: Residential Construction | |
| MarketCap: 1249.66 Millions | |
| Recent Price: 60.41 Smart Investing & Trading Score: 43 | |
| Day Percent Change: -0.84% Day Change: -0.51 | |
| Week Change: -5.76% Year-to-date Change: -3.3% | |
| KBH Links: Profile News Message Board | |
| Charts:- Daily , Weekly | |
| Add KBH to Watchlist: View: Get Complete KBH Trend Analysis ➞ | |
 | WISH ContextLogic Inc. |
| Sector: Services & Goods | |
| SubSector: Internet Retail | |
| MarketCap: 165 Millions | |
| Recent Price: 5.75 Smart Investing & Trading Score: 63 | |
| Day Percent Change: 15.81% Day Change: 0.79 | |
| Week Change: 15% Year-to-date Change: -3.3% | |
| WISH Links: Profile News Message Board | |
| Charts:- Daily , Weekly | |
| Add WISH to Watchlist: View: Get Complete WISH Trend Analysis ➞ | |
 | MYGN Myriad Genetics, Inc. |
| Sector: Services & Goods | |
| SubSector: Research Services | |
| MarketCap: 1051.94 Millions | |
| Recent Price: 18.51 Smart Investing & Trading Score: 10 | |
| Day Percent Change: -0.70% Day Change: -0.13 | |
| Week Change: -5.32% Year-to-date Change: -3.3% | |
| MYGN Links: Profile News Message Board | |
| Charts:- Daily , Weekly | |
| Add MYGN to Watchlist: View: Get Complete MYGN Trend Analysis ➞ | |
 | IBOC International Bancshares Corporation |
| Sector: Financials | |
| SubSector: Regional - Southwest Banks | |
| MarketCap: 1159.45 Millions | |
| Recent Price: 52.53 Smart Investing & Trading Score: 48 | |
| Day Percent Change: 0.67% Day Change: 0.35 | |
| Week Change: 0.1% Year-to-date Change: -3.3% | |
| IBOC Links: Profile News Message Board | |
| Charts:- Daily , Weekly | |
| Add IBOC to Watchlist: View: Get Complete IBOC Trend Analysis ➞ | |
 | OFIX Orthofix Medical Inc. |
| Sector: Health Care | |
| SubSector: Medical Appliances & Equipment | |
| MarketCap: 508.18 Millions | |
| Recent Price: 13.03 Smart Investing & Trading Score: 28 | |
| Day Percent Change: 0.23% Day Change: 0.03 | |
| Week Change: -2.18% Year-to-date Change: -3.3% | |
| OFIX Links: Profile News Message Board | |
| Charts:- Daily , Weekly | |
| Add OFIX to Watchlist: View: Get Complete OFIX Trend Analysis ➞ | |
 | CAKE The Cheesecake Factory Incorporated |
| Sector: Services & Goods | |
| SubSector: Restaurants | |
| MarketCap: 829 Millions | |
| Recent Price: 33.83 Smart Investing & Trading Score: 42 | |
| Day Percent Change: 1.05% Day Change: 0.35 | |
| Week Change: 1.14% Year-to-date Change: -3.4% | |
| CAKE Links: Profile News Message Board | |
| Charts:- Daily , Weekly | |
| Add CAKE to Watchlist: View: Get Complete CAKE Trend Analysis ➞ | |
| Too many stocks? View smallcap stocks filtered by marketcap & sector |
| Marketcap: All SmallCap Stocks (default-no microcap), Large, Mid-Range, Small & MicroCap |
| Sector: Tech, Finance, Energy, Staples, Retail, Industrial, Materials, Utilities & Medical |
|
Best Stocks Today 12Stocks.com |
© 2024 12Stocks.com Terms & Conditions Privacy Contact Us
All Information Provided Only For Education And Not To Be Used For Investing or Trading. See Terms & Conditions


One More Thing ... Get Best Stocks Delivered Daily!
Never Ever Miss A Move With Our Top Ten Stocks Lists
Find Best Stocks In Any Market - Bull or Bear Market
Take A Peek At Our Top Ten Stocks Lists: Daily, Weekly, Year-to-Date & Top Trends
Find Best Stocks In Any Market - Bull or Bear Market
Take A Peek At Our Top Ten Stocks Lists: Daily, Weekly, Year-to-Date & Top Trends
Smallcap Stocks With Best Up Trends [0-bearish to 100-bullish]: Badger Meter[100], Cullinan Oncology[100], Oscar Health[100], NextNav [100], Richardson Electronics[100], Seneca Foods[100], Lantheus [100], Macatawa Bank[100], Geron [100], IMAX [100], Regional Management[100]
Best Smallcap Stocks Year-to-Date:
Agenus [500.31%], CareMax [417.53%], Janux [348.12%], Viking [248.9%], Alpine Immune[238.5%], Super Micro[226.74%], Longboard [194.76%], Arcutis Bio[192.57%], Vera [161.3%], Avidity Biosciences[154.87%], Hippo [128.32%] Best Smallcap Stocks This Week:
Macatawa Bank[44.53%], 23andMe Holding[33.3%], ProKidney [32%], Snap One[29.73%], Vertex Energy[23.08%], ALX Oncology[20.64%], Vanda [20.63%], Expensify [18.37%], Badger Meter[16.72%], ContextLogic [15%], Cullinan Oncology[13.89%] Best Smallcap Stocks Daily:
23andMe Holding[65.91%], Vertex Energy[30.72%], Zura Bio[17.20%], Badger Meter[16.65%], ContextLogic [15.81%], Expensify [15.23%], Montrose Environmental[12.84%], Vaxxinity [10.05%], Vuzix [9.87%], Cipher Mining[8.65%], FiscalNote [8.61%]