
 Login Sign Up


| |||||
 |  | ||||

| 12Stocks.com Market Intelligence |
Best SmallCap Stocks
|
| In a hurry? Small Cap Stock Lists: Performance Trends Table, Stock Charts
Sort Small Cap stocks: Daily, Weekly, Year-to-Date, Market Cap & Trends. Filter Small Cap stocks list by sector: Show all, Tech, Finance, Energy, Staples, Retail, Industrial, Materials, Utilities and HealthCare Filter Small Cap stocks list by size: All Large Medium Small and MicroCap |
| 12Stocks.com Small Cap Stocks Performances & Trends Daily | |||||||||
|
|  The overall Smart Investing & Trading Score is 63 (0-bearish to 100-bullish) which puts Small Cap index in short term neutral to bullish trend. The Smart Investing & Trading Score from previous trading session is 58 and hence an improvement of trend.
| ||||||||
Here are the Smart Investing & Trading Scores of the most requested small cap stocks at 12Stocks.com (click stock name for detailed review):
|


| 12Stocks.com: Investing in Smallcap Index with Stocks | |
|
The following table helps investors and traders sort through current performance and trends (as measured by Smart Investing & Trading Score) of various
stocks in the Smallcap Index. Quick View: Move mouse or cursor over stock symbol (ticker) to view short-term technical chart and over stock name to view long term chart. Click on  to add stock symbol to your watchlist and to add stock symbol to your watchlist and  to view watchlist. Click on any ticker or stock name for detailed market intelligence report for that stock. to view watchlist. Click on any ticker or stock name for detailed market intelligence report for that stock. |
12Stocks.com Performance of Stocks in Smallcap Index
| Ticker | Stock Name | Watchlist | Category | Recent Price | Smart Investing & Trading Score | Change % | YTD Change% |
| JAMF | Jamf Holding |   | Technology | 19.27 | 100 | 0.63% | 6.64% |
| BBSI | Barrett Business | | Services & Goods | 123.47 | 78 | 0.54% | 6.62% |
| HRT | HireRight | | Industrials | 14.34 | 75 | 0.46% | 6.62% |
| TPB | Turning Point | | Consumer Staples | 28.06 | 90 | 1.96% | 6.61% |
| BOX | Box | | Technology | 27.30 | 75 | 0.66% | 6.60% |
| CYRX | Cryoport | | Consumer Staples | 16.51 | 61 | 2.80% | 6.58% |
| KFY | Korn Ferry | | Services & Goods | 63.19 | 83 | 0.38% | 6.47% |
| CMCO | Columbus McKinnon | | Industrials | 41.53 | 63 | 1.57% | 6.43% |
| MTSI | MACOM | | Technology | 98.86 | 68 | 3.43% | 6.35% |
| LIVN | LivaNova | | Health Care | 55.01 | 68 | 1.85% | 6.32% |
| TEX | Terex | | Industrials | 61.00 | 50 | 0.44% | 6.16% |
| SPNS | Sapiens | | Technology | 30.72 | 63 | 0.85% | 6.15% |
| VRRM | Verra Mobility | | Services & Goods | 24.43 | 30 | 2.30% | 6.08% |
| HAYN | Haynes | | Industrials | 60.48 | 68 | 0.68% | 6.01% |
| SXT | Sensient | | Materials | 69.89 | 95 | 1.33% | 5.89% |
| LXRX | Lexicon | | Health Care | 1.62 | 35 | -5.26% | 5.88% |
| ICFI | ICF | | Services & Goods | 141.88 | 58 | 1.45% | 5.81% |
| ENSG | Ensign Group | | Health Care | 118.61 | 65 | 1.18% | 5.70% |
| BASE | Couchbase | | Technology | 24.09 | 17 | 4.51% | 5.70% |
| BGS | B&G Foods | | Consumer Staples | 11.07 | 83 | 2.88% | 5.43% |
| GCBC | Greene County | | Financials | 29.72 | 100 | 2.10% | 5.39% |
| HALO | Halozyme | | Health Care | 38.94 | 75 | 0.59% | 5.36% |
| PFBC | Preferred Bank | | Financials | 76.93 | 100 | 2.79% | 5.31% |
| UEC | Uranium Energy | | Materials | 6.74 | 10 | 1.20% | 5.31% |
| ODC | Oil-Dri | | Materials | 70.59 | 66 | 1.42% | 5.23% |


| Too many stocks? View smallcap stocks filtered by marketcap & sector |
| Marketcap: All SmallCap Stocks (default-no microcap), Large, Mid-Range, Small |
| Smallcap Sector: Tech, Finance, Energy, Staples, Retail, Industrial, Materials, & Medical |
|
Get the most comprehensive stock market coverage daily at 12Stocks.com ➞ Best Stocks Today ➞ Best Stocks Weekly ➞ Best Stocks Year-to-Date ➞ Best Stocks Trends ➞  Best Stocks Today 12Stocks.com Best Nasdaq Stocks ➞ Best S&P 500 Stocks ➞ Best Tech Stocks ➞ Best Biotech Stocks ➞ |
| Detailed Overview of SmallCap Stocks |
| SmallCap Technical Overview, Leaders & Laggards, Top SmallCap ETF Funds & Detailed SmallCap Stocks List, Charts, Trends & More |
| Smallcap: Technical Analysis, Trends & YTD Performance | |
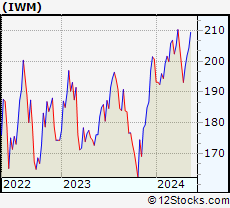
| SmallCap segment as represented by
IWM, an exchange-traded fund [ETF], holds basket of thousands of smallcap stocks from across all major sectors of the US stock market. The smallcap index (contains stocks like Riverbed & Sotheby's) is down by -1.07% and is currently underperforming the overall market by -6.71% year-to-date. Below is a quick view of technical charts and trends: | |
 IWM Weekly Chart |
|
| Long Term Trend: Good | |
| Medium Term Trend: Not Good | |
 IWM Daily Chart |
|
| Short Term Trend: Very Good | |
| Overall Trend Score: 63 | |
| YTD Performance: -1.07% | |
| **Trend Scores & Views Are Only For Educational Purposes And Not For Investing | |
| 12Stocks.com: Top Performing Small Cap Index Stocks | ||||||||||||||||||||||||||||||||||||||||||||||||
 The top performing Small Cap Index stocks year to date are
Now, more recently, over last week, the top performing Small Cap Index stocks on the move are


|
||||||||||||||||||||||||||||||||||||||||||||||||
| 12Stocks.com: Investing in Smallcap Index using Exchange Traded Funds | |
|
The following table shows list of key exchange traded funds (ETF) that
help investors track Smallcap index. The following list also includes leveraged ETF funds that track twice or thrice the daily returns of Smallcap indices. Short or inverse ETF funds move in the opposite direction to the index they track and are useful during market pullbacks or during bear markets. Quick View: Move mouse or cursor over ETF symbol (ticker) to view short-term technical chart and over ETF name to view long term chart. Click on ticker or stock name for detailed view. Click on to add stock symbol to your watchlist and to view watchlist. |
12Stocks.com List of ETFs that track Smallcap Index
| Ticker | ETF Name | Watchlist | Recent Price | Smart Investing & Trading Score | Change % | Week % | Year-to-date % |
| IWM | iShares Russell 2000 | | 198.57 | 63 | 1.67 | 2.81 | -1.07% |
| VTWO | Vanguard Russell 2000 ETF | | 80.53 | 70 | 2.04 | 3.14 | -0.7% |
| IJR | iShares Core S&P Small-Cap | | 105.44 | 75 | 1.91 | 2.16 | -2.59% |
| IJS | iShares S&P Small-Cap 600 Value | | 98.50 | 67 | 2.15 | 3.02 | -4.43% |
| IWN | iShares Russell 2000 Value | | 151.50 | 68 | 1.33 | 2.52 | -2.47% |
| IJT | iShares S&P Small-Cap 600 Growth | | 125.91 | 70 | 2.07 | 3.03 | 0.62% |
| IWO | iShares Russell 2000 Growth | | 252.16 | 58 | 1.71 | 2.8 | -0.02% |
| XSLV | PowerShares S&P SmallCap Low Volatil ETF | | 43.09 | 80 | 1.53 | 2.16 | -2.4% |
| SMLV | SPDR SSGA US Small Cap Low Volatil ETF | | 108.46 | 72 | 0.91 | 2.23 | -3.61% |
| SAA | ProShares Ultra SmallCap600 | | 23.15 | 24 | 3.49 | 6.19 | -7.21% |
| SBB | ProShares Short SmallCap600 | | 16.28 | 40 | -2.05 | -3.33 | 2.2% |
| SDD | ProShares UltraShort SmallCap600 | | 19.31 | 40 | -2.23 | -5.06 | 4.79% |
| 12Stocks.com: Charts, Trends, Fundamental Data and Performances of SmallCap Stocks | |
|
We now take in-depth look at all SmallCap stocks including charts, multi-period performances and overall trends (as measured by Smart Investing & Trading Score). One can sort SmallCap stocks (click link to choose) by Daily, Weekly and by Year-to-Date performances. Also, one can sort by size of the company or by market capitalization. |
| Select Your Default Chart Type: | |||||
| |||||
| Click on stock symbol or name for detailed view. Click on to add stock symbol to your watchlist and to view watchlist. Quick View: Move mouse or cursor over "Daily" to quickly view daily technical stock chart and over "Weekly" to view weekly technical stock chart. | |||||

 | JAMF Jamf Holding Corp. |
| Sector: Technology | |
| SubSector: Software Application | |
| MarketCap: 36987 Millions | |
| Recent Price: 19.27 Smart Investing & Trading Score: 100 | |
| Day Percent Change: 0.63% Day Change: 0.12 | |
| Week Change: 3.83% Year-to-date Change: 6.6% | |
| JAMF Links: Profile News Message Board | |
| Charts:- Daily , Weekly | |
| Add JAMF to Watchlist: View: Get Complete JAMF Trend Analysis ➞ | |
 | BBSI Barrett Business Services, Inc. |
| Sector: Services & Goods | |
| SubSector: Staffing & Outsourcing Services | |
| MarketCap: 262.028 Millions | |
| Recent Price: 123.47 Smart Investing & Trading Score: 78 | |
| Day Percent Change: 0.54% Day Change: 0.66 | |
| Week Change: 0.92% Year-to-date Change: 6.6% | |
| BBSI Links: Profile News Message Board | |
| Charts:- Daily , Weekly | |
| Add BBSI to Watchlist: View: Get Complete BBSI Trend Analysis ➞ | |
 | HRT HireRight Holdings Corporation |
| Sector: Industrials | |
| SubSector: Staffing & Employment Services | |
| MarketCap: 823 Millions | |
| Recent Price: 14.34 Smart Investing & Trading Score: 75 | |
| Day Percent Change: 0.46% Day Change: 0.06 | |
| Week Change: 0.7% Year-to-date Change: 6.6% | |
| HRT Links: Profile News Message Board | |
| Charts:- Daily , Weekly | |
| Add HRT to Watchlist: View: Get Complete HRT Trend Analysis ➞ | |
 | TPB Turning Point Brands, Inc. |
| Sector: Consumer Staples | |
| SubSector: Tobacco Products, Other | |
| MarketCap: 381.97 Millions | |
| Recent Price: 28.06 Smart Investing & Trading Score: 90 | |
| Day Percent Change: 1.96% Day Change: 0.54 | |
| Week Change: 1.37% Year-to-date Change: 6.6% | |
| TPB Links: Profile News Message Board | |
| Charts:- Daily , Weekly | |
| Add TPB to Watchlist: View: Get Complete TPB Trend Analysis ➞ | |
 | BOX Box, Inc. |
| Sector: Technology | |
| SubSector: Application Software | |
| MarketCap: 2154.42 Millions | |
| Recent Price: 27.30 Smart Investing & Trading Score: 75 | |
| Day Percent Change: 0.66% Day Change: 0.18 | |
| Week Change: 2.36% Year-to-date Change: 6.6% | |
| BOX Links: Profile News Message Board | |
| Charts:- Daily , Weekly | |
| Add BOX to Watchlist: View: Get Complete BOX Trend Analysis ➞ | |
 | CYRX Cryoport, Inc. |
| Sector: Consumer Staples | |
| SubSector: Packaging & Containers | |
| MarketCap: 576.653 Millions | |
| Recent Price: 16.51 Smart Investing & Trading Score: 61 | |
| Day Percent Change: 2.80% Day Change: 0.45 | |
| Week Change: 2.36% Year-to-date Change: 6.6% | |
| CYRX Links: Profile News Message Board | |
| Charts:- Daily , Weekly | |
| Add CYRX to Watchlist: View: Get Complete CYRX Trend Analysis ➞ | |
 | KFY Korn Ferry |
| Sector: Services & Goods | |
| SubSector: Staffing & Outsourcing Services | |
| MarketCap: 1534.28 Millions | |
| Recent Price: 63.19 Smart Investing & Trading Score: 83 | |
| Day Percent Change: 0.38% Day Change: 0.24 | |
| Week Change: 3.1% Year-to-date Change: 6.5% | |
| KFY Links: Profile News Message Board | |
| Charts:- Daily , Weekly | |
| Add KFY to Watchlist: View: Get Complete KFY Trend Analysis ➞ | |
 | CMCO Columbus McKinnon Corporation |
| Sector: Industrials | |
| SubSector: Farm & Construction Machinery | |
| MarketCap: 598.807 Millions | |
| Recent Price: 41.53 Smart Investing & Trading Score: 63 | |
| Day Percent Change: 1.57% Day Change: 0.64 | |
| Week Change: 1.37% Year-to-date Change: 6.4% | |
| CMCO Links: Profile News Message Board | |
| Charts:- Daily , Weekly | |
| Add CMCO to Watchlist: View: Get Complete CMCO Trend Analysis ➞ | |
 | MTSI MACOM Technology Solutions Holdings, Inc. |
| Sector: Technology | |
| SubSector: Semiconductor - Broad Line | |
| MarketCap: 1214.42 Millions | |
| Recent Price: 98.86 Smart Investing & Trading Score: 68 | |
| Day Percent Change: 3.43% Day Change: 3.28 | |
| Week Change: 6.51% Year-to-date Change: 6.4% | |
| MTSI Links: Profile News Message Board | |
| Charts:- Daily , Weekly | |
| Add MTSI to Watchlist: View: Get Complete MTSI Trend Analysis ➞ | |
 | LIVN LivaNova PLC |
| Sector: Health Care | |
| SubSector: Medical Appliances & Equipment | |
| MarketCap: 2060.5 Millions | |
| Recent Price: 55.01 Smart Investing & Trading Score: 68 | |
| Day Percent Change: 1.85% Day Change: 1.00 | |
| Week Change: 5.16% Year-to-date Change: 6.3% | |
| LIVN Links: Profile News Message Board | |
| Charts:- Daily , Weekly | |
| Add LIVN to Watchlist: View: Get Complete LIVN Trend Analysis ➞ | |
 | TEX Terex Corporation |
| Sector: Industrials | |
| SubSector: Farm & Construction Machinery | |
| MarketCap: 1083.07 Millions | |
| Recent Price: 61.00 Smart Investing & Trading Score: 50 | |
| Day Percent Change: 0.44% Day Change: 0.27 | |
| Week Change: 1.24% Year-to-date Change: 6.2% | |
| TEX Links: Profile News Message Board | |
| Charts:- Daily , Weekly | |
| Add TEX to Watchlist: View: Get Complete TEX Trend Analysis ➞ | |
 | SPNS Sapiens International Corporation N.V. |
| Sector: Technology | |
| SubSector: Business Software & Services | |
| MarketCap: 841.858 Millions | |
| Recent Price: 30.72 Smart Investing & Trading Score: 63 | |
| Day Percent Change: 0.85% Day Change: 0.26 | |
| Week Change: 2.26% Year-to-date Change: 6.2% | |
| SPNS Links: Profile News Message Board | |
| Charts:- Daily , Weekly | |
| Add SPNS to Watchlist: View: Get Complete SPNS Trend Analysis ➞ | |
 | VRRM Verra Mobility Corporation |
| Sector: Services & Goods | |
| SubSector: Security & Protection Services | |
| MarketCap: 1265.03 Millions | |
| Recent Price: 24.43 Smart Investing & Trading Score: 30 | |
| Day Percent Change: 2.30% Day Change: 0.55 | |
| Week Change: 3.91% Year-to-date Change: 6.1% | |
| VRRM Links: Profile News Message Board | |
| Charts:- Daily , Weekly | |
| Add VRRM to Watchlist: View: Get Complete VRRM Trend Analysis ➞ | |
 | HAYN Haynes International, Inc. |
| Sector: Industrials | |
| SubSector: Metal Fabrication | |
| MarketCap: 245.75 Millions | |
| Recent Price: 60.48 Smart Investing & Trading Score: 68 | |
| Day Percent Change: 0.68% Day Change: 0.41 | |
| Week Change: 0.38% Year-to-date Change: 6.0% | |
| HAYN Links: Profile News Message Board | |
| Charts:- Daily , Weekly | |
| Add HAYN to Watchlist: View: Get Complete HAYN Trend Analysis ➞ | |
 | SXT Sensient Technologies Corporation |
| Sector: Materials | |
| SubSector: Specialty Chemicals | |
| MarketCap: 1961.37 Millions | |
| Recent Price: 69.89 Smart Investing & Trading Score: 95 | |
| Day Percent Change: 1.33% Day Change: 0.92 | |
| Week Change: 1.08% Year-to-date Change: 5.9% | |
| SXT Links: Profile News Message Board | |
| Charts:- Daily , Weekly | |
| Add SXT to Watchlist: View: Get Complete SXT Trend Analysis ➞ | |
 | LXRX Lexicon Pharmaceuticals, Inc. |
| Sector: Health Care | |
| SubSector: Biotechnology | |
| MarketCap: 251.185 Millions | |
| Recent Price: 1.62 Smart Investing & Trading Score: 35 | |
| Day Percent Change: -5.26% Day Change: -0.09 | |
| Week Change: -1.82% Year-to-date Change: 5.9% | |
| LXRX Links: Profile News Message Board | |
| Charts:- Daily , Weekly | |
| Add LXRX to Watchlist: View: Get Complete LXRX Trend Analysis ➞ | |
 | ICFI ICF International, Inc. |
| Sector: Services & Goods | |
| SubSector: Management Services | |
| MarketCap: 1218.75 Millions | |
| Recent Price: 141.88 Smart Investing & Trading Score: 58 | |
| Day Percent Change: 1.45% Day Change: 2.03 | |
| Week Change: 1.15% Year-to-date Change: 5.8% | |
| ICFI Links: Profile News Message Board | |
| Charts:- Daily , Weekly | |
| Add ICFI to Watchlist: View: Get Complete ICFI Trend Analysis ➞ | |
 | ENSG The Ensign Group, Inc. |
| Sector: Health Care | |
| SubSector: Long-Term Care Facilities | |
| MarketCap: 2053.76 Millions | |
| Recent Price: 118.61 Smart Investing & Trading Score: 65 | |
| Day Percent Change: 1.18% Day Change: 1.38 | |
| Week Change: 0.3% Year-to-date Change: 5.7% | |
| ENSG Links: Profile News Message Board | |
| Charts:- Daily , Weekly | |
| Add ENSG to Watchlist: View: Get Complete ENSG Trend Analysis ➞ | |
 | BASE Couchbase, Inc. |
| Sector: Technology | |
| SubSector: Software - Infrastructure | |
| MarketCap: 724 Millions | |
| Recent Price: 24.09 Smart Investing & Trading Score: 17 | |
| Day Percent Change: 4.51% Day Change: 1.04 | |
| Week Change: 5.2% Year-to-date Change: 5.7% | |
| BASE Links: Profile News Message Board | |
| Charts:- Daily , Weekly | |
| Add BASE to Watchlist: View: Get Complete BASE Trend Analysis ➞ | |
 | BGS B&G Foods, Inc. |
| Sector: Consumer Staples | |
| SubSector: Processed & Packaged Goods | |
| MarketCap: 1456.08 Millions | |
| Recent Price: 11.07 Smart Investing & Trading Score: 83 | |
| Day Percent Change: 2.88% Day Change: 0.31 | |
| Week Change: 3.17% Year-to-date Change: 5.4% | |
| BGS Links: Profile News Message Board | |
| Charts:- Daily , Weekly | |
| Add BGS to Watchlist: View: Get Complete BGS Trend Analysis ➞ | |
 | GCBC Greene County Bancorp, Inc. |
| Sector: Financials | |
| SubSector: Savings & Loans | |
| MarketCap: 314.83 Millions | |
| Recent Price: 29.72 Smart Investing & Trading Score: 100 | |
| Day Percent Change: 2.10% Day Change: 0.61 | |
| Week Change: 3.92% Year-to-date Change: 5.4% | |
| GCBC Links: Profile News Message Board | |
| Charts:- Daily , Weekly | |
| Add GCBC to Watchlist: View: Get Complete GCBC Trend Analysis ➞ | |
 | HALO Halozyme Therapeutics, Inc. |
| Sector: Health Care | |
| SubSector: Biotechnology | |
| MarketCap: 2383.75 Millions | |
| Recent Price: 38.94 Smart Investing & Trading Score: 75 | |
| Day Percent Change: 0.59% Day Change: 0.23 | |
| Week Change: 0.78% Year-to-date Change: 5.4% | |
| HALO Links: Profile News Message Board | |
| Charts:- Daily , Weekly | |
| Add HALO to Watchlist: View: Get Complete HALO Trend Analysis ➞ | |
 | PFBC Preferred Bank |
| Sector: Financials | |
| SubSector: Regional - Pacific Banks | |
| MarketCap: 559.629 Millions | |
| Recent Price: 76.93 Smart Investing & Trading Score: 100 | |
| Day Percent Change: 2.79% Day Change: 2.09 | |
| Week Change: 3.54% Year-to-date Change: 5.3% | |
| PFBC Links: Profile News Message Board | |
| Charts:- Daily , Weekly | |
| Add PFBC to Watchlist: View: Get Complete PFBC Trend Analysis ➞ | |
 | UEC Uranium Energy Corp. |
| Sector: Materials | |
| SubSector: Industrial Metals & Minerals | |
| MarketCap: 138.91 Millions | |
| Recent Price: 6.74 Smart Investing & Trading Score: 10 | |
| Day Percent Change: 1.20% Day Change: 0.08 | |
| Week Change: -0.74% Year-to-date Change: 5.3% | |
| UEC Links: Profile News Message Board | |
| Charts:- Daily , Weekly | |
| Add UEC to Watchlist: View: Get Complete UEC Trend Analysis ➞ | |
 | ODC Oil-Dri Corporation of America |
| Sector: Materials | |
| SubSector: Specialty Chemicals | |
| MarketCap: 249.857 Millions | |
| Recent Price: 70.59 Smart Investing & Trading Score: 66 | |
| Day Percent Change: 1.42% Day Change: 0.99 | |
| Week Change: 2.22% Year-to-date Change: 5.2% | |
| ODC Links: Profile News Message Board | |
| Charts:- Daily , Weekly | |
| Add ODC to Watchlist: View: Get Complete ODC Trend Analysis ➞ | |
| Too many stocks? View smallcap stocks filtered by marketcap & sector |
| Marketcap: All SmallCap Stocks (default-no microcap), Large, Mid-Range, Small & MicroCap |
| Sector: Tech, Finance, Energy, Staples, Retail, Industrial, Materials, Utilities & Medical |
|
Best Stocks Today 12Stocks.com |
© 2024 12Stocks.com Terms & Conditions Privacy Contact Us
All Information Provided Only For Education And Not To Be Used For Investing or Trading. See Terms & Conditions


One More Thing ... Get Best Stocks Delivered Daily!
Never Ever Miss A Move With Our Top Ten Stocks Lists
Find Best Stocks In Any Market - Bull or Bear Market
Take A Peek At Our Top Ten Stocks Lists: Daily, Weekly, Year-to-Date & Top Trends
Find Best Stocks In Any Market - Bull or Bear Market
Take A Peek At Our Top Ten Stocks Lists: Daily, Weekly, Year-to-Date & Top Trends
Smallcap Stocks With Best Up Trends [0-bearish to 100-bullish]: Hibbett Sports[100], AZZ [100], Day One[100], BioLife Solutions[100], Oscar Health[100], Mueller Industries[100], Gannett Co[100], Dillard s[100], Riot Blockchain[100], Agios [100], Brookdale Senior[100]
Best Smallcap Stocks Year-to-Date:
Janux [364.03%], Viking [258.89%], Alpine Immune[238.94%], Longboard [231.75%], Avidity Biosciences[177.88%], Arcutis Bio[170.43%], Super Micro[168.16%], Vera [154.91%], Hippo [134.14%], Y-mAbs [125.37%], Stoke [113.69%] Best Smallcap Stocks This Week:
Matterport [164.37%], Seres [36.26%], Riot Blockchain[29.74%], Cipher Mining[25%], ProKidney [24.75%], Braemar Hotels[21.3%], Akoustis [21.27%], Hibbett Sports[21.1%], Assertio [19.02%], Generation Bio[18.05%], BigBear.ai [17.93%] Best Smallcap Stocks Daily:
Virgin Galactic[22.38%], Seres [22.14%], Hibbett Sports[18.84%], Marathon Patent[18.12%], Generation Bio[16.37%], IGM Biosciences[14.52%], Braemar Hotels[12.96%], SES AI[12.17%], NuScale Power[11.16%], FuelCell Energy[10.86%], Cutera [10.82%]