
 Login Sign Up


| |||||
 |  | ||||

| 12Stocks.com Market Intelligence |
Best SmallCap Stocks
|
| In a hurry? Small Cap Stock Lists: Performance Trends Table, Stock Charts
Sort Small Cap stocks: Daily, Weekly, Year-to-Date, Market Cap & Trends. Filter Small Cap stocks list by sector: Show all, Tech, Finance, Energy, Staples, Retail, Industrial, Materials, Utilities and HealthCare Filter Small Cap stocks list by size: All Large Medium Small and MicroCap |
| 12Stocks.com Small Cap Stocks Performances & Trends Daily | |||||||||
|
|  The overall Smart Investing & Trading Score is 26 (0-bearish to 100-bullish) which puts Small Cap index in short term bearish to neutral trend. The Smart Investing & Trading Score from previous trading session is 31 and hence a deterioration of trend.
| ||||||||
Here are the Smart Investing & Trading Scores of the most requested small cap stocks at 12Stocks.com (click stock name for detailed review):
|


| 12Stocks.com: Investing in Smallcap Index with Stocks | |
|
The following table helps investors and traders sort through current performance and trends (as measured by Smart Investing & Trading Score) of various
stocks in the Smallcap Index. Quick View: Move mouse or cursor over stock symbol (ticker) to view short-term technical chart and over stock name to view long term chart. Click on  to add stock symbol to your watchlist and to add stock symbol to your watchlist and  to view watchlist. Click on any ticker or stock name for detailed market intelligence report for that stock. to view watchlist. Click on any ticker or stock name for detailed market intelligence report for that stock. |
12Stocks.com Performance of Stocks in Smallcap Index
| Ticker | Stock Name | Watchlist | Category | Recent Price | Smart Investing & Trading Score | Change % | YTD Change% |
| FFIC | Flushing Financial |   | Financials | 11.09 | 32 | -0.89% | -32.71% |
| EVEX | Eve Holding | | Industrials | 4.95 | 10 | -3.51% | -32.74% |
| ZURA | Zura Bio | | Health Care | 3.14 | 86 | -6.55% | -32.98% |
| GSAT | Globalstar | | Technology | 1.30 | 10 | -2.26% | -32.99% |
| NFBK | Northfield Bancorp | | Financials | 8.41 | 35 | 0.48% | -33.15% |
| FFWM | First Foundation | | Financials | 6.45 | 10 | -6.52% | -33.37% |
| UDMY | Udemy | | Consumer Staples | 9.89 | 10 | -1.20% | -33.53% |
| FIGS | FIGS | | Services & Goods | 4.73 | 15 | -4.25% | -33.66% |
| XAIR | Beyond Air | | Health Care | 1.30 | 10 | -9.72% | -33.67% |
| LIND | Lindblad Expeditions | | Consumer Staples | 7.47 | 0 | -4.23% | -33.72% |
| CHRS | Coherus BioSciences | | Health Care | 2.20 | 36 | -1.35% | -33.93% |
| KW | Kennedy-Wilson | | Financials | 8.18 | 20 | -2.04% | -33.93% |
| OSUR | OraSure | | Health Care | 5.41 | 10 | -1.99% | -34.02% |
| TCX | Tucows | | Technology | 17.80 | 47 | -1.17% | -34.07% |
| AMPH | Amphastar | | Health Care | 40.78 | 42 | 2.93% | -34.07% |
| MBUU | Malibu Boats | | Consumer Staples | 36.14 | 0 | -6.08% | -34.08% |
| FLNC | Fluence Energy | | Utilities | 15.73 | 10 | -6.37% | -34.24% |
| SHCR | Sharecare | | Health Care | 0.71 | 20 | -4.00% | -34.31% |
| CMBM | Cambium s | | Technology | 3.94 | 10 | -4.14% | -34.33% |
| IAS | Integral Ad | | Services & Goods | 9.54 | 10 | -3.34% | -34.34% |
| CTKB | Cytek Biosciences | | Health Care | 6.02 | 5 | -2.43% | -34.53% |
| SCLX | Scilex Holding | | Health Care | 1.28 | 10 | -3.76% | -34.69% |
| AAN | Aaron s | | Transports | 7.09 | 17 | -0.98% | -34.83% |
| FTCI | FTC Solar | | Technology | 0.45 | 10 | -7.24% | -34.86% |
| PKST | Peakstone Realty | | Financials | 13.36 | 10 | -2.98% | -34.89% |


| Too many stocks? View smallcap stocks filtered by marketcap & sector |
| Marketcap: All SmallCap Stocks (default-no microcap), Large, Mid-Range, Small |
| Smallcap Sector: Tech, Finance, Energy, Staples, Retail, Industrial, Materials, & Medical |
|
Get the most comprehensive stock market coverage daily at 12Stocks.com ➞ Best Stocks Today ➞ Best Stocks Weekly ➞ Best Stocks Year-to-Date ➞ Best Stocks Trends ➞  Best Stocks Today 12Stocks.com Best Nasdaq Stocks ➞ Best S&P 500 Stocks ➞ Best Tech Stocks ➞ Best Biotech Stocks ➞ |
| Detailed Overview of SmallCap Stocks |
| SmallCap Technical Overview, Leaders & Laggards, Top SmallCap ETF Funds & Detailed SmallCap Stocks List, Charts, Trends & More |
| Smallcap: Technical Analysis, Trends & YTD Performance | |
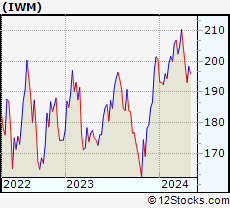
| SmallCap segment as represented by
IWM, an exchange-traded fund [ETF], holds basket of thousands of smallcap stocks from across all major sectors of the US stock market. The smallcap index (contains stocks like Riverbed & Sotheby's) is down by -2.46% and is currently underperforming the overall market by -7.8% year-to-date. Below is a quick view of technical charts and trends: | |
 IWM Weekly Chart |
|
| Long Term Trend: Good | |
| Medium Term Trend: Not Good | |
 IWM Daily Chart |
|
| Short Term Trend: Not Good | |
| Overall Trend Score: 26 | |
| YTD Performance: -2.46% | |
| **Trend Scores & Views Are Only For Educational Purposes And Not For Investing | |
| 12Stocks.com: Top Performing Small Cap Index Stocks | ||||||||||||||||||||||||||||||||||||||||||||||||
 The top performing Small Cap Index stocks year to date are
Now, more recently, over last week, the top performing Small Cap Index stocks on the move are


|
||||||||||||||||||||||||||||||||||||||||||||||||
| 12Stocks.com: Investing in Smallcap Index using Exchange Traded Funds | |
|
The following table shows list of key exchange traded funds (ETF) that
help investors track Smallcap index. The following list also includes leveraged ETF funds that track twice or thrice the daily returns of Smallcap indices. Short or inverse ETF funds move in the opposite direction to the index they track and are useful during market pullbacks or during bear markets. Quick View: Move mouse or cursor over ETF symbol (ticker) to view short-term technical chart and over ETF name to view long term chart. Click on ticker or stock name for detailed view. Click on to add stock symbol to your watchlist and to view watchlist. |
12Stocks.com List of ETFs that track Smallcap Index
| Ticker | ETF Name | Watchlist | Recent Price | Smart Investing & Trading Score | Change % | Week % | Year-to-date % |
| IWM | iShares Russell 2000 | | 195.78 | 26 | -1.46 | -1.46 | -2.46% |
| IJR | iShares Core S&P Small-Cap | | 103.54 | 13 | -0.93 | -0.93 | -4.35% |
| VTWO | Vanguard Russell 2000 ETF | | 79.23 | 26 | -1.36 | -1.36 | -2.31% |
| IWN | iShares Russell 2000 Value | | 148.60 | 18 | -1.18 | -1.18 | -4.33% |
| IWO | iShares Russell 2000 Growth | | 251.04 | 26 | -1.69 | -1.69 | -0.47% |
| IJS | iShares S&P Small-Cap 600 Value | | 95.20 | 0 | -1.01 | -1.01 | -7.64% |
| IJT | iShares S&P Small-Cap 600 Growth | | 123.52 | 31 | -1.01 | -1.01 | -1.29% |
| XSLV | PowerShares S&P SmallCap Low Volatil ETF | | 41.88 | 0 | -0.50 | -0.5 | -5.14% |
| SDD | ProShares UltraShort SmallCap600 | | 20.23 | 100 | 2.01 | 2.01 | 9.79% |
| SAA | ProShares Ultra SmallCap600 | | 22.43 | 0 | -0.58 | -0.58 | -10.1% |
| SBB | ProShares Short SmallCap600 | | 16.41 | 52 | -0.83 | -0.83 | 3.01% |
| SMLV | SPDR SSGA US Small Cap Low Volatil ETF | | 104.73 | 8 | -0.27 | -0.27 | -6.92% |
| 12Stocks.com: Charts, Trends, Fundamental Data and Performances of SmallCap Stocks | |
|
We now take in-depth look at all SmallCap stocks including charts, multi-period performances and overall trends (as measured by Smart Investing & Trading Score). One can sort SmallCap stocks (click link to choose) by Daily, Weekly and by Year-to-Date performances. Also, one can sort by size of the company or by market capitalization. |
| Select Your Default Chart Type: | |||||
| |||||
| Click on stock symbol or name for detailed view. Click on to add stock symbol to your watchlist and to view watchlist. Quick View: Move mouse or cursor over "Daily" to quickly view daily technical stock chart and over "Weekly" to view weekly technical stock chart. | |||||

 | FFIC Flushing Financial Corporation |
| Sector: Financials | |
| SubSector: Savings & Loans | |
| MarketCap: 336.43 Millions | |
| Recent Price: 11.09 Smart Investing & Trading Score: 32 | |
| Day Percent Change: -0.89% Day Change: -0.10 | |
| Week Change: -0.89% Year-to-date Change: -32.7% | |
| FFIC Links: Profile News Message Board | |
| Charts:- Daily , Weekly | |
| Add FFIC to Watchlist: View: Get Complete FFIC Trend Analysis ➞ | |
 | EVEX Eve Holding, Inc. |
| Sector: Industrials | |
| SubSector: Aerospace & Defense | |
| MarketCap: 2830 Millions | |
| Recent Price: 4.95 Smart Investing & Trading Score: 10 | |
| Day Percent Change: -3.51% Day Change: -0.18 | |
| Week Change: -3.51% Year-to-date Change: -32.7% | |
| EVEX Links: Profile News Message Board | |
| Charts:- Daily , Weekly | |
| Add EVEX to Watchlist: View: Get Complete EVEX Trend Analysis ➞ | |
 | ZURA Zura Bio Limited |
| Sector: Health Care | |
| SubSector: Biotechnology | |
| MarketCap: 242 Millions | |
| Recent Price: 3.14 Smart Investing & Trading Score: 86 | |
| Day Percent Change: -6.55% Day Change: -0.22 | |
| Week Change: -6.55% Year-to-date Change: -33.0% | |
| ZURA Links: Profile News Message Board | |
| Charts:- Daily , Weekly | |
| Add ZURA to Watchlist: View: Get Complete ZURA Trend Analysis ➞ | |
 | GSAT Globalstar, Inc. |
| Sector: Technology | |
| SubSector: Wireless Communications | |
| MarketCap: 485.127 Millions | |
| Recent Price: 1.30 Smart Investing & Trading Score: 10 | |
| Day Percent Change: -2.26% Day Change: -0.03 | |
| Week Change: -2.26% Year-to-date Change: -33.0% | |
| GSAT Links: Profile News Message Board | |
| Charts:- Daily , Weekly | |
| Add GSAT to Watchlist: View: Get Complete GSAT Trend Analysis ➞ | |
 | NFBK Northfield Bancorp, Inc. (Staten Island, NY) |
| Sector: Financials | |
| SubSector: Regional - Northeast Banks | |
| MarketCap: 540.699 Millions | |
| Recent Price: 8.41 Smart Investing & Trading Score: 35 | |
| Day Percent Change: 0.48% Day Change: 0.04 | |
| Week Change: 0.48% Year-to-date Change: -33.2% | |
| NFBK Links: Profile News Message Board | |
| Charts:- Daily , Weekly | |
| Add NFBK to Watchlist: View: Get Complete NFBK Trend Analysis ➞ | |
 | FFWM First Foundation Inc. |
| Sector: Financials | |
| SubSector: Regional - Midwest Banks | |
| MarketCap: 457.17 Millions | |
| Recent Price: 6.45 Smart Investing & Trading Score: 10 | |
| Day Percent Change: -6.52% Day Change: -0.45 | |
| Week Change: -6.52% Year-to-date Change: -33.4% | |
| FFWM Links: Profile News Message Board | |
| Charts:- Daily , Weekly | |
| Add FFWM to Watchlist: View: Get Complete FFWM Trend Analysis ➞ | |
 | UDMY Udemy, Inc. |
| Sector: Consumer Staples | |
| SubSector: Education & Training Services | |
| MarketCap: 1570 Millions | |
| Recent Price: 9.89 Smart Investing & Trading Score: 10 | |
| Day Percent Change: -1.20% Day Change: -0.12 | |
| Week Change: -1.2% Year-to-date Change: -33.5% | |
| UDMY Links: Profile News Message Board | |
| Charts:- Daily , Weekly | |
| Add UDMY to Watchlist: View: Get Complete UDMY Trend Analysis ➞ | |
 | FIGS FIGS, Inc. |
| Sector: Services & Goods | |
| SubSector: Apparel Manufacturing | |
| MarketCap: 1370 Millions | |
| Recent Price: 4.73 Smart Investing & Trading Score: 15 | |
| Day Percent Change: -4.25% Day Change: -0.21 | |
| Week Change: -4.25% Year-to-date Change: -33.7% | |
| FIGS Links: Profile News Message Board | |
| Charts:- Daily , Weekly | |
| Add FIGS to Watchlist: View: Get Complete FIGS Trend Analysis ➞ | |
 | XAIR Beyond Air, Inc. |
| Sector: Health Care | |
| SubSector: Medical Appliances & Equipment | |
| MarketCap: 132.48 Millions | |
| Recent Price: 1.30 Smart Investing & Trading Score: 10 | |
| Day Percent Change: -9.72% Day Change: -0.14 | |
| Week Change: -9.72% Year-to-date Change: -33.7% | |
| XAIR Links: Profile News Message Board | |
| Charts:- Daily , Weekly | |
| Add XAIR to Watchlist: View: Get Complete XAIR Trend Analysis ➞ | |
 | LIND Lindblad Expeditions Holdings, Inc. |
| Sector: Consumer Staples | |
| SubSector: Recreational Goods, Other | |
| MarketCap: 220.259 Millions | |
| Recent Price: 7.47 Smart Investing & Trading Score: 0 | |
| Day Percent Change: -4.23% Day Change: -0.33 | |
| Week Change: -4.23% Year-to-date Change: -33.7% | |
| LIND Links: Profile News Message Board | |
| Charts:- Daily , Weekly | |
| Add LIND to Watchlist: View: Get Complete LIND Trend Analysis ➞ | |
 | CHRS Coherus BioSciences, Inc. |
| Sector: Health Care | |
| SubSector: Biotechnology | |
| MarketCap: 1073.45 Millions | |
| Recent Price: 2.20 Smart Investing & Trading Score: 36 | |
| Day Percent Change: -1.35% Day Change: -0.03 | |
| Week Change: -1.35% Year-to-date Change: -33.9% | |
| CHRS Links: Profile News Message Board | |
| Charts:- Daily , Weekly | |
| Add CHRS to Watchlist: View: Get Complete CHRS Trend Analysis ➞ | |
 | KW Kennedy-Wilson Holdings, Inc. |
| Sector: Financials | |
| SubSector: Property Management | |
| MarketCap: 2025.42 Millions | |
| Recent Price: 8.18 Smart Investing & Trading Score: 20 | |
| Day Percent Change: -2.04% Day Change: -0.17 | |
| Week Change: -2.04% Year-to-date Change: -33.9% | |
| KW Links: Profile News Message Board | |
| Charts:- Daily , Weekly | |
| Add KW to Watchlist: View: Get Complete KW Trend Analysis ➞ | |
 | OSUR OraSure Technologies, Inc. |
| Sector: Health Care | |
| SubSector: Medical Instruments & Supplies | |
| MarketCap: 468.26 Millions | |
| Recent Price: 5.41 Smart Investing & Trading Score: 10 | |
| Day Percent Change: -1.99% Day Change: -0.11 | |
| Week Change: -1.99% Year-to-date Change: -34.0% | |
| OSUR Links: Profile News Message Board | |
| Charts:- Daily , Weekly | |
| Add OSUR to Watchlist: View: Get Complete OSUR Trend Analysis ➞ | |
 | TCX Tucows Inc. |
| Sector: Technology | |
| SubSector: Internet Information Providers | |
| MarketCap: 557.78 Millions | |
| Recent Price: 17.80 Smart Investing & Trading Score: 47 | |
| Day Percent Change: -1.17% Day Change: -0.21 | |
| Week Change: -1.17% Year-to-date Change: -34.1% | |
| TCX Links: Profile News Message Board | |
| Charts:- Daily , Weekly | |
| Add TCX to Watchlist: View: Get Complete TCX Trend Analysis ➞ | |
 | AMPH Amphastar Pharmaceuticals, Inc. |
| Sector: Health Care | |
| SubSector: Drug Manufacturers - Other | |
| MarketCap: 655.533 Millions | |
| Recent Price: 40.78 Smart Investing & Trading Score: 42 | |
| Day Percent Change: 2.93% Day Change: 1.16 | |
| Week Change: 2.93% Year-to-date Change: -34.1% | |
| AMPH Links: Profile News Message Board | |
| Charts:- Daily , Weekly | |
| Add AMPH to Watchlist: View: Get Complete AMPH Trend Analysis ➞ | |
 | MBUU Malibu Boats, Inc. |
| Sector: Consumer Staples | |
| SubSector: Recreational Goods, Other | |
| MarketCap: 561.059 Millions | |
| Recent Price: 36.14 Smart Investing & Trading Score: 0 | |
| Day Percent Change: -6.08% Day Change: -2.34 | |
| Week Change: -6.08% Year-to-date Change: -34.1% | |
| MBUU Links: Profile News Message Board | |
| Charts:- Daily , Weekly | |
| Add MBUU to Watchlist: View: Get Complete MBUU Trend Analysis ➞ | |
 | FLNC Fluence Energy, Inc. |
| Sector: Utilities | |
| SubSector: Utilities - Renewable | |
| MarketCap: 4550 Millions | |
| Recent Price: 15.73 Smart Investing & Trading Score: 10 | |
| Day Percent Change: -6.37% Day Change: -1.07 | |
| Week Change: -6.37% Year-to-date Change: -34.2% | |
| FLNC Links: Profile News Message Board | |
| Charts:- Daily , Weekly | |
| Add FLNC to Watchlist: View: Get Complete FLNC Trend Analysis ➞ | |
 | SHCR Sharecare, Inc. |
| Sector: Health Care | |
| SubSector: Health Information Services | |
| MarketCap: 640 Millions | |
| Recent Price: 0.71 Smart Investing & Trading Score: 20 | |
| Day Percent Change: -4.00% Day Change: -0.03 | |
| Week Change: -4% Year-to-date Change: -34.3% | |
| SHCR Links: Profile News Message Board | |
| Charts:- Daily , Weekly | |
| Add SHCR to Watchlist: View: Get Complete SHCR Trend Analysis ➞ | |
 | CMBM Cambium Networks Corporation |
| Sector: Technology | |
| SubSector: Communication Equipment | |
| MarketCap: 143.739 Millions | |
| Recent Price: 3.94 Smart Investing & Trading Score: 10 | |
| Day Percent Change: -4.14% Day Change: -0.17 | |
| Week Change: -4.14% Year-to-date Change: -34.3% | |
| CMBM Links: Profile News Message Board | |
| Charts:- Daily , Weekly | |
| Add CMBM to Watchlist: View: Get Complete CMBM Trend Analysis ➞ | |
 | IAS Integral Ad Science Holding Corp. |
| Sector: Services & Goods | |
| SubSector: Advertising Agencies | |
| MarketCap: 2760 Millions | |
| Recent Price: 9.54 Smart Investing & Trading Score: 10 | |
| Day Percent Change: -3.34% Day Change: -0.33 | |
| Week Change: -3.34% Year-to-date Change: -34.3% | |
| IAS Links: Profile News Message Board | |
| Charts:- Daily , Weekly | |
| Add IAS to Watchlist: View: Get Complete IAS Trend Analysis ➞ | |
 | CTKB Cytek Biosciences, Inc. |
| Sector: Health Care | |
| SubSector: Medical Devices | |
| MarketCap: 1140 Millions | |
| Recent Price: 6.02 Smart Investing & Trading Score: 5 | |
| Day Percent Change: -2.43% Day Change: -0.15 | |
| Week Change: -2.43% Year-to-date Change: -34.5% | |
| CTKB Links: Profile News Message Board | |
| Charts:- Daily , Weekly | |
| Add CTKB to Watchlist: View: Get Complete CTKB Trend Analysis ➞ | |
 | SCLX Scilex Holding Company |
| Sector: Health Care | |
| SubSector: Drug Manufacturers - General | |
| MarketCap: 927 Millions | |
| Recent Price: 1.28 Smart Investing & Trading Score: 10 | |
| Day Percent Change: -3.76% Day Change: -0.05 | |
| Week Change: -3.76% Year-to-date Change: -34.7% | |
| SCLX Links: Profile News Message Board | |
| Charts:- Daily , Weekly | |
| Add SCLX to Watchlist: View: Get Complete SCLX Trend Analysis ➞ | |
 | AAN Aaron s, Inc. |
| Sector: Transports | |
| SubSector: Rental & Leasing Services | |
| MarketCap: 1087.04 Millions | |
| Recent Price: 7.09 Smart Investing & Trading Score: 17 | |
| Day Percent Change: -0.98% Day Change: -0.07 | |
| Week Change: -0.98% Year-to-date Change: -34.8% | |
| AAN Links: Profile News Message Board | |
| Charts:- Daily , Weekly | |
| Add AAN to Watchlist: View: Get Complete AAN Trend Analysis ➞ | |
 | FTCI FTC Solar, Inc. |
| Sector: Technology | |
| SubSector: Solar | |
| MarketCap: 345 Millions | |
| Recent Price: 0.45 Smart Investing & Trading Score: 10 | |
| Day Percent Change: -7.24% Day Change: -0.04 | |
| Week Change: -7.24% Year-to-date Change: -34.9% | |
| FTCI Links: Profile News Message Board | |
| Charts:- Daily , Weekly | |
| Add FTCI to Watchlist: View: Get Complete FTCI Trend Analysis ➞ | |
 | PKST Peakstone Realty Trust |
| Sector: Financials | |
| SubSector: REIT - Diversified | |
| MarketCap: 1050 Millions | |
| Recent Price: 13.36 Smart Investing & Trading Score: 10 | |
| Day Percent Change: -2.98% Day Change: -0.41 | |
| Week Change: -2.98% Year-to-date Change: -34.9% | |
| PKST Links: Profile News Message Board | |
| Charts:- Daily , Weekly | |
| Add PKST to Watchlist: View: Get Complete PKST Trend Analysis ➞ | |
| Too many stocks? View smallcap stocks filtered by marketcap & sector |
| Marketcap: All SmallCap Stocks (default-no microcap), Large, Mid-Range, Small & MicroCap |
| Sector: Tech, Finance, Energy, Staples, Retail, Industrial, Materials, Utilities & Medical |
|
Best Stocks Today 12Stocks.com |
© 2024 12Stocks.com Terms & Conditions Privacy Contact Us
All Information Provided Only For Education And Not To Be Used For Investing or Trading. See Terms & Conditions


One More Thing ... Get Best Stocks Delivered Daily!
Never Ever Miss A Move With Our Top Ten Stocks Lists
Find Best Stocks In Any Market - Bull or Bear Market
Take A Peek At Our Top Ten Stocks Lists: Daily, Weekly, Year-to-Date & Top Trends
Find Best Stocks In Any Market - Bull or Bear Market
Take A Peek At Our Top Ten Stocks Lists: Daily, Weekly, Year-to-Date & Top Trends
Smallcap Stocks With Best Up Trends [0-bearish to 100-bullish]: Snap One[100], ProKidney [100], SES AI[100], Encore Wire[100], Century Aluminum[100], Core Molding[100], Theravance Biopharma[100], Acadia Realty[100], Prelude [100], Alpine Immune[100], Argan [100]
Best Smallcap Stocks Year-to-Date:
CareMax [570.1%], Janux [382.64%], Viking [259.81%], Alpine Immune[238.34%], Arcutis Bio[212.38%], Super Micro[210.54%], Vera [200.58%], Longboard [198.69%], Avidity Biosciences[164.49%], Veritone [151.1%], Stoke [132.13%] Best Smallcap Stocks This Week:
Snap One[29.48%], ProKidney [19.43%], Piedmont Lithium[15.77%], SES AI[15.44%], Eagle [13.29%], Encore Wire[11.59%], ESSA Bancorp[8.88%], Benson Hill[8.4%], Pulse Biosciences[8.31%], Century Aluminum[7.71%], Core Molding[7.45%] Best Smallcap Stocks Daily:
Snap One[29.48%], ProKidney [19.43%], Piedmont Lithium[15.77%], SES AI[15.44%], Eagle [13.29%], Encore Wire[11.59%], ESSA Bancorp[8.88%], Benson Hill[8.40%], Pulse Biosciences[8.31%], Century Aluminum[7.71%], Core Molding[7.45%]