
 Login Sign Up


| |||||
 |  | ||||

| 12Stocks.com Market Intelligence |
Best SmallCap Stocks
|
| In a hurry? Small Cap Stock Lists: Performance Trends Table, Stock Charts
Sort Small Cap stocks: Daily, Weekly, Year-to-Date, Market Cap & Trends. Filter Small Cap stocks list by sector: Show all, Tech, Finance, Energy, Staples, Retail, Industrial, Materials, Utilities and HealthCare Filter Small Cap stocks list by size: All Large Medium Small and MicroCap |
| 12Stocks.com Small Cap Stocks Performances & Trends Daily | |||||||||
|
|  The overall Smart Investing & Trading Score is 23 (0-bearish to 100-bullish) which puts Small Cap index in short term bearish to neutral trend. The Smart Investing & Trading Score from previous trading session is 13 and hence an improvement of trend.
| ||||||||
Here are the Smart Investing & Trading Scores of the most requested small cap stocks at 12Stocks.com (click stock name for detailed review):
|


| 12Stocks.com: Investing in Smallcap Index with Stocks | |
|
The following table helps investors and traders sort through current performance and trends (as measured by Smart Investing & Trading Score) of various
stocks in the Smallcap Index. Quick View: Move mouse or cursor over stock symbol (ticker) to view short-term technical chart and over stock name to view long term chart. Click on  to add stock symbol to your watchlist and to add stock symbol to your watchlist and  to view watchlist. Click on any ticker or stock name for detailed market intelligence report for that stock. to view watchlist. Click on any ticker or stock name for detailed market intelligence report for that stock. |
12Stocks.com Performance of Stocks in Smallcap Index
| Ticker | Stock Name | Watchlist | Category | Recent Price | Smart Investing & Trading Score | Change % | Weekly Change% |
| FSS | Federal Signal |   | Industrials | 81.52 | 26 | -1.30% | -2.43% |
| CVLT | Commvault Systems | | Technology | 94.15 | 49 | -0.51% | -2.43% |
| NABL | N-able | | Technology | 12.26 | 18 | 0.95% | -2.43% |
| CDXS | Codexis | | Health Care | 2.80 | 63 | 1.45% | -2.44% |
| TSQ | Townsquare Media | | Services & Goods | 12.01 | 64 | -3.15% | -2.44% |
| CCRN | Cross Country | | Services & Goods | 17.13 | 30 | 1.48% | -2.45% |
| LXU | LSB Industries | | Materials | 7.96 | 36 | 0.13% | -2.45% |
| AMPH | Amphastar | | Health Care | 38.65 | 10 | -3.50% | -2.45% |
| OBIO | Orchestra BioMed | | Health Care | 4.77 | 27 | 2.58% | -2.45% |
| ZIMV | ZimVie | | Health Care | 15.51 | 17 | 1.11% | -2.45% |
| CFFN | Capitol Federal | | Financials | 5.16 | 25 | 0.78% | -2.46% |
| KFY | Korn Ferry | | Services & Goods | 59.97 | 41 | -0.05% | -2.47% |
| FC | Franklin Covey | | Services & Goods | 37.98 | 10 | -0.58% | -2.47% |
| HBI | Hanesbrands | | Consumer Staples | 4.73 | 68 | 0.42% | -2.47% |
| KRT | Karat Packaging | | Services & Goods | 27.05 | 36 | 1.41% | -2.47% |
| OFLX | Omega Flex | | Industrials | 66.85 | 10 | -0.28% | -2.48% |
| GPMT | Granite Point | | Financials | 4.31 | 27 | 0.70% | -2.49% |
| VSH | Vishay Inter | | Technology | 21.08 | 0 | -0.05% | -2.50% |
| REX | REX American | | Industrials | 55.30 | 58 | -3.24% | -2.50% |
| PLXS | Plexus | | Technology | 93.18 | 20 | -0.53% | -2.52% |
| PPBI | Pacific Premier | | Financials | 21.31 | 17 | 0.33% | -2.52% |
| GHC | Graham | | Services & Goods | 698.18 | 10 | 0.46% | -2.53% |
| LINC | Loln Educational | | Services & Goods | 9.59 | 26 | -1.03% | -2.54% |
| NG | NovaGold Resources | | Materials | 3.07 | 61 | -1.92% | -2.54% |
| BANC | Banc of California | | Financials | 13.80 | 33 | -0.07% | -2.54% |


| Too many stocks? View smallcap stocks filtered by marketcap & sector |
| Marketcap: All SmallCap Stocks (default-no microcap), Large, Mid-Range, Small |
| Smallcap Sector: Tech, Finance, Energy, Staples, Retail, Industrial, Materials, & Medical |
|
Get the most comprehensive stock market coverage daily at 12Stocks.com ➞ Best Stocks Today ➞ Best Stocks Weekly ➞ Best Stocks Year-to-Date ➞ Best Stocks Trends ➞  Best Stocks Today 12Stocks.com Best Nasdaq Stocks ➞ Best S&P 500 Stocks ➞ Best Tech Stocks ➞ Best Biotech Stocks ➞ |
| Detailed Overview of SmallCap Stocks |
| SmallCap Technical Overview, Leaders & Laggards, Top SmallCap ETF Funds & Detailed SmallCap Stocks List, Charts, Trends & More |
| Smallcap: Technical Analysis, Trends & YTD Performance | |
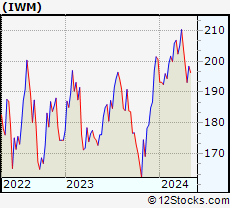
| SmallCap segment as represented by
IWM, an exchange-traded fund [ETF], holds basket of thousands of smallcap stocks from across all major sectors of the US stock market. The smallcap index (contains stocks like Riverbed & Sotheby's) is down by -3.92% and is currently underperforming the overall market by -8.11% year-to-date. Below is a quick view of technical charts and trends: | |
 IWM Weekly Chart |
|
| Long Term Trend: Not Good | |
| Medium Term Trend: Not Good | |
 IWM Daily Chart |
|
| Short Term Trend: Not Good | |
| Overall Trend Score: 23 | |
| YTD Performance: -3.92% | |
| **Trend Scores & Views Are Only For Educational Purposes And Not For Investing | |
| 12Stocks.com: Top Performing Small Cap Index Stocks | ||||||||||||||||||||||||||||||||||||||||||||||||
 The top performing Small Cap Index stocks year to date are
Now, more recently, over last week, the top performing Small Cap Index stocks on the move are


|
||||||||||||||||||||||||||||||||||||||||||||||||
| 12Stocks.com: Investing in Smallcap Index using Exchange Traded Funds | |
|
The following table shows list of key exchange traded funds (ETF) that
help investors track Smallcap index. The following list also includes leveraged ETF funds that track twice or thrice the daily returns of Smallcap indices. Short or inverse ETF funds move in the opposite direction to the index they track and are useful during market pullbacks or during bear markets. Quick View: Move mouse or cursor over ETF symbol (ticker) to view short-term technical chart and over ETF name to view long term chart. Click on ticker or stock name for detailed view. Click on to add stock symbol to your watchlist and to view watchlist. |
12Stocks.com List of ETFs that track Smallcap Index
| Ticker | ETF Name | Watchlist | Recent Price | Smart Investing & Trading Score | Change % | Week % | Year-to-date % |
| IWM | iShares Russell 2000 | | 192.84 | 23 | -0.08 | -2.94 | -3.92% |
| IJR | iShares Core S&P Small-Cap | | 102.34 | 10 | 0.21 | -2.08 | -5.46% |
| VTWO | Vanguard Russell 2000 ETF | | 77.95 | 23 | -0.13 | -2.95 | -3.88% |
| IWN | iShares Russell 2000 Value | | 146.33 | 10 | 0.21 | -2.69 | -5.79% |
| IJS | iShares S&P Small-Cap 600 Value | | 94.51 | 18 | 0.41 | -1.73 | -8.31% |
| IWO | iShares Russell 2000 Growth | | 246.94 | 36 | -0.44 | -3.3 | -2.09% |
| IJT | iShares S&P Small-Cap 600 Growth | | 121.57 | 13 | -0.22 | -2.57 | -2.85% |
| XSLV | PowerShares S&P SmallCap Low Volatil ETF | | 41.65 | 25 | 0.56 | -1.05 | -5.66% |
| SAA | ProShares Ultra SmallCap600 | | 21.62 | 10 | -0.18 | -4.17 | -13.35% |
| SMLV | SPDR SSGA US Small Cap Low Volatil ETF | | 103.83 | 10 | 0.16 | -1.13 | -7.72% |
| SBB | ProShares Short SmallCap600 | | 16.98 | 100 | 0.77 | 2.62 | 6.59% |
| SDD | ProShares UltraShort SmallCap600 | | 20.69 | 95 | 0.44 | 4.33 | 12.28% |
| 12Stocks.com: Charts, Trends, Fundamental Data and Performances of SmallCap Stocks | |
|
We now take in-depth look at all SmallCap stocks including charts, multi-period performances and overall trends (as measured by Smart Investing & Trading Score). One can sort SmallCap stocks (click link to choose) by Daily, Weekly and by Year-to-Date performances. Also, one can sort by size of the company or by market capitalization. |
| Select Your Default Chart Type: | |||||
| |||||
| Click on stock symbol or name for detailed view. Click on to add stock symbol to your watchlist and to view watchlist. Quick View: Move mouse or cursor over "Daily" to quickly view daily technical stock chart and over "Weekly" to view weekly technical stock chart. | |||||

 | FSS Federal Signal Corporation |
| Sector: Industrials | |
| SubSector: Pollution & Treatment Controls | |
| MarketCap: 1694.05 Millions | |
| Recent Price: 81.52 Smart Investing & Trading Score: 26 | |
| Day Percent Change: -1.30% Day Change: -1.07 | |
| Week Change: -2.43% Year-to-date Change: 6.2% | |
| FSS Links: Profile News Message Board | |
| Charts:- Daily , Weekly | |
| Add FSS to Watchlist: View: Get Complete FSS Trend Analysis ➞ | |
 | CVLT Commvault Systems, Inc. |
| Sector: Technology | |
| SubSector: Application Software | |
| MarketCap: 1607.22 Millions | |
| Recent Price: 94.15 Smart Investing & Trading Score: 49 | |
| Day Percent Change: -0.51% Day Change: -0.48 | |
| Week Change: -2.43% Year-to-date Change: 17.9% | |
| CVLT Links: Profile News Message Board | |
| Charts:- Daily , Weekly | |
| Add CVLT to Watchlist: View: Get Complete CVLT Trend Analysis ➞ | |
 | NABL N-able, Inc. |
| Sector: Technology | |
| SubSector: Information Technology Services | |
| MarketCap: 2590 Millions | |
| Recent Price: 12.26 Smart Investing & Trading Score: 18 | |
| Day Percent Change: 0.95% Day Change: 0.12 | |
| Week Change: -2.43% Year-to-date Change: -7.9% | |
| NABL Links: Profile News Message Board | |
| Charts:- Daily , Weekly | |
| Add NABL to Watchlist: View: Get Complete NABL Trend Analysis ➞ | |
 | CDXS Codexis, Inc. |
| Sector: Health Care | |
| SubSector: Biotechnology | |
| MarketCap: 592.185 Millions | |
| Recent Price: 2.80 Smart Investing & Trading Score: 63 | |
| Day Percent Change: 1.45% Day Change: 0.04 | |
| Week Change: -2.44% Year-to-date Change: -8.2% | |
| CDXS Links: Profile News Message Board | |
| Charts:- Daily , Weekly | |
| Add CDXS to Watchlist: View: Get Complete CDXS Trend Analysis ➞ | |
 | TSQ Townsquare Media, Inc. |
| Sector: Services & Goods | |
| SubSector: Broadcasting - Radio | |
| MarketCap: 101.795 Millions | |
| Recent Price: 12.01 Smart Investing & Trading Score: 64 | |
| Day Percent Change: -3.15% Day Change: -0.39 | |
| Week Change: -2.44% Year-to-date Change: 13.7% | |
| TSQ Links: Profile News Message Board | |
| Charts:- Daily , Weekly | |
| Add TSQ to Watchlist: View: Get Complete TSQ Trend Analysis ➞ | |
 | CCRN Cross Country Healthcare, Inc. |
| Sector: Services & Goods | |
| SubSector: Staffing & Outsourcing Services | |
| MarketCap: 348.328 Millions | |
| Recent Price: 17.13 Smart Investing & Trading Score: 30 | |
| Day Percent Change: 1.48% Day Change: 0.25 | |
| Week Change: -2.45% Year-to-date Change: -24.3% | |
| CCRN Links: Profile News Message Board | |
| Charts:- Daily , Weekly | |
| Add CCRN to Watchlist: View: Get Complete CCRN Trend Analysis ➞ | |
 | LXU LSB Industries, Inc. |
| Sector: Materials | |
| SubSector: Chemicals - Major Diversified | |
| MarketCap: 51.7736 Millions | |
| Recent Price: 7.96 Smart Investing & Trading Score: 36 | |
| Day Percent Change: 0.13% Day Change: 0.01 | |
| Week Change: -2.45% Year-to-date Change: -14.5% | |
| LXU Links: Profile News Message Board | |
| Charts:- Daily , Weekly | |
| Add LXU to Watchlist: View: Get Complete LXU Trend Analysis ➞ | |
 | AMPH Amphastar Pharmaceuticals, Inc. |
| Sector: Health Care | |
| SubSector: Drug Manufacturers - Other | |
| MarketCap: 655.533 Millions | |
| Recent Price: 38.65 Smart Investing & Trading Score: 10 | |
| Day Percent Change: -3.50% Day Change: -1.40 | |
| Week Change: -2.45% Year-to-date Change: -37.5% | |
| AMPH Links: Profile News Message Board | |
| Charts:- Daily , Weekly | |
| Add AMPH to Watchlist: View: Get Complete AMPH Trend Analysis ➞ | |
 | OBIO Orchestra BioMed Holdings, Inc. |
| Sector: Health Care | |
| SubSector: Biotechnology | |
| MarketCap: 271 Millions | |
| Recent Price: 4.77 Smart Investing & Trading Score: 27 | |
| Day Percent Change: 2.58% Day Change: 0.12 | |
| Week Change: -2.45% Year-to-date Change: -47.6% | |
| OBIO Links: Profile News Message Board | |
| Charts:- Daily , Weekly | |
| Add OBIO to Watchlist: View: Get Complete OBIO Trend Analysis ➞ | |
 | ZIMV ZimVie Inc. |
| Sector: Health Care | |
| SubSector: Medical Devices | |
| MarketCap: 303 Millions | |
| Recent Price: 15.51 Smart Investing & Trading Score: 17 | |
| Day Percent Change: 1.11% Day Change: 0.17 | |
| Week Change: -2.45% Year-to-date Change: -12.5% | |
| ZIMV Links: Profile News Message Board | |
| Charts:- Daily , Weekly | |
| Add ZIMV to Watchlist: View: Get Complete ZIMV Trend Analysis ➞ | |
 | CFFN Capitol Federal Financial, Inc. |
| Sector: Financials | |
| SubSector: Savings & Loans | |
| MarketCap: 1639.1 Millions | |
| Recent Price: 5.16 Smart Investing & Trading Score: 25 | |
| Day Percent Change: 0.78% Day Change: 0.04 | |
| Week Change: -2.46% Year-to-date Change: -20.0% | |
| CFFN Links: Profile News Message Board | |
| Charts:- Daily , Weekly | |
| Add CFFN to Watchlist: View: Get Complete CFFN Trend Analysis ➞ | |
 | KFY Korn Ferry |
| Sector: Services & Goods | |
| SubSector: Staffing & Outsourcing Services | |
| MarketCap: 1534.28 Millions | |
| Recent Price: 59.97 Smart Investing & Trading Score: 41 | |
| Day Percent Change: -0.05% Day Change: -0.03 | |
| Week Change: -2.47% Year-to-date Change: 1.0% | |
| KFY Links: Profile News Message Board | |
| Charts:- Daily , Weekly | |
| Add KFY to Watchlist: View: Get Complete KFY Trend Analysis ➞ | |
 | FC Franklin Covey Co. |
| Sector: Services & Goods | |
| SubSector: Education & Training Services | |
| MarketCap: 243.306 Millions | |
| Recent Price: 37.98 Smart Investing & Trading Score: 10 | |
| Day Percent Change: -0.58% Day Change: -0.22 | |
| Week Change: -2.47% Year-to-date Change: -12.8% | |
| FC Links: Profile News Message Board | |
| Charts:- Daily , Weekly | |
| Add FC to Watchlist: View: Get Complete FC Trend Analysis ➞ | |
 | HBI Hanesbrands Inc. |
| Sector: Consumer Staples | |
| SubSector: Textile - Apparel Clothing | |
| MarketCap: 3559.75 Millions | |
| Recent Price: 4.73 Smart Investing & Trading Score: 68 | |
| Day Percent Change: 0.42% Day Change: 0.02 | |
| Week Change: -2.47% Year-to-date Change: 6.1% | |
| HBI Links: Profile News Message Board | |
| Charts:- Daily , Weekly | |
| Add HBI to Watchlist: View: Get Complete HBI Trend Analysis ➞ | |
 | KRT Karat Packaging Inc. |
| Sector: Services & Goods | |
| SubSector: Packaging & Containers | |
| MarketCap: 357 Millions | |
| Recent Price: 27.05 Smart Investing & Trading Score: 36 | |
| Day Percent Change: 1.41% Day Change: 0.38 | |
| Week Change: -2.47% Year-to-date Change: 8.6% | |
| KRT Links: Profile News Message Board | |
| Charts:- Daily , Weekly | |
| Add KRT to Watchlist: View: Get Complete KRT Trend Analysis ➞ | |
 | OFLX Omega Flex, Inc. |
| Sector: Industrials | |
| SubSector: Industrial Equipment & Components | |
| MarketCap: 590.609 Millions | |
| Recent Price: 66.85 Smart Investing & Trading Score: 10 | |
| Day Percent Change: -0.28% Day Change: -0.19 | |
| Week Change: -2.48% Year-to-date Change: -5.2% | |
| OFLX Links: Profile News Message Board | |
| Charts:- Daily , Weekly | |
| Add OFLX to Watchlist: View: Get Complete OFLX Trend Analysis ➞ | |
 | GPMT Granite Point Mortgage Trust Inc. |
| Sector: Financials | |
| SubSector: Mortgage Investment | |
| MarketCap: 289.739 Millions | |
| Recent Price: 4.31 Smart Investing & Trading Score: 27 | |
| Day Percent Change: 0.70% Day Change: 0.03 | |
| Week Change: -2.49% Year-to-date Change: -27.4% | |
| GPMT Links: Profile News Message Board | |
| Charts:- Daily , Weekly | |
| Add GPMT to Watchlist: View: Get Complete GPMT Trend Analysis ➞ | |
 | VSH Vishay Intertechnology, Inc. |
| Sector: Technology | |
| SubSector: Semiconductor - Broad Line | |
| MarketCap: 2132.52 Millions | |
| Recent Price: 21.08 Smart Investing & Trading Score: 0 | |
| Day Percent Change: -0.05% Day Change: -0.01 | |
| Week Change: -2.5% Year-to-date Change: -12.1% | |
| VSH Links: Profile News Message Board | |
| Charts:- Daily , Weekly | |
| Add VSH to Watchlist: View: Get Complete VSH Trend Analysis ➞ | |
 | REX REX American Resources Corporation |
| Sector: Industrials | |
| SubSector: Conglomerates | |
| MarketCap: 373.748 Millions | |
| Recent Price: 55.30 Smart Investing & Trading Score: 58 | |
| Day Percent Change: -3.24% Day Change: -1.85 | |
| Week Change: -2.5% Year-to-date Change: 16.9% | |
| REX Links: Profile News Message Board | |
| Charts:- Daily , Weekly | |
| Add REX to Watchlist: View: Get Complete REX Trend Analysis ➞ | |
 | PLXS Plexus Corp. |
| Sector: Technology | |
| SubSector: Printed Circuit Boards | |
| MarketCap: 1457.15 Millions | |
| Recent Price: 93.18 Smart Investing & Trading Score: 20 | |
| Day Percent Change: -0.53% Day Change: -0.50 | |
| Week Change: -2.52% Year-to-date Change: -13.8% | |
| PLXS Links: Profile News Message Board | |
| Charts:- Daily , Weekly | |
| Add PLXS to Watchlist: View: Get Complete PLXS Trend Analysis ➞ | |
 | PPBI Pacific Premier Bancorp, Inc. |
| Sector: Financials | |
| SubSector: Regional - Pacific Banks | |
| MarketCap: 978.029 Millions | |
| Recent Price: 21.31 Smart Investing & Trading Score: 17 | |
| Day Percent Change: 0.33% Day Change: 0.07 | |
| Week Change: -2.52% Year-to-date Change: -26.8% | |
| PPBI Links: Profile News Message Board | |
| Charts:- Daily , Weekly | |
| Add PPBI to Watchlist: View: Get Complete PPBI Trend Analysis ➞ | |
 | GHC Graham Holdings Company |
| Sector: Services & Goods | |
| SubSector: Education & Training Services | |
| MarketCap: 1871.06 Millions | |
| Recent Price: 698.18 Smart Investing & Trading Score: 10 | |
| Day Percent Change: 0.46% Day Change: 3.18 | |
| Week Change: -2.53% Year-to-date Change: 0.2% | |
| GHC Links: Profile News Message Board | |
| Charts:- Daily , Weekly | |
| Add GHC to Watchlist: View: Get Complete GHC Trend Analysis ➞ | |
 | LINC Lincoln Educational Services Corporation |
| Sector: Services & Goods | |
| SubSector: Education & Training Services | |
| MarketCap: 59.5006 Millions | |
| Recent Price: 9.59 Smart Investing & Trading Score: 26 | |
| Day Percent Change: -1.03% Day Change: -0.10 | |
| Week Change: -2.54% Year-to-date Change: -4.5% | |
| LINC Links: Profile News Message Board | |
| Charts:- Daily , Weekly | |
| Add LINC to Watchlist: View: Get Complete LINC Trend Analysis ➞ | |
 | NG NovaGold Resources Inc. |
| Sector: Materials | |
| SubSector: Gold | |
| MarketCap: 2499.49 Millions | |
| Recent Price: 3.07 Smart Investing & Trading Score: 61 | |
| Day Percent Change: -1.92% Day Change: -0.06 | |
| Week Change: -2.54% Year-to-date Change: -17.9% | |
| NG Links: Profile News Message Board | |
| Charts:- Daily , Weekly | |
| Add NG to Watchlist: View: Get Complete NG Trend Analysis ➞ | |
 | BANC Banc of California, Inc. |
| Sector: Financials | |
| SubSector: Regional - Pacific Banks | |
| MarketCap: 459.929 Millions | |
| Recent Price: 13.80 Smart Investing & Trading Score: 33 | |
| Day Percent Change: -0.07% Day Change: -0.01 | |
| Week Change: -2.54% Year-to-date Change: 2.8% | |
| BANC Links: Profile News Message Board | |
| Charts:- Daily , Weekly | |
| Add BANC to Watchlist: View: Get Complete BANC Trend Analysis ➞ | |
| Too many stocks? View smallcap stocks filtered by marketcap & sector |
| Marketcap: All SmallCap Stocks (default-no microcap), Large, Mid-Range, Small & MicroCap |
| Sector: Tech, Finance, Energy, Staples, Retail, Industrial, Materials, Utilities & Medical |
|
Best Stocks Today 12Stocks.com |
© 2024 12Stocks.com Terms & Conditions Privacy Contact Us
All Information Provided Only For Education And Not To Be Used For Investing or Trading. See Terms & Conditions


One More Thing ... Get Best Stocks Delivered Daily!
Never Ever Miss A Move With Our Top Ten Stocks Lists
Find Best Stocks In Any Market - Bull or Bear Market
Take A Peek At Our Top Ten Stocks Lists: Daily, Weekly, Year-to-Date & Top Trends
Find Best Stocks In Any Market - Bull or Bear Market
Take A Peek At Our Top Ten Stocks Lists: Daily, Weekly, Year-to-Date & Top Trends
Smallcap Stocks With Best Up Trends [0-bearish to 100-bullish]: Badger Meter[100], Cullinan Oncology[100], Oscar Health[100], NextNav [100], EchoStar [100], Victory Capital[100], Macatawa Bank[100], IMAX [100], Envestnet [100], ALX Oncology[100], Argan [95]
Best Smallcap Stocks Year-to-Date:
Agenus [500.31%], CareMax [417.53%], Janux [348.12%], Viking [247.5%], Alpine Immune[238.5%], Super Micro[226.63%], Longboard [194.76%], Arcutis Bio[192.57%], Vera [161.3%], Avidity Biosciences[154.87%], Hippo [128.32%] Best Smallcap Stocks This Week:
Macatawa Bank[44.42%], 23andMe Holding[33.3%], ProKidney [32%], Snap One[29.73%], Vertex Energy[25.96%], ALX Oncology[20.64%], Vanda [20.63%], Expensify [18.37%], Badger Meter[16.72%], ContextLogic [15%], Cullinan Oncology[13.89%] Best Smallcap Stocks Daily:
23andMe Holding[65.91%], Vertex Energy[33.78%], Zura Bio[17.20%], Badger Meter[16.65%], ContextLogic [15.81%], Expensify [15.23%], Montrose Environmental[12.84%], Vaxxinity [10.05%], Cipher Mining[8.65%], FiscalNote [8.61%], Vuzix [8.15%]