
 Login Sign Up


| |||||
 |  | ||||

| 12Stocks.com Market Intelligence |
Best SmallCap Stocks
|
| In a hurry? Small Cap Stock Lists: Performance Trends Table, Stock Charts
Sort Small Cap stocks: Daily, Weekly, Year-to-Date, Market Cap & Trends. Filter Small Cap stocks list by sector: Show all, Tech, Finance, Energy, Staples, Retail, Industrial, Materials, Utilities and HealthCare Filter Small Cap stocks list by size: All Large Medium Small and MicroCap |
| 12Stocks.com Small Cap Stocks Performances & Trends Daily | |||||||||
|
|  The overall Smart Investing & Trading Score is 23 (0-bearish to 100-bullish) which puts Small Cap index in short term bearish to neutral trend. The Smart Investing & Trading Score from previous trading session is 13 and hence an improvement of trend.
| ||||||||
Here are the Smart Investing & Trading Scores of the most requested small cap stocks at 12Stocks.com (click stock name for detailed review):
|


| 12Stocks.com: Investing in Smallcap Index with Stocks | |
|
The following table helps investors and traders sort through current performance and trends (as measured by Smart Investing & Trading Score) of various
stocks in the Smallcap Index. Quick View: Move mouse or cursor over stock symbol (ticker) to view short-term technical chart and over stock name to view long term chart. Click on  to add stock symbol to your watchlist and to add stock symbol to your watchlist and  to view watchlist. Click on any ticker or stock name for detailed market intelligence report for that stock. to view watchlist. Click on any ticker or stock name for detailed market intelligence report for that stock. |
12Stocks.com Performance of Stocks in Smallcap Index
| Ticker | Stock Name | Watchlist | Category | Recent Price | Smart Investing & Trading Score | Change % | Weekly Change% |
| PRTA | Prothena |   | Health Care | 20.57 | 10 | -2.05% | -7.51% |
| RDW | Redwire | | Industrials | 3.57 | 48 | 4.69% | -7.51% |
| HIPO | Hippo | | Financials | 20.80 | 51 | 2.56% | -7.51% |
| PAR | PAR | | Technology | 40.11 | 0 | -1.59% | -7.52% |
| AKRO | Akero | | Health Care | 20.51 | 10 | -5.05% | -7.53% |
| TWST | Twist Bioscience | | Health Care | 28.36 | 10 | -0.74% | -7.56% |
| MASS | 908 Devices | | Health Care | 5.61 | 17 | 0.36% | -7.58% |
| AKTS | Akoustis | | Technology | 0.53 | 47 | 4.91% | -7.59% |
| HQI | HireQuest | | Services & Goods | 11.94 | 10 | -1.40% | -7.59% |
| IRBT | iRobot | | Consumer Staples | 7.25 | 10 | 3.13% | -7.64% |
| NVTS | Navitas Semiconductor | | Technology | 3.99 | 17 | 2.31% | -7.64% |
| LCTX | Lineage Cell | | Health Care | 1.20 | 36 | -6.98% | -7.69% |
| SHO | Sunstone Hotel | | Financials | 10.06 | 0 | -0.59% | -7.71% |
| EGHT | 8x8 | | Technology | 2.15 | 10 | -3.59% | -7.73% |
| SLRN | Acelyrin | | Health Care | 4.96 | 20 | -1.29% | -7.73% |
| BW | Babcock & Wilcox Enterprises | | Industrials | 0.97 | 10 | -3.16% | -7.77% |
| TDUP | ThredUp | | Services & Goods | 1.54 | 17 | 0.65% | -7.78% |
| AOSL | Alpha and | | Technology | 20.02 | 10 | -3.10% | -7.83% |
| RPD | Rapid7 | | Technology | 44.15 | 0 | 0.80% | -7.83% |
| OPI | Office Properties | | Financials | 1.88 | 20 | -0.53% | -7.84% |
| ROAD | Construction Partners | | Industrials | 51.31 | 26 | -3.08% | -7.90% |
| ERII | Energy Recovery | | Industrials | 13.63 | 20 | 0.74% | -7.91% |
| FOLD | Amicus | | Health Care | 10.33 | 0 | -2.09% | -7.93% |
| NOVT | Novanta | | Technology | 150.02 | 0 | -2.90% | -7.96% |
| SDGR | Schrodinger | | Health Care | 24.34 | 0 | -2.80% | -7.98% |


| Too many stocks? View smallcap stocks filtered by marketcap & sector |
| Marketcap: All SmallCap Stocks (default-no microcap), Large, Mid-Range, Small |
| Smallcap Sector: Tech, Finance, Energy, Staples, Retail, Industrial, Materials, & Medical |
|
Get the most comprehensive stock market coverage daily at 12Stocks.com ➞ Best Stocks Today ➞ Best Stocks Weekly ➞ Best Stocks Year-to-Date ➞ Best Stocks Trends ➞  Best Stocks Today 12Stocks.com Best Nasdaq Stocks ➞ Best S&P 500 Stocks ➞ Best Tech Stocks ➞ Best Biotech Stocks ➞ |
| Detailed Overview of SmallCap Stocks |
| SmallCap Technical Overview, Leaders & Laggards, Top SmallCap ETF Funds & Detailed SmallCap Stocks List, Charts, Trends & More |
| Smallcap: Technical Analysis, Trends & YTD Performance | |
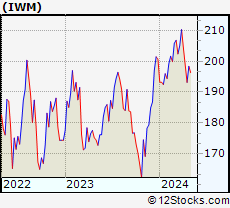
| SmallCap segment as represented by
IWM, an exchange-traded fund [ETF], holds basket of thousands of smallcap stocks from across all major sectors of the US stock market. The smallcap index (contains stocks like Riverbed & Sotheby's) is down by -3.92% and is currently underperforming the overall market by -8.11% year-to-date. Below is a quick view of technical charts and trends: | |
 IWM Weekly Chart |
|
| Long Term Trend: Not Good | |
| Medium Term Trend: Not Good | |
 IWM Daily Chart |
|
| Short Term Trend: Not Good | |
| Overall Trend Score: 23 | |
| YTD Performance: -3.92% | |
| **Trend Scores & Views Are Only For Educational Purposes And Not For Investing | |
| 12Stocks.com: Top Performing Small Cap Index Stocks | ||||||||||||||||||||||||||||||||||||||||||||||||
 The top performing Small Cap Index stocks year to date are
Now, more recently, over last week, the top performing Small Cap Index stocks on the move are


|
||||||||||||||||||||||||||||||||||||||||||||||||
| 12Stocks.com: Investing in Smallcap Index using Exchange Traded Funds | |
|
The following table shows list of key exchange traded funds (ETF) that
help investors track Smallcap index. The following list also includes leveraged ETF funds that track twice or thrice the daily returns of Smallcap indices. Short or inverse ETF funds move in the opposite direction to the index they track and are useful during market pullbacks or during bear markets. Quick View: Move mouse or cursor over ETF symbol (ticker) to view short-term technical chart and over ETF name to view long term chart. Click on ticker or stock name for detailed view. Click on to add stock symbol to your watchlist and to view watchlist. |
12Stocks.com List of ETFs that track Smallcap Index
| Ticker | ETF Name | Watchlist | Recent Price | Smart Investing & Trading Score | Change % | Week % | Year-to-date % |
| IWM | iShares Russell 2000 | | 192.84 | 23 | -0.08 | -2.94 | -3.92% |
| IJR | iShares Core S&P Small-Cap | | 102.34 | 31 | 0.21 | -2.08 | -5.46% |
| VTWO | Vanguard Russell 2000 ETF | | 77.95 | 23 | -0.13 | -2.95 | -3.88% |
| IWN | iShares Russell 2000 Value | | 146.33 | 10 | 0.21 | -2.69 | -5.79% |
| IJS | iShares S&P Small-Cap 600 Value | | 94.51 | 10 | 0.41 | -1.73 | -8.31% |
| IWO | iShares Russell 2000 Growth | | 246.94 | 36 | -0.44 | -3.3 | -2.09% |
| IJT | iShares S&P Small-Cap 600 Growth | | 121.57 | 23 | -0.22 | -2.57 | -2.85% |
| XSLV | PowerShares S&P SmallCap Low Volatil ETF | | 41.65 | 25 | 0.56 | -1.05 | -5.66% |
| SAA | ProShares Ultra SmallCap600 | | 21.62 | 10 | -0.18 | -4.17 | -13.35% |
| SMLV | SPDR SSGA US Small Cap Low Volatil ETF | | 103.83 | 10 | 0.16 | -1.13 | -7.72% |
| SBB | ProShares Short SmallCap600 | | 16.98 | 95 | 0.77 | 2.62 | 6.59% |
| SDD | ProShares UltraShort SmallCap600 | | 20.69 | 83 | 0.44 | 4.33 | 12.28% |
| 12Stocks.com: Charts, Trends, Fundamental Data and Performances of SmallCap Stocks | |
|
We now take in-depth look at all SmallCap stocks including charts, multi-period performances and overall trends (as measured by Smart Investing & Trading Score). One can sort SmallCap stocks (click link to choose) by Daily, Weekly and by Year-to-Date performances. Also, one can sort by size of the company or by market capitalization. |
| Select Your Default Chart Type: | |||||
| |||||
| Click on stock symbol or name for detailed view. Click on to add stock symbol to your watchlist and to view watchlist. Quick View: Move mouse or cursor over "Daily" to quickly view daily technical stock chart and over "Weekly" to view weekly technical stock chart. | |||||

 | PRTA Prothena Corporation plc |
| Sector: Health Care | |
| SubSector: Biotechnology | |
| MarketCap: 357.985 Millions | |
| Recent Price: 20.57 Smart Investing & Trading Score: 10 | |
| Day Percent Change: -2.05% Day Change: -0.43 | |
| Week Change: -7.51% Year-to-date Change: -43.4% | |
| PRTA Links: Profile News Message Board | |
| Charts:- Daily , Weekly | |
| Add PRTA to Watchlist: View: Get Complete PRTA Trend Analysis ➞ | |
 | RDW Redwire Corporation |
| Sector: Industrials | |
| SubSector: Aerospace & Defense | |
| MarketCap: 160 Millions | |
| Recent Price: 3.57 Smart Investing & Trading Score: 48 | |
| Day Percent Change: 4.69% Day Change: 0.16 | |
| Week Change: -7.51% Year-to-date Change: 25.3% | |
| RDW Links: Profile News Message Board | |
| Charts:- Daily , Weekly | |
| Add RDW to Watchlist: View: Get Complete RDW Trend Analysis ➞ | |
 | HIPO Hippo Holdings Inc. |
| Sector: Financials | |
| SubSector: Insurance - Specialty | |
| MarketCap: 377 Millions | |
| Recent Price: 20.80 Smart Investing & Trading Score: 51 | |
| Day Percent Change: 2.56% Day Change: 0.52 | |
| Week Change: -7.51% Year-to-date Change: 128.3% | |
| HIPO Links: Profile News Message Board | |
| Charts:- Daily , Weekly | |
| Add HIPO to Watchlist: View: Get Complete HIPO Trend Analysis ➞ | |
 | PAR PAR Technology Corporation |
| Sector: Technology | |
| SubSector: Application Software | |
| MarketCap: 255.862 Millions | |
| Recent Price: 40.11 Smart Investing & Trading Score: 0 | |
| Day Percent Change: -1.59% Day Change: -0.65 | |
| Week Change: -7.52% Year-to-date Change: -7.9% | |
| PAR Links: Profile News Message Board | |
| Charts:- Daily , Weekly | |
| Add PAR to Watchlist: View: Get Complete PAR Trend Analysis ➞ | |
 | AKRO Akero Therapeutics, Inc. |
| Sector: Health Care | |
| SubSector: Biotechnology | |
| MarketCap: 675.085 Millions | |
| Recent Price: 20.51 Smart Investing & Trading Score: 10 | |
| Day Percent Change: -5.05% Day Change: -1.09 | |
| Week Change: -7.53% Year-to-date Change: -12.2% | |
| AKRO Links: Profile News Message Board | |
| Charts:- Daily , Weekly | |
| Add AKRO to Watchlist: View: Get Complete AKRO Trend Analysis ➞ | |
 | TWST Twist Bioscience Corporation |
| Sector: Health Care | |
| SubSector: Medical Laboratories & Research | |
| MarketCap: 1065 Millions | |
| Recent Price: 28.36 Smart Investing & Trading Score: 10 | |
| Day Percent Change: -0.74% Day Change: -0.21 | |
| Week Change: -7.56% Year-to-date Change: -23.1% | |
| TWST Links: Profile News Message Board | |
| Charts:- Daily , Weekly | |
| Add TWST to Watchlist: View: Get Complete TWST Trend Analysis ➞ | |
 | MASS 908 Devices Inc. |
| Sector: Health Care | |
| SubSector: Medical Devices | |
| MarketCap: 225 Millions | |
| Recent Price: 5.61 Smart Investing & Trading Score: 17 | |
| Day Percent Change: 0.36% Day Change: 0.02 | |
| Week Change: -7.58% Year-to-date Change: -49.9% | |
| MASS Links: Profile News Message Board | |
| Charts:- Daily , Weekly | |
| Add MASS to Watchlist: View: Get Complete MASS Trend Analysis ➞ | |
 | AKTS Akoustis Technologies, Inc. |
| Sector: Technology | |
| SubSector: Communication Equipment | |
| MarketCap: 197.039 Millions | |
| Recent Price: 0.53 Smart Investing & Trading Score: 47 | |
| Day Percent Change: 4.91% Day Change: 0.02 | |
| Week Change: -7.59% Year-to-date Change: -36.5% | |
| AKTS Links: Profile News Message Board | |
| Charts:- Daily , Weekly | |
| Add AKTS to Watchlist: View: Get Complete AKTS Trend Analysis ➞ | |
 | HQI HireQuest, Inc. |
| Sector: Services & Goods | |
| SubSector: Staffing & Outsourcing Services | |
| MarketCap: 77 Millions | |
| Recent Price: 11.94 Smart Investing & Trading Score: 10 | |
| Day Percent Change: -1.40% Day Change: -0.17 | |
| Week Change: -7.59% Year-to-date Change: -22.2% | |
| HQI Links: Profile News Message Board | |
| Charts:- Daily , Weekly | |
| Add HQI to Watchlist: View: Get Complete HQI Trend Analysis ➞ | |
 | IRBT iRobot Corporation |
| Sector: Consumer Staples | |
| SubSector: Appliances | |
| MarketCap: 1193.38 Millions | |
| Recent Price: 7.25 Smart Investing & Trading Score: 10 | |
| Day Percent Change: 3.13% Day Change: 0.22 | |
| Week Change: -7.64% Year-to-date Change: -81.3% | |
| IRBT Links: Profile News Message Board | |
| Charts:- Daily , Weekly | |
| Add IRBT to Watchlist: View: Get Complete IRBT Trend Analysis ➞ | |
 | NVTS Navitas Semiconductor Corporation |
| Sector: Technology | |
| SubSector: Semiconductors | |
| MarketCap: 1790 Millions | |
| Recent Price: 3.99 Smart Investing & Trading Score: 17 | |
| Day Percent Change: 2.31% Day Change: 0.09 | |
| Week Change: -7.64% Year-to-date Change: -50.9% | |
| NVTS Links: Profile News Message Board | |
| Charts:- Daily , Weekly | |
| Add NVTS to Watchlist: View: Get Complete NVTS Trend Analysis ➞ | |
 | LCTX Lineage Cell Therapeutics, Inc. |
| Sector: Health Care | |
| SubSector: Biotechnology | |
| MarketCap: 141.285 Millions | |
| Recent Price: 1.20 Smart Investing & Trading Score: 36 | |
| Day Percent Change: -6.98% Day Change: -0.09 | |
| Week Change: -7.69% Year-to-date Change: 10.1% | |
| LCTX Links: Profile News Message Board | |
| Charts:- Daily , Weekly | |
| Add LCTX to Watchlist: View: Get Complete LCTX Trend Analysis ➞ | |
 | SHO Sunstone Hotel Investors, Inc. |
| Sector: Financials | |
| SubSector: REIT - Hotel/Motel | |
| MarketCap: 1861.04 Millions | |
| Recent Price: 10.06 Smart Investing & Trading Score: 0 | |
| Day Percent Change: -0.59% Day Change: -0.06 | |
| Week Change: -7.71% Year-to-date Change: -6.2% | |
| SHO Links: Profile News Message Board | |
| Charts:- Daily , Weekly | |
| Add SHO to Watchlist: View: Get Complete SHO Trend Analysis ➞ | |
 | EGHT 8x8, Inc. |
| Sector: Technology | |
| SubSector: Diversified Communication Services | |
| MarketCap: 1861.64 Millions | |
| Recent Price: 2.15 Smart Investing & Trading Score: 10 | |
| Day Percent Change: -3.59% Day Change: -0.08 | |
| Week Change: -7.73% Year-to-date Change: -43.1% | |
| EGHT Links: Profile News Message Board | |
| Charts:- Daily , Weekly | |
| Add EGHT to Watchlist: View: Get Complete EGHT Trend Analysis ➞ | |
 | SLRN Acelyrin, Inc. |
| Sector: Health Care | |
| SubSector: Biotechnology | |
| MarketCap: 2030 Millions | |
| Recent Price: 4.96 Smart Investing & Trading Score: 20 | |
| Day Percent Change: -1.29% Day Change: -0.06 | |
| Week Change: -7.73% Year-to-date Change: -32.8% | |
| SLRN Links: Profile News Message Board | |
| Charts:- Daily , Weekly | |
| Add SLRN to Watchlist: View: Get Complete SLRN Trend Analysis ➞ | |
 | BW Babcock & Wilcox Enterprises, Inc. |
| Sector: Industrials | |
| SubSector: Industrial Electrical Equipment | |
| MarketCap: 59.0879 Millions | |
| Recent Price: 0.97 Smart Investing & Trading Score: 10 | |
| Day Percent Change: -3.16% Day Change: -0.03 | |
| Week Change: -7.77% Year-to-date Change: -33.7% | |
| BW Links: Profile News Message Board | |
| Charts:- Daily , Weekly | |
| Add BW to Watchlist: View: Get Complete BW Trend Analysis ➞ | |
 | TDUP ThredUp Inc. |
| Sector: Services & Goods | |
| SubSector: Internet Retail | |
| MarketCap: 258 Millions | |
| Recent Price: 1.54 Smart Investing & Trading Score: 17 | |
| Day Percent Change: 0.65% Day Change: 0.01 | |
| Week Change: -7.78% Year-to-date Change: -31.9% | |
| TDUP Links: Profile News Message Board | |
| Charts:- Daily , Weekly | |
| Add TDUP to Watchlist: View: Get Complete TDUP Trend Analysis ➞ | |
 | AOSL Alpha and Omega Semiconductor Limited |
| Sector: Technology | |
| SubSector: Semiconductor - Specialized | |
| MarketCap: 158.66 Millions | |
| Recent Price: 20.02 Smart Investing & Trading Score: 10 | |
| Day Percent Change: -3.10% Day Change: -0.64 | |
| Week Change: -7.83% Year-to-date Change: -23.2% | |
| AOSL Links: Profile News Message Board | |
| Charts:- Daily , Weekly | |
| Add AOSL to Watchlist: View: Get Complete AOSL Trend Analysis ➞ | |
 | RPD Rapid7, Inc. |
| Sector: Technology | |
| SubSector: Application Software | |
| MarketCap: 1981.12 Millions | |
| Recent Price: 44.15 Smart Investing & Trading Score: 0 | |
| Day Percent Change: 0.80% Day Change: 0.35 | |
| Week Change: -7.83% Year-to-date Change: -22.7% | |
| RPD Links: Profile News Message Board | |
| Charts:- Daily , Weekly | |
| Add RPD to Watchlist: View: Get Complete RPD Trend Analysis ➞ | |
 | OPI Office Properties Income Trust |
| Sector: Financials | |
| SubSector: REIT - Office | |
| MarketCap: 1245.66 Millions | |
| Recent Price: 1.88 Smart Investing & Trading Score: 20 | |
| Day Percent Change: -0.53% Day Change: -0.01 | |
| Week Change: -7.84% Year-to-date Change: -74.3% | |
| OPI Links: Profile News Message Board | |
| Charts:- Daily , Weekly | |
| Add OPI to Watchlist: View: Get Complete OPI Trend Analysis ➞ | |
 | ROAD Construction Partners, Inc. |
| Sector: Industrials | |
| SubSector: Heavy Construction | |
| MarketCap: 903.095 Millions | |
| Recent Price: 51.31 Smart Investing & Trading Score: 26 | |
| Day Percent Change: -3.08% Day Change: -1.63 | |
| Week Change: -7.9% Year-to-date Change: 17.9% | |
| ROAD Links: Profile News Message Board | |
| Charts:- Daily , Weekly | |
| Add ROAD to Watchlist: View: Get Complete ROAD Trend Analysis ➞ | |
 | ERII Energy Recovery, Inc. |
| Sector: Industrials | |
| SubSector: Pollution & Treatment Controls | |
| MarketCap: 429.375 Millions | |
| Recent Price: 13.63 Smart Investing & Trading Score: 20 | |
| Day Percent Change: 0.74% Day Change: 0.10 | |
| Week Change: -7.91% Year-to-date Change: -27.7% | |
| ERII Links: Profile News Message Board | |
| Charts:- Daily , Weekly | |
| Add ERII to Watchlist: View: Get Complete ERII Trend Analysis ➞ | |
 | FOLD Amicus Therapeutics, Inc. |
| Sector: Health Care | |
| SubSector: Biotechnology | |
| MarketCap: 2676.75 Millions | |
| Recent Price: 10.33 Smart Investing & Trading Score: 0 | |
| Day Percent Change: -2.09% Day Change: -0.22 | |
| Week Change: -7.93% Year-to-date Change: -27.2% | |
| FOLD Links: Profile News Message Board | |
| Charts:- Daily , Weekly | |
| Add FOLD to Watchlist: View: Get Complete FOLD Trend Analysis ➞ | |
 | NOVT Novanta Inc. |
| Sector: Technology | |
| SubSector: Scientific & Technical Instruments | |
| MarketCap: 2680.83 Millions | |
| Recent Price: 150.02 Smart Investing & Trading Score: 0 | |
| Day Percent Change: -2.90% Day Change: -4.48 | |
| Week Change: -7.96% Year-to-date Change: -10.9% | |
| NOVT Links: Profile News Message Board | |
| Charts:- Daily , Weekly | |
| Add NOVT to Watchlist: View: Get Complete NOVT Trend Analysis ➞ | |
 | SDGR Schrodinger, Inc. |
| Sector: Health Care | |
| SubSector: Health Information Services | |
| MarketCap: 47287 Millions | |
| Recent Price: 24.34 Smart Investing & Trading Score: 0 | |
| Day Percent Change: -2.80% Day Change: -0.70 | |
| Week Change: -7.98% Year-to-date Change: -32.0% | |
| SDGR Links: Profile News Message Board | |
| Charts:- Daily , Weekly | |
| Add SDGR to Watchlist: View: Get Complete SDGR Trend Analysis ➞ | |
| Too many stocks? View smallcap stocks filtered by marketcap & sector |
| Marketcap: All SmallCap Stocks (default-no microcap), Large, Mid-Range, Small & MicroCap |
| Sector: Tech, Finance, Energy, Staples, Retail, Industrial, Materials, Utilities & Medical |
|
Best Stocks Today 12Stocks.com |
© 2024 12Stocks.com Terms & Conditions Privacy Contact Us
All Information Provided Only For Education And Not To Be Used For Investing or Trading. See Terms & Conditions


One More Thing ... Get Best Stocks Delivered Daily!
Never Ever Miss A Move With Our Top Ten Stocks Lists
Find Best Stocks In Any Market - Bull or Bear Market
Take A Peek At Our Top Ten Stocks Lists: Daily, Weekly, Year-to-Date & Top Trends
Find Best Stocks In Any Market - Bull or Bear Market
Take A Peek At Our Top Ten Stocks Lists: Daily, Weekly, Year-to-Date & Top Trends
Smallcap Stocks With Best Up Trends [0-bearish to 100-bullish]: Badger Meter[100], Cullinan Oncology[100], Oscar Health[100], NextNav [100], EchoStar [100], Victory Capital[100], Macatawa Bank[100], IMAX [100], Envestnet [100], ALX Oncology[100], Argan [95]
Best Smallcap Stocks Year-to-Date:
Agenus [500.31%], CareMax [417.53%], Janux [348.12%], Viking [247.5%], Alpine Immune[238.5%], Super Micro[226.63%], Longboard [194.76%], Arcutis Bio[192.57%], Vera [161.3%], Avidity Biosciences[154.87%], Hippo [128.32%] Best Smallcap Stocks This Week:
Macatawa Bank[44.42%], 23andMe Holding[33.3%], ProKidney [32%], Snap One[29.73%], Vertex Energy[25.96%], ALX Oncology[20.64%], Vanda [20.63%], Expensify [18.37%], Badger Meter[16.72%], ContextLogic [15%], Cullinan Oncology[13.89%] Best Smallcap Stocks Daily:
23andMe Holding[65.91%], Vertex Energy[33.78%], Zura Bio[17.20%], Badger Meter[16.65%], ContextLogic [15.81%], Expensify [15.23%], Montrose Environmental[12.84%], Vaxxinity [10.05%], Cipher Mining[8.65%], FiscalNote [8.61%], Vuzix [8.15%]