
 Login Sign Up


| |||||
 |  | ||||

| 12Stocks.com Market Intelligence |
Best SmallCap Stocks
|
| In a hurry? Small Cap Stock Lists: Performance Trends Table, Stock Charts
Sort Small Cap stocks: Daily, Weekly, Year-to-Date, Market Cap & Trends. Filter Small Cap stocks list by sector: Show all, Tech, Finance, Energy, Staples, Retail, Industrial, Materials, Utilities and HealthCare Filter Small Cap stocks list by size: All Large Medium Small and MicroCap |
| 12Stocks.com Small Cap Stocks Performances & Trends Daily | |||||||||
|
|  The overall Smart Investing & Trading Score is 43 (0-bearish to 100-bullish) which puts Small Cap index in short term neutral trend. The Smart Investing & Trading Score from previous trading session is 26 and hence an improvement of trend.
| ||||||||
Here are the Smart Investing & Trading Scores of the most requested small cap stocks at 12Stocks.com (click stock name for detailed review):
|


| 12Stocks.com: Investing in Smallcap Index with Stocks | |
|
The following table helps investors and traders sort through current performance and trends (as measured by Smart Investing & Trading Score) of various
stocks in the Smallcap Index. Quick View: Move mouse or cursor over stock symbol (ticker) to view short-term technical chart and over stock name to view long term chart. Click on  to add stock symbol to your watchlist and to add stock symbol to your watchlist and  to view watchlist. Click on any ticker or stock name for detailed market intelligence report for that stock. to view watchlist. Click on any ticker or stock name for detailed market intelligence report for that stock. |
12Stocks.com Performance of Stocks in Smallcap Index
| Ticker | Stock Name | Watchlist | Category | Recent Price | Smart Investing & Trading Score | Change % | Weekly Change% |
| PROK | ProKidney |   | Health Care | 2.83 | 100 | 4.04% | 61.71% |
| MCBC | Macatawa Bank | | Financials | 13.68 | 100 | 0.07% | 42.65% |
| SNPO | Snap One | | Technology | 10.57 | 93 | 0.28% | 29.85% |
| VNDA | Vanda | | Health Care | 5.23 | 100 | 29.14% | 26.94% |
| ALXO | ALX Oncology | | Health Care | 16.08 | 100 | 10.97% | 23.41% |
| ITCI | Intra-Cellular Therapies | | Health Care | 76.68 | 100 | -3.96% | 16.39% |
| ESCA | Escalade | | Consumer Staples | 14.68 | 57 | -1.14% | 13.71% |
| KPTI | Karyopharm | | Health Care | 1.38 | 68 | 25.00% | 12.70% |
| WIRE | Encore Wire | | Technology | 287.32 | 93 | -0.82% | 10.09% |
| ZUO | Zuora | | Technology | 9.46 | 29 | 11.69% | 10.00% |
| HUMA | Humacyte | | Health Care | 3.13 | 69 | 2.29% | 8.68% |
| ENV | Envestnet | | Services & Goods | 62.20 | 100 | 0.65% | 8.55% |
| ESSA | ESSA Bancorp | | Financials | 17.18 | 52 | 2.20% | 8.19% |
| LUNA | Luna Innovations | | Technology | 2.81 | 42 | 6.44% | 8.08% |
| DAWN | Day One | | Health Care | 14.87 | 37 | 1.78% | 7.99% |
| CUTR | Cutera | | Health Care | 2.38 | 49 | 18.16% | 7.47% |
| PLCE | Children s | | Services & Goods | 8.31 | 42 | 16.88% | 7.09% |
| DSGN | Design | | Health Care | 3.95 | 80 | 7.05% | 7.05% |
| CGEM | Cullinan Oncology | | Health Care | 17.84 | 100 | 3.00% | 7.02% |
| SMCI | Super Micro | | Technology | 960.19 | 75 | -1.65% | 6.87% |
| WINA | Winmark | | Services & Goods | 367.22 | 62 | 4.13% | 6.87% |
| CVGW | Calavo Growers | | Consumer Staples | 26.03 | 37 | 3.50% | 6.51% |
| CENX | Century Aluminum | | Materials | 17.52 | 90 | 0.11% | 6.31% |
| ACCD | Accolade | | Health Care | 8.72 | 42 | 3.81% | 5.70% |
| TELA | TELA Bio | | Health Care | 5.19 | 17 | 4.43% | 5.49% |


| Too many stocks? View smallcap stocks filtered by marketcap & sector |
| Marketcap: All SmallCap Stocks (default-no microcap), Large, Mid-Range, Small |
| Smallcap Sector: Tech, Finance, Energy, Staples, Retail, Industrial, Materials, & Medical |
|
Get the most comprehensive stock market coverage daily at 12Stocks.com ➞ Best Stocks Today ➞ Best Stocks Weekly ➞ Best Stocks Year-to-Date ➞ Best Stocks Trends ➞  Best Stocks Today 12Stocks.com Best Nasdaq Stocks ➞ Best S&P 500 Stocks ➞ Best Tech Stocks ➞ Best Biotech Stocks ➞ |
| Detailed Overview of SmallCap Stocks |
| SmallCap Technical Overview, Leaders & Laggards, Top SmallCap ETF Funds & Detailed SmallCap Stocks List, Charts, Trends & More |
| Smallcap: Technical Analysis, Trends & YTD Performance | |
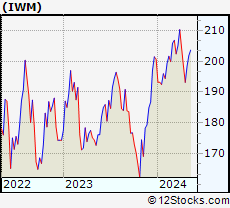
| SmallCap segment as represented by
IWM, an exchange-traded fund [ETF], holds basket of thousands of smallcap stocks from across all major sectors of the US stock market. The smallcap index (contains stocks like Riverbed & Sotheby's) is down by -3.84% and is currently underperforming the overall market by -8.25% year-to-date. Below is a quick view of technical charts and trends: | |
 IWM Weekly Chart |
|
| Long Term Trend: Good | |
| Medium Term Trend: Not Good | |
 IWM Daily Chart |
|
| Short Term Trend: Not Good | |
| Overall Trend Score: 43 | |
| YTD Performance: -3.84% | |
| **Trend Scores & Views Are Only For Educational Purposes And Not For Investing | |
| 12Stocks.com: Top Performing Small Cap Index Stocks | ||||||||||||||||||||||||||||||||||||||||||||||||
 The top performing Small Cap Index stocks year to date are
Now, more recently, over last week, the top performing Small Cap Index stocks on the move are


|
||||||||||||||||||||||||||||||||||||||||||||||||
| 12Stocks.com: Investing in Smallcap Index using Exchange Traded Funds | |
|
The following table shows list of key exchange traded funds (ETF) that
help investors track Smallcap index. The following list also includes leveraged ETF funds that track twice or thrice the daily returns of Smallcap indices. Short or inverse ETF funds move in the opposite direction to the index they track and are useful during market pullbacks or during bear markets. Quick View: Move mouse or cursor over ETF symbol (ticker) to view short-term technical chart and over ETF name to view long term chart. Click on ticker or stock name for detailed view. Click on to add stock symbol to your watchlist and to view watchlist. |
12Stocks.com List of ETFs that track Smallcap Index
| Ticker | ETF Name | Watchlist | Recent Price | Smart Investing & Trading Score | Change % | Week % | Year-to-date % |
| IWM | iShares Russell 2000 | | 193.00 | 43 | -1.06 | -2.86 | -3.84% |
| VTWO | Vanguard Russell 2000 ETF | | 78.77 | 36 | -0.13 | -1.93 | -2.87% |
| IJR | iShares Core S&P Small-Cap | | 102.94 | 17 | 0.21 | -1.5 | -4.91% |
| IWN | iShares Russell 2000 Value | | 147.37 | 30 | 0.14 | -2 | -5.12% |
| IWO | iShares Russell 2000 Growth | | 250.93 | 43 | 0.27 | -1.73 | -0.51% |
| IJS | iShares S&P Small-Cap 600 Value | | 94.92 | 17 | 0.27 | -1.3 | -7.91% |
| IJT | iShares S&P Small-Cap 600 Growth | | 122.69 | 41 | -0.33 | -1.67 | -1.96% |
| XSLV | PowerShares S&P SmallCap Low Volatil ETF | | 41.58 | 17 | 0.00 | -1.21 | -5.82% |
| SAA | ProShares Ultra SmallCap600 | | 21.66 | 17 | -1.19 | -3.99 | -13.19% |
| SMLV | SPDR SSGA US Small Cap Low Volatil ETF | | 103.66 | 25 | -0.17 | -1.29 | -7.87% |
| SBB | ProShares Short SmallCap600 | | 16.85 | 73 | 0.42 | 1.83 | 5.78% |
| SDD | ProShares UltraShort SmallCap600 | | 20.60 | 73 | 1.23 | 3.88 | 11.8% |
| 12Stocks.com: Charts, Trends, Fundamental Data and Performances of SmallCap Stocks | |
|
We now take in-depth look at all SmallCap stocks including charts, multi-period performances and overall trends (as measured by Smart Investing & Trading Score). One can sort SmallCap stocks (click link to choose) by Daily, Weekly and by Year-to-Date performances. Also, one can sort by size of the company or by market capitalization. |
| Select Your Default Chart Type: | |||||
| |||||
| Click on stock symbol or name for detailed view. Click on to add stock symbol to your watchlist and to view watchlist. Quick View: Move mouse or cursor over "Daily" to quickly view daily technical stock chart and over "Weekly" to view weekly technical stock chart. | |||||

 | PROK ProKidney Corp. |
| Sector: Health Care | |
| SubSector: Biotechnology | |
| MarketCap: 2470 Millions | |
| Recent Price: 2.83 Smart Investing & Trading Score: 100 | |
| Day Percent Change: 4.04% Day Change: 0.11 | |
| Week Change: 61.71% Year-to-date Change: 62.2% | |
| PROK Links: Profile News Message Board | |
| Charts:- Daily , Weekly | |
| Add PROK to Watchlist: View: Get Complete PROK Trend Analysis ➞ | |
 | MCBC Macatawa Bank Corporation |
| Sector: Financials | |
| SubSector: Regional - Midwest Banks | |
| MarketCap: 264.37 Millions | |
| Recent Price: 13.68 Smart Investing & Trading Score: 100 | |
| Day Percent Change: 0.07% Day Change: 0.01 | |
| Week Change: 42.65% Year-to-date Change: 21.3% | |
| MCBC Links: Profile News Message Board | |
| Charts:- Daily , Weekly | |
| Add MCBC to Watchlist: View: Get Complete MCBC Trend Analysis ➞ | |
 | SNPO Snap One Holdings Corp. |
| Sector: Technology | |
| SubSector: Electronics & Computer Distribution | |
| MarketCap: 807 Millions | |
| Recent Price: 10.57 Smart Investing & Trading Score: 93 | |
| Day Percent Change: 0.28% Day Change: 0.03 | |
| Week Change: 29.85% Year-to-date Change: 13.8% | |
| SNPO Links: Profile News Message Board | |
| Charts:- Daily , Weekly | |
| Add SNPO to Watchlist: View: Get Complete SNPO Trend Analysis ➞ | |
 | VNDA Vanda Pharmaceuticals Inc. |
| Sector: Health Care | |
| SubSector: Biotechnology | |
| MarketCap: 464.585 Millions | |
| Recent Price: 5.23 Smart Investing & Trading Score: 100 | |
| Day Percent Change: 29.14% Day Change: 1.18 | |
| Week Change: 26.94% Year-to-date Change: 23.9% | |
| VNDA Links: Profile News Message Board | |
| Charts:- Daily , Weekly | |
| Add VNDA to Watchlist: View: Get Complete VNDA Trend Analysis ➞ | |
 | ALXO ALX Oncology Holdings Inc. |
| Sector: Health Care | |
| SubSector: Biotechnology | |
| MarketCap: 41787 Millions | |
| Recent Price: 16.08 Smart Investing & Trading Score: 100 | |
| Day Percent Change: 10.97% Day Change: 1.59 | |
| Week Change: 23.41% Year-to-date Change: 8.1% | |
| ALXO Links: Profile News Message Board | |
| Charts:- Daily , Weekly | |
| Add ALXO to Watchlist: View: Get Complete ALXO Trend Analysis ➞ | |
 | ITCI Intra-Cellular Therapies, Inc. |
| Sector: Health Care | |
| SubSector: Biotechnology | |
| MarketCap: 991.885 Millions | |
| Recent Price: 76.68 Smart Investing & Trading Score: 100 | |
| Day Percent Change: -3.96% Day Change: -3.16 | |
| Week Change: 16.39% Year-to-date Change: 7.1% | |
| ITCI Links: Profile News Message Board | |
| Charts:- Daily , Weekly | |
| Add ITCI to Watchlist: View: Get Complete ITCI Trend Analysis ➞ | |
 | ESCA Escalade, Incorporated |
| Sector: Consumer Staples | |
| SubSector: Sporting Goods | |
| MarketCap: 87.8144 Millions | |
| Recent Price: 14.68 Smart Investing & Trading Score: 57 | |
| Day Percent Change: -1.14% Day Change: -0.17 | |
| Week Change: 13.71% Year-to-date Change: -26.9% | |
| ESCA Links: Profile News Message Board | |
| Charts:- Daily , Weekly | |
| Add ESCA to Watchlist: View: Get Complete ESCA Trend Analysis ➞ | |
 | KPTI Karyopharm Therapeutics Inc. |
| Sector: Health Care | |
| SubSector: Biotechnology | |
| MarketCap: 1471.85 Millions | |
| Recent Price: 1.38 Smart Investing & Trading Score: 68 | |
| Day Percent Change: 25.00% Day Change: 0.27 | |
| Week Change: 12.7% Year-to-date Change: 59.0% | |
| KPTI Links: Profile News Message Board | |
| Charts:- Daily , Weekly | |
| Add KPTI to Watchlist: View: Get Complete KPTI Trend Analysis ➞ | |
 | WIRE Encore Wire Corporation |
| Sector: Technology | |
| SubSector: Diversified Electronics | |
| MarketCap: 898.896 Millions | |
| Recent Price: 287.32 Smart Investing & Trading Score: 93 | |
| Day Percent Change: -0.82% Day Change: -2.38 | |
| Week Change: 10.09% Year-to-date Change: 34.5% | |
| WIRE Links: Profile News Message Board | |
| Charts:- Daily , Weekly | |
| Add WIRE to Watchlist: View: Get Complete WIRE Trend Analysis ➞ | |
 | ZUO Zuora, Inc. |
| Sector: Technology | |
| SubSector: Application Software | |
| MarketCap: 1063.22 Millions | |
| Recent Price: 9.46 Smart Investing & Trading Score: 29 | |
| Day Percent Change: 11.69% Day Change: 0.99 | |
| Week Change: 10% Year-to-date Change: 0.6% | |
| ZUO Links: Profile News Message Board | |
| Charts:- Daily , Weekly | |
| Add ZUO to Watchlist: View: Get Complete ZUO Trend Analysis ➞ | |
 | HUMA Humacyte, Inc. |
| Sector: Health Care | |
| SubSector: Biotechnology | |
| MarketCap: 297 Millions | |
| Recent Price: 3.13 Smart Investing & Trading Score: 69 | |
| Day Percent Change: 2.29% Day Change: 0.07 | |
| Week Change: 8.68% Year-to-date Change: 10.2% | |
| HUMA Links: Profile News Message Board | |
| Charts:- Daily , Weekly | |
| Add HUMA to Watchlist: View: Get Complete HUMA Trend Analysis ➞ | |
 | ENV Envestnet, Inc. |
| Sector: Services & Goods | |
| SubSector: Business Services | |
| MarketCap: 3114.02 Millions | |
| Recent Price: 62.20 Smart Investing & Trading Score: 100 | |
| Day Percent Change: 0.65% Day Change: 0.40 | |
| Week Change: 8.55% Year-to-date Change: 25.6% | |
| ENV Links: Profile News Message Board | |
| Charts:- Daily , Weekly | |
| Add ENV to Watchlist: View: Get Complete ENV Trend Analysis ➞ | |
 | ESSA ESSA Bancorp, Inc. |
| Sector: Financials | |
| SubSector: Savings & Loans | |
| MarketCap: 171.33 Millions | |
| Recent Price: 17.18 Smart Investing & Trading Score: 52 | |
| Day Percent Change: 2.20% Day Change: 0.37 | |
| Week Change: 8.19% Year-to-date Change: -14.2% | |
| ESSA Links: Profile News Message Board | |
| Charts:- Daily , Weekly | |
| Add ESSA to Watchlist: View: Get Complete ESSA Trend Analysis ➞ | |
 | LUNA Luna Innovations Incorporated |
| Sector: Technology | |
| SubSector: Scientific & Technical Instruments | |
| MarketCap: 166.353 Millions | |
| Recent Price: 2.81 Smart Investing & Trading Score: 42 | |
| Day Percent Change: 6.44% Day Change: 0.17 | |
| Week Change: 8.08% Year-to-date Change: -57.7% | |
| LUNA Links: Profile News Message Board | |
| Charts:- Daily , Weekly | |
| Add LUNA to Watchlist: View: Get Complete LUNA Trend Analysis ➞ | |
 | DAWN Day One Biopharmaceuticals, Inc. |
| Sector: Health Care | |
| SubSector: Biotechnology | |
| MarketCap: 1040 Millions | |
| Recent Price: 14.87 Smart Investing & Trading Score: 37 | |
| Day Percent Change: 1.78% Day Change: 0.26 | |
| Week Change: 7.99% Year-to-date Change: 1.2% | |
| DAWN Links: Profile News Message Board | |
| Charts:- Daily , Weekly | |
| Add DAWN to Watchlist: View: Get Complete DAWN Trend Analysis ➞ | |
 | CUTR Cutera, Inc. |
| Sector: Health Care | |
| SubSector: Medical Appliances & Equipment | |
| MarketCap: 143.68 Millions | |
| Recent Price: 2.38 Smart Investing & Trading Score: 49 | |
| Day Percent Change: 18.16% Day Change: 0.37 | |
| Week Change: 7.47% Year-to-date Change: -32.6% | |
| CUTR Links: Profile News Message Board | |
| Charts:- Daily , Weekly | |
| Add CUTR to Watchlist: View: Get Complete CUTR Trend Analysis ➞ | |
 | PLCE The Children s Place, Inc. |
| Sector: Services & Goods | |
| SubSector: Apparel Stores | |
| MarketCap: 303.608 Millions | |
| Recent Price: 8.31 Smart Investing & Trading Score: 42 | |
| Day Percent Change: 16.88% Day Change: 1.20 | |
| Week Change: 7.09% Year-to-date Change: -64.2% | |
| PLCE Links: Profile News Message Board | |
| Charts:- Daily , Weekly | |
| Add PLCE to Watchlist: View: Get Complete PLCE Trend Analysis ➞ | |
 | DSGN Design Therapeutics, Inc. |
| Sector: Health Care | |
| SubSector: Biotechnology | |
| MarketCap: 367 Millions | |
| Recent Price: 3.95 Smart Investing & Trading Score: 80 | |
| Day Percent Change: 7.05% Day Change: 0.26 | |
| Week Change: 7.05% Year-to-date Change: 48.8% | |
| DSGN Links: Profile News Message Board | |
| Charts:- Daily , Weekly | |
| Add DSGN to Watchlist: View: Get Complete DSGN Trend Analysis ➞ | |
 | CGEM Cullinan Oncology, Inc. |
| Sector: Health Care | |
| SubSector: Biotechnology | |
| MarketCap: 433 Millions | |
| Recent Price: 17.84 Smart Investing & Trading Score: 100 | |
| Day Percent Change: 3.00% Day Change: 0.52 | |
| Week Change: 7.02% Year-to-date Change: 75.0% | |
| CGEM Links: Profile News Message Board | |
| Charts:- Daily , Weekly | |
| Add CGEM to Watchlist: View: Get Complete CGEM Trend Analysis ➞ | |
 | SMCI Super Micro Computer, Inc. |
| Sector: Technology | |
| SubSector: Networking & Communication Devices | |
| MarketCap: 1200.02 Millions | |
| Recent Price: 960.19 Smart Investing & Trading Score: 75 | |
| Day Percent Change: -1.65% Day Change: -16.11 | |
| Week Change: 6.87% Year-to-date Change: 237.8% | |
| SMCI Links: Profile News Message Board | |
| Charts:- Daily , Weekly | |
| Add SMCI to Watchlist: View: Get Complete SMCI Trend Analysis ➞ | |
 | WINA Winmark Corporation |
| Sector: Services & Goods | |
| SubSector: Specialty Retail, Other | |
| MarketCap: 520.444 Millions | |
| Recent Price: 367.22 Smart Investing & Trading Score: 62 | |
| Day Percent Change: 4.13% Day Change: 14.55 | |
| Week Change: 6.87% Year-to-date Change: -12.1% | |
| WINA Links: Profile News Message Board | |
| Charts:- Daily , Weekly | |
| Add WINA to Watchlist: View: Get Complete WINA Trend Analysis ➞ | |
 | CVGW Calavo Growers, Inc. |
| Sector: Consumer Staples | |
| SubSector: Farm Products | |
| MarketCap: 935.287 Millions | |
| Recent Price: 26.03 Smart Investing & Trading Score: 37 | |
| Day Percent Change: 3.50% Day Change: 0.88 | |
| Week Change: 6.51% Year-to-date Change: -11.5% | |
| CVGW Links: Profile News Message Board | |
| Charts:- Daily , Weekly | |
| Add CVGW to Watchlist: View: Get Complete CVGW Trend Analysis ➞ | |
 | CENX Century Aluminum Company |
| Sector: Materials | |
| SubSector: Aluminum | |
| MarketCap: 266.408 Millions | |
| Recent Price: 17.52 Smart Investing & Trading Score: 90 | |
| Day Percent Change: 0.11% Day Change: 0.02 | |
| Week Change: 6.31% Year-to-date Change: 44.3% | |
| CENX Links: Profile News Message Board | |
| Charts:- Daily , Weekly | |
| Add CENX to Watchlist: View: Get Complete CENX Trend Analysis ➞ | |
 | ACCD Accolade, Inc. |
| Sector: Health Care | |
| SubSector: Health Information Services | |
| MarketCap: 32987 Millions | |
| Recent Price: 8.72 Smart Investing & Trading Score: 42 | |
| Day Percent Change: 3.81% Day Change: 0.32 | |
| Week Change: 5.7% Year-to-date Change: -27.5% | |
| ACCD Links: Profile News Message Board | |
| Charts:- Daily , Weekly | |
| Add ACCD to Watchlist: View: Get Complete ACCD Trend Analysis ➞ | |
 | TELA TELA Bio, Inc. |
| Sector: Health Care | |
| SubSector: Medical Appliances & Equipment | |
| MarketCap: 81.808 Millions | |
| Recent Price: 5.19 Smart Investing & Trading Score: 17 | |
| Day Percent Change: 4.43% Day Change: 0.22 | |
| Week Change: 5.49% Year-to-date Change: -21.6% | |
| TELA Links: Profile News Message Board | |
| Charts:- Daily , Weekly | |
| Add TELA to Watchlist: View: Get Complete TELA Trend Analysis ➞ | |
| Too many stocks? View smallcap stocks filtered by marketcap & sector |
| Marketcap: All SmallCap Stocks (default-no microcap), Large, Mid-Range, Small & MicroCap |
| Sector: Tech, Finance, Energy, Staples, Retail, Industrial, Materials, Utilities & Medical |
|
Best Stocks Today 12Stocks.com |
© 2024 12Stocks.com Terms & Conditions Privacy Contact Us
All Information Provided Only For Education And Not To Be Used For Investing or Trading. See Terms & Conditions


One More Thing ... Get Best Stocks Delivered Daily!
Never Ever Miss A Move With Our Top Ten Stocks Lists
Find Best Stocks In Any Market - Bull or Bear Market
Take A Peek At Our Top Ten Stocks Lists: Daily, Weekly, Year-to-Date & Top Trends
Find Best Stocks In Any Market - Bull or Bear Market
Take A Peek At Our Top Ten Stocks Lists: Daily, Weekly, Year-to-Date & Top Trends
Smallcap Stocks With Best Up Trends [0-bearish to 100-bullish]: Vanda [100], ALX Oncology[100], Reneo [100], ProKidney [100], Cullinan Oncology[100], IMAX [100], Envestnet [100], Macatawa Bank[100], Oscar Health[100], Argan [100], NextNav [100]
Best Smallcap Stocks Year-to-Date:
Agenus [550.44%], CareMax [416.49%], Janux [346.07%], Viking [265.5%], Alpine Immune[238.58%], Super Micro[237.79%], Arcutis Bio[216.72%], Longboard [177.91%], Avidity Biosciences[160.56%], Vera [158.46%], Stoke [123.38%] Best Smallcap Stocks This Week:
ProKidney [61.71%], Macatawa Bank[42.65%], Snap One[29.85%], Vanda [26.94%], ALX Oncology[23.41%], Intra-Cellular Therapies[16.39%], Escalade [13.71%], Karyopharm [12.7%], Encore Wire[10.09%], Zuora [10%], Direxion Daily[8.81%] Best Smallcap Stocks Daily:
Vanda [29.14%], Karyopharm [25.00%], Cutera [18.16%], Children s[16.88%], WW [14.42%], Lineage Cell[12.17%], Zuora [11.69%], ALX Oncology[10.97%], Citius [10.30%], Acrivon [9.19%], Cue Biopharma[9.03%]