
 Login Sign Up


| |||||
 |  | ||||

| 12Stocks.com Market Intelligence |
Best SmallCap Stocks
|
| In a hurry? Small Cap Stock Lists: Performance Trends Table, Stock Charts
Sort Small Cap stocks: Daily, Weekly, Year-to-Date, Market Cap & Trends. Filter Small Cap stocks list by sector: Show all, Tech, Finance, Energy, Staples, Retail, Industrial, Materials, Utilities and HealthCare Filter Small Cap stocks list by size: All Large Medium Small and MicroCap |
| 12Stocks.com Small Cap Stocks Performances & Trends Daily | |||||||||
|
|  The overall Smart Investing & Trading Score is 23 (0-bearish to 100-bullish) which puts Small Cap index in short term bearish to neutral trend. The Smart Investing & Trading Score from previous trading session is 13 and hence an improvement of trend.
| ||||||||
Here are the Smart Investing & Trading Scores of the most requested small cap stocks at 12Stocks.com (click stock name for detailed review):
|


| 12Stocks.com: Investing in Smallcap Index with Stocks | |
|
The following table helps investors and traders sort through current performance and trends (as measured by Smart Investing & Trading Score) of various
stocks in the Smallcap Index. Quick View: Move mouse or cursor over stock symbol (ticker) to view short-term technical chart and over stock name to view long term chart. Click on  to add stock symbol to your watchlist and to add stock symbol to your watchlist and  to view watchlist. Click on any ticker or stock name for detailed market intelligence report for that stock. to view watchlist. Click on any ticker or stock name for detailed market intelligence report for that stock. |
12Stocks.com Performance of Stocks in Smallcap Index
| Ticker | Stock Name | Watchlist | Category | Recent Price | Smart Investing & Trading Score | Change % | YTD Change% |
| NRDY | Nerdy |   | Technology | 2.68 | 32 | 2.29% | -21.98% |
| CNO | CNO Financial | | Financials | 25.69 | 32 | 2.27% | -7.92% |
| PBPB | Potbelly | | Services & Goods | 10.29 | 32 | 1.88% | -1.25% |
| SBCF | Seacoast Banking | | Financials | 22.47 | 32 | 1.86% | -21.05% |
| FMBH | First Mid | | Financials | 29.86 | 32 | 1.84% | -13.85% |
| FBRT | Franklin BSP | | Financials | 12.43 | 32 | 1.76% | -8.83% |
| NRDS | NerdWallet | | Financials | 13.57 | 32 | 1.72% | -9.17% |
| IBCP | Independent Bank | | Financials | 23.58 | 32 | 1.64% | -9.38% |
| CXM | Sprinklr | | Technology | 11.55 | 32 | 1.63% | -4.47% |
| FCF | First Commonwealth | | Financials | 12.79 | 32 | 1.35% | -17.16% |
| AUB | Atlantic Union | | Financials | 32.18 | 32 | 1.13% | -11.93% |
| KTB | Kontoor Brands | | Consumer Staples | 55.39 | 32 | 1.00% | -11.26% |
| PLOW | Douglas Dynamics | | Consumer Staples | 22.01 | 32 | 0.92% | -25.84% |
| CSGS | CSG Systems | | Technology | 48.40 | 32 | 0.83% | -9.04% |
| ALGT | Allegiant Travel | | Transports | 61.77 | 32 | 0.83% | -25.23% |
| BWFG | Bankwell Financial | | Financials | 23.63 | 32 | 0.72% | -21.70% |
| ALTI | AlTi Global | | Financials | 4.57 | 32 | 0.66% | -49.61% |
| PMVP | PMV | | Health Care | 1.62 | 32 | 0.62% | -47.74% |
| BHB | Bar Harbor | | Financials | 23.86 | 32 | 0.59% | -18.73% |
| ATGE | Adtalem Global | | Services & Goods | 46.14 | 32 | 0.33% | -21.73% |
| ONL | Orion Office | | Financials | 3.09 | 32 | 0.32% | -45.98% |
| ARTNA | Artesian Resources | | Utilities | 34.37 | 32 | 0.12% | -17.08% |
| METCB | Ramaco Resources | | Materials | 11.41 | 32 | 0.04% | -13.89% |
| TBPH | Theravance Biopharma | | Health Care | 9.20 | 32 | -3.36% | -18.15% |
| MRNS | Marinus | | Health Care | 1.41 | 32 | -2.08% | -87.03% |


| Too many stocks? View smallcap stocks filtered by marketcap & sector |
| Marketcap: All SmallCap Stocks (default-no microcap), Large, Mid-Range, Small |
| Smallcap Sector: Tech, Finance, Energy, Staples, Retail, Industrial, Materials, & Medical |
|
Get the most comprehensive stock market coverage daily at 12Stocks.com ➞ Best Stocks Today ➞ Best Stocks Weekly ➞ Best Stocks Year-to-Date ➞ Best Stocks Trends ➞  Best Stocks Today 12Stocks.com Best Nasdaq Stocks ➞ Best S&P 500 Stocks ➞ Best Tech Stocks ➞ Best Biotech Stocks ➞ |
| Detailed Overview of SmallCap Stocks |
| SmallCap Technical Overview, Leaders & Laggards, Top SmallCap ETF Funds & Detailed SmallCap Stocks List, Charts, Trends & More |
| Smallcap: Technical Analysis, Trends & YTD Performance | |
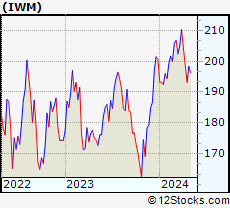
| SmallCap segment as represented by
IWM, an exchange-traded fund [ETF], holds basket of thousands of smallcap stocks from across all major sectors of the US stock market. The smallcap index (contains stocks like Riverbed & Sotheby's) is down by -3.92% and is currently underperforming the overall market by -8.11% year-to-date. Below is a quick view of technical charts and trends: | |
 IWM Weekly Chart |
|
| Long Term Trend: Not Good | |
| Medium Term Trend: Not Good | |
 IWM Daily Chart |
|
| Short Term Trend: Not Good | |
| Overall Trend Score: 23 | |
| YTD Performance: -3.92% | |
| **Trend Scores & Views Are Only For Educational Purposes And Not For Investing | |
| 12Stocks.com: Top Performing Small Cap Index Stocks | ||||||||||||||||||||||||||||||||||||||||||||||||
 The top performing Small Cap Index stocks year to date are
Now, more recently, over last week, the top performing Small Cap Index stocks on the move are


|
||||||||||||||||||||||||||||||||||||||||||||||||
| 12Stocks.com: Investing in Smallcap Index using Exchange Traded Funds | |
|
The following table shows list of key exchange traded funds (ETF) that
help investors track Smallcap index. The following list also includes leveraged ETF funds that track twice or thrice the daily returns of Smallcap indices. Short or inverse ETF funds move in the opposite direction to the index they track and are useful during market pullbacks or during bear markets. Quick View: Move mouse or cursor over ETF symbol (ticker) to view short-term technical chart and over ETF name to view long term chart. Click on ticker or stock name for detailed view. Click on to add stock symbol to your watchlist and to view watchlist. |
12Stocks.com List of ETFs that track Smallcap Index
| Ticker | ETF Name | Watchlist | Recent Price | Smart Investing & Trading Score | Change % | Week % | Year-to-date % |
| IWM | iShares Russell 2000 | | 192.84 | 23 | -0.08 | -2.94 | -3.92% |
| IJR | iShares Core S&P Small-Cap | | 102.34 | 31 | 0.21 | -2.08 | -5.46% |
| VTWO | Vanguard Russell 2000 ETF | | 77.95 | 23 | -0.13 | -2.95 | -3.88% |
| IWN | iShares Russell 2000 Value | | 146.33 | 10 | 0.21 | -2.69 | -5.79% |
| IJS | iShares S&P Small-Cap 600 Value | | 94.51 | 10 | 0.41 | -1.73 | -8.31% |
| IWO | iShares Russell 2000 Growth | | 246.94 | 36 | -0.44 | -3.3 | -2.09% |
| IJT | iShares S&P Small-Cap 600 Growth | | 121.57 | 23 | -0.22 | -2.57 | -2.85% |
| XSLV | PowerShares S&P SmallCap Low Volatil ETF | | 41.65 | 25 | 0.56 | -1.05 | -5.66% |
| SAA | ProShares Ultra SmallCap600 | | 21.62 | 10 | -0.18 | -4.17 | -13.35% |
| SMLV | SPDR SSGA US Small Cap Low Volatil ETF | | 103.83 | 10 | 0.16 | -1.13 | -7.72% |
| SBB | ProShares Short SmallCap600 | | 16.98 | 95 | 0.77 | 2.62 | 6.59% |
| SDD | ProShares UltraShort SmallCap600 | | 20.69 | 83 | 0.44 | 4.33 | 12.28% |
| 12Stocks.com: Charts, Trends, Fundamental Data and Performances of SmallCap Stocks | |
|
We now take in-depth look at all SmallCap stocks including charts, multi-period performances and overall trends (as measured by Smart Investing & Trading Score). One can sort SmallCap stocks (click link to choose) by Daily, Weekly and by Year-to-Date performances. Also, one can sort by size of the company or by market capitalization. |
| Select Your Default Chart Type: | |||||
| |||||
| Click on stock symbol or name for detailed view. Click on to add stock symbol to your watchlist and to view watchlist. Quick View: Move mouse or cursor over "Daily" to quickly view daily technical stock chart and over "Weekly" to view weekly technical stock chart. | |||||

 | NRDY Nerdy, Inc. |
| Sector: Technology | |
| SubSector: Software - Application | |
| MarketCap: 683 Millions | |
| Recent Price: 2.68 Smart Investing & Trading Score: 32 | |
| Day Percent Change: 2.29% Day Change: 0.06 | |
| Week Change: -0.37% Year-to-date Change: -22.0% | |
| NRDY Links: Profile News Message Board | |
| Charts:- Daily , Weekly | |
| Add NRDY to Watchlist: View: Get Complete NRDY Trend Analysis ➞ | |
 | CNO CNO Financial Group, Inc. |
| Sector: Financials | |
| SubSector: Accident & Health Insurance | |
| MarketCap: 1746.9 Millions | |
| Recent Price: 25.69 Smart Investing & Trading Score: 32 | |
| Day Percent Change: 2.27% Day Change: 0.57 | |
| Week Change: 1.06% Year-to-date Change: -7.9% | |
| CNO Links: Profile News Message Board | |
| Charts:- Daily , Weekly | |
| Add CNO to Watchlist: View: Get Complete CNO Trend Analysis ➞ | |
 | PBPB Potbelly Corporation |
| Sector: Services & Goods | |
| SubSector: Specialty Eateries | |
| MarketCap: 58.8 Millions | |
| Recent Price: 10.29 Smart Investing & Trading Score: 32 | |
| Day Percent Change: 1.88% Day Change: 0.19 | |
| Week Change: -1.72% Year-to-date Change: -1.3% | |
| PBPB Links: Profile News Message Board | |
| Charts:- Daily , Weekly | |
| Add PBPB to Watchlist: View: Get Complete PBPB Trend Analysis ➞ | |
 | SBCF Seacoast Banking Corporation of Florida |
| Sector: Financials | |
| SubSector: Regional - Mid-Atlantic Banks | |
| MarketCap: 881.559 Millions | |
| Recent Price: 22.47 Smart Investing & Trading Score: 32 | |
| Day Percent Change: 1.86% Day Change: 0.41 | |
| Week Change: -0.18% Year-to-date Change: -21.1% | |
| SBCF Links: Profile News Message Board | |
| Charts:- Daily , Weekly | |
| Add SBCF to Watchlist: View: Get Complete SBCF Trend Analysis ➞ | |
 | FMBH First Mid Bancshares, Inc. |
| Sector: Financials | |
| SubSector: Regional - Midwest Banks | |
| MarketCap: 373.27 Millions | |
| Recent Price: 29.86 Smart Investing & Trading Score: 32 | |
| Day Percent Change: 1.84% Day Change: 0.54 | |
| Week Change: 1.19% Year-to-date Change: -13.9% | |
| FMBH Links: Profile News Message Board | |
| Charts:- Daily , Weekly | |
| Add FMBH to Watchlist: View: Get Complete FMBH Trend Analysis ➞ | |
 | FBRT Franklin BSP Realty Trust, Inc. |
| Sector: Financials | |
| SubSector: REIT - Mortgage | |
| MarketCap: 1170 Millions | |
| Recent Price: 12.43 Smart Investing & Trading Score: 32 | |
| Day Percent Change: 1.76% Day Change: 0.21 | |
| Week Change: 0.53% Year-to-date Change: -8.8% | |
| FBRT Links: Profile News Message Board | |
| Charts:- Daily , Weekly | |
| Add FBRT to Watchlist: View: Get Complete FBRT Trend Analysis ➞ | |
 | NRDS NerdWallet, Inc. |
| Sector: Financials | |
| SubSector: Credit Services | |
| MarketCap: 759 Millions | |
| Recent Price: 13.57 Smart Investing & Trading Score: 32 | |
| Day Percent Change: 1.72% Day Change: 0.23 | |
| Week Change: -2.02% Year-to-date Change: -9.2% | |
| NRDS Links: Profile News Message Board | |
| Charts:- Daily , Weekly | |
| Add NRDS to Watchlist: View: Get Complete NRDS Trend Analysis ➞ | |
 | IBCP Independent Bank Corporation |
| Sector: Financials | |
| SubSector: Regional - Midwest Banks | |
| MarketCap: 273.67 Millions | |
| Recent Price: 23.58 Smart Investing & Trading Score: 32 | |
| Day Percent Change: 1.64% Day Change: 0.38 | |
| Week Change: 1.29% Year-to-date Change: -9.4% | |
| IBCP Links: Profile News Message Board | |
| Charts:- Daily , Weekly | |
| Add IBCP to Watchlist: View: Get Complete IBCP Trend Analysis ➞ | |
 | CXM Sprinklr, Inc. |
| Sector: Technology | |
| SubSector: Software - Application | |
| MarketCap: 3700 Millions | |
| Recent Price: 11.55 Smart Investing & Trading Score: 32 | |
| Day Percent Change: 1.63% Day Change: 0.19 | |
| Week Change: -0.04% Year-to-date Change: -4.5% | |
| CXM Links: Profile News Message Board | |
| Charts:- Daily , Weekly | |
| Add CXM to Watchlist: View: Get Complete CXM Trend Analysis ➞ | |
 | FCF First Commonwealth Financial Corporation |
| Sector: Financials | |
| SubSector: Regional - Northeast Banks | |
| MarketCap: 900.299 Millions | |
| Recent Price: 12.79 Smart Investing & Trading Score: 32 | |
| Day Percent Change: 1.35% Day Change: 0.17 | |
| Week Change: 0.39% Year-to-date Change: -17.2% | |
| FCF Links: Profile News Message Board | |
| Charts:- Daily , Weekly | |
| Add FCF to Watchlist: View: Get Complete FCF Trend Analysis ➞ | |
 | AUB Atlantic Union Bankshares Corporation |
| Sector: Financials | |
| SubSector: Regional - Mid-Atlantic Banks | |
| MarketCap: 1728.79 Millions | |
| Recent Price: 32.18 Smart Investing & Trading Score: 32 | |
| Day Percent Change: 1.13% Day Change: 0.36 | |
| Week Change: 0.37% Year-to-date Change: -11.9% | |
| AUB Links: Profile News Message Board | |
| Charts:- Daily , Weekly | |
| Add AUB to Watchlist: View: Get Complete AUB Trend Analysis ➞ | |
 | KTB Kontoor Brands, Inc. |
| Sector: Consumer Staples | |
| SubSector: Textile - Apparel Clothing | |
| MarketCap: 1668.65 Millions | |
| Recent Price: 55.39 Smart Investing & Trading Score: 32 | |
| Day Percent Change: 1.00% Day Change: 0.55 | |
| Week Change: 2.65% Year-to-date Change: -11.3% | |
| KTB Links: Profile News Message Board | |
| Charts:- Daily , Weekly | |
| Add KTB to Watchlist: View: Get Complete KTB Trend Analysis ➞ | |
 | PLOW Douglas Dynamics, Inc. |
| Sector: Consumer Staples | |
| SubSector: Auto Parts | |
| MarketCap: 654.739 Millions | |
| Recent Price: 22.01 Smart Investing & Trading Score: 32 | |
| Day Percent Change: 0.92% Day Change: 0.20 | |
| Week Change: 0.5% Year-to-date Change: -25.8% | |
| PLOW Links: Profile News Message Board | |
| Charts:- Daily , Weekly | |
| Add PLOW to Watchlist: View: Get Complete PLOW Trend Analysis ➞ | |
 | CSGS CSG Systems International, Inc. |
| Sector: Technology | |
| SubSector: Business Software & Services | |
| MarketCap: 1336.78 Millions | |
| Recent Price: 48.40 Smart Investing & Trading Score: 32 | |
| Day Percent Change: 0.83% Day Change: 0.40 | |
| Week Change: 0.48% Year-to-date Change: -9.0% | |
| CSGS Links: Profile News Message Board | |
| Charts:- Daily , Weekly | |
| Add CSGS to Watchlist: View: Get Complete CSGS Trend Analysis ➞ | |
 | ALGT Allegiant Travel Company |
| Sector: Transports | |
| SubSector: Regional Airlines | |
| MarketCap: 1317.7 Millions | |
| Recent Price: 61.77 Smart Investing & Trading Score: 32 | |
| Day Percent Change: 0.83% Day Change: 0.51 | |
| Week Change: 0.85% Year-to-date Change: -25.2% | |
| ALGT Links: Profile News Message Board | |
| Charts:- Daily , Weekly | |
| Add ALGT to Watchlist: View: Get Complete ALGT Trend Analysis ➞ | |
 | BWFG Bankwell Financial Group, Inc. |
| Sector: Financials | |
| SubSector: Regional - Northeast Banks | |
| MarketCap: 142.899 Millions | |
| Recent Price: 23.63 Smart Investing & Trading Score: 32 | |
| Day Percent Change: 0.72% Day Change: 0.17 | |
| Week Change: -1.93% Year-to-date Change: -21.7% | |
| BWFG Links: Profile News Message Board | |
| Charts:- Daily , Weekly | |
| Add BWFG to Watchlist: View: Get Complete BWFG Trend Analysis ➞ | |
 | ALTI AlTi Global, Inc. |
| Sector: Financials | |
| SubSector: Asset Management | |
| MarketCap: 917 Millions | |
| Recent Price: 4.57 Smart Investing & Trading Score: 32 | |
| Day Percent Change: 0.66% Day Change: 0.03 | |
| Week Change: -2.77% Year-to-date Change: -49.6% | |
| ALTI Links: Profile News Message Board | |
| Charts:- Daily , Weekly | |
| Add ALTI to Watchlist: View: Get Complete ALTI Trend Analysis ➞ | |
 | PMVP PMV Pharmaceuticals, Inc. |
| Sector: Health Care | |
| SubSector: Biotechnology | |
| MarketCap: 20187 Millions | |
| Recent Price: 1.62 Smart Investing & Trading Score: 32 | |
| Day Percent Change: 0.62% Day Change: 0.01 | |
| Week Change: -9.5% Year-to-date Change: -47.7% | |
| PMVP Links: Profile News Message Board | |
| Charts:- Daily , Weekly | |
| Add PMVP to Watchlist: View: Get Complete PMVP Trend Analysis ➞ | |
 | BHB Bar Harbor Bankshares |
| Sector: Financials | |
| SubSector: Regional - Northeast Banks | |
| MarketCap: 298.099 Millions | |
| Recent Price: 23.86 Smart Investing & Trading Score: 32 | |
| Day Percent Change: 0.59% Day Change: 0.14 | |
| Week Change: -0.08% Year-to-date Change: -18.7% | |
| BHB Links: Profile News Message Board | |
| Charts:- Daily , Weekly | |
| Add BHB to Watchlist: View: Get Complete BHB Trend Analysis ➞ | |
 | ATGE Adtalem Global Education Inc. |
| Sector: Services & Goods | |
| SubSector: Education & Training Services | |
| MarketCap: 1273.86 Millions | |
| Recent Price: 46.14 Smart Investing & Trading Score: 32 | |
| Day Percent Change: 0.33% Day Change: 0.15 | |
| Week Change: -0.26% Year-to-date Change: -21.7% | |
| ATGE Links: Profile News Message Board | |
| Charts:- Daily , Weekly | |
| Add ATGE to Watchlist: View: Get Complete ATGE Trend Analysis ➞ | |
 | ONL Orion Office REIT Inc. |
| Sector: Financials | |
| SubSector: REIT - Office | |
| MarketCap: 375 Millions | |
| Recent Price: 3.09 Smart Investing & Trading Score: 32 | |
| Day Percent Change: 0.32% Day Change: 0.01 | |
| Week Change: -2.22% Year-to-date Change: -46.0% | |
| ONL Links: Profile News Message Board | |
| Charts:- Daily , Weekly | |
| Add ONL to Watchlist: View: Get Complete ONL Trend Analysis ➞ | |
 | ARTNA Artesian Resources Corporation |
| Sector: Utilities | |
| SubSector: Water Utilities | |
| MarketCap: 299.402 Millions | |
| Recent Price: 34.37 Smart Investing & Trading Score: 32 | |
| Day Percent Change: 0.12% Day Change: 0.04 | |
| Week Change: 0.97% Year-to-date Change: -17.1% | |
| ARTNA Links: Profile News Message Board | |
| Charts:- Daily , Weekly | |
| Add ARTNA to Watchlist: View: Get Complete ARTNA Trend Analysis ➞ | |
 | METCB Ramaco Resources, Inc. |
| Sector: Materials | |
| SubSector: Coking Coal | |
| MarketCap: 469 Millions | |
| Recent Price: 11.41 Smart Investing & Trading Score: 32 | |
| Day Percent Change: 0.04% Day Change: 0.01 | |
| Week Change: 0% Year-to-date Change: -13.9% | |
| METCB Links: Profile News Message Board | |
| Charts:- Daily , Weekly | |
| Add METCB to Watchlist: View: Get Complete METCB Trend Analysis ➞ | |
 | TBPH Theravance Biopharma, Inc. |
| Sector: Health Care | |
| SubSector: Biotechnology | |
| MarketCap: 1404.55 Millions | |
| Recent Price: 9.20 Smart Investing & Trading Score: 32 | |
| Day Percent Change: -3.36% Day Change: -0.32 | |
| Week Change: -4.27% Year-to-date Change: -18.2% | |
| TBPH Links: Profile News Message Board | |
| Charts:- Daily , Weekly | |
| Add TBPH to Watchlist: View: Get Complete TBPH Trend Analysis ➞ | |
 | MRNS Marinus Pharmaceuticals, Inc. |
| Sector: Health Care | |
| SubSector: Biotechnology | |
| MarketCap: 222.885 Millions | |
| Recent Price: 1.41 Smart Investing & Trading Score: 32 | |
| Day Percent Change: -2.08% Day Change: -0.03 | |
| Week Change: -81.25% Year-to-date Change: -87.0% | |
| MRNS Links: Profile News Message Board | |
| Charts:- Daily , Weekly | |
| Add MRNS to Watchlist: View: Get Complete MRNS Trend Analysis ➞ | |
| Too many stocks? View smallcap stocks filtered by marketcap & sector |
| Marketcap: All SmallCap Stocks (default-no microcap), Large, Mid-Range, Small & MicroCap |
| Sector: Tech, Finance, Energy, Staples, Retail, Industrial, Materials, Utilities & Medical |
|
Best Stocks Today 12Stocks.com |
© 2024 12Stocks.com Terms & Conditions Privacy Contact Us
All Information Provided Only For Education And Not To Be Used For Investing or Trading. See Terms & Conditions


One More Thing ... Get Best Stocks Delivered Daily!
Never Ever Miss A Move With Our Top Ten Stocks Lists
Find Best Stocks In Any Market - Bull or Bear Market
Take A Peek At Our Top Ten Stocks Lists: Daily, Weekly, Year-to-Date & Top Trends
Find Best Stocks In Any Market - Bull or Bear Market
Take A Peek At Our Top Ten Stocks Lists: Daily, Weekly, Year-to-Date & Top Trends
Smallcap Stocks With Best Up Trends [0-bearish to 100-bullish]: Badger Meter[100], Cullinan Oncology[100], Oscar Health[100], NextNav [100], EchoStar [100], Victory Capital[100], Macatawa Bank[100], IMAX [100], Envestnet [100], ALX Oncology[100], Argan [95]
Best Smallcap Stocks Year-to-Date:
Agenus [500.31%], CareMax [417.53%], Janux [348.12%], Viking [247.5%], Alpine Immune[238.5%], Super Micro[226.63%], Longboard [194.76%], Arcutis Bio[192.57%], Vera [161.3%], Avidity Biosciences[154.87%], Hippo [128.32%] Best Smallcap Stocks This Week:
Macatawa Bank[44.42%], 23andMe Holding[33.3%], ProKidney [32%], Snap One[29.73%], Vertex Energy[25.96%], ALX Oncology[20.64%], Vanda [20.63%], Expensify [18.37%], Badger Meter[16.72%], ContextLogic [15%], Cullinan Oncology[13.89%] Best Smallcap Stocks Daily:
23andMe Holding[65.91%], Vertex Energy[33.78%], Zura Bio[17.20%], Badger Meter[16.65%], ContextLogic [15.81%], Expensify [15.23%], Montrose Environmental[12.84%], Vaxxinity [10.05%], Cipher Mining[8.65%], FiscalNote [8.61%], Vuzix [8.15%]