
 Login Sign Up


| |||||
 |  | ||||

| 12Stocks.com Market Intelligence |
Best SmallCap Stocks
|
| In a hurry? Small Cap Stock Lists: Performance Trends Table, Stock Charts
Sort Small Cap stocks: Daily, Weekly, Year-to-Date, Market Cap & Trends. Filter Small Cap stocks list by sector: Show all, Tech, Finance, Energy, Staples, Retail, Industrial, Materials, Utilities and HealthCare Filter Small Cap stocks list by size: All Large Medium Small and MicroCap |
| 12Stocks.com Small Cap Stocks Performances & Trends Daily | |||||||||
|
|  The overall Smart Investing & Trading Score is 58 (0-bearish to 100-bullish) which puts Small Cap index in short term neutral trend. The Smart Investing & Trading Score from previous trading session is 23 and an improvement of trend continues.
| ||||||||
Here are the Smart Investing & Trading Scores of the most requested small cap stocks at 12Stocks.com (click stock name for detailed review):
|


| 12Stocks.com: Investing in Smallcap Index with Stocks | |
|
The following table helps investors and traders sort through current performance and trends (as measured by Smart Investing & Trading Score) of various
stocks in the Smallcap Index. Quick View: Move mouse or cursor over stock symbol (ticker) to view short-term technical chart and over stock name to view long term chart. Click on  to add stock symbol to your watchlist and to add stock symbol to your watchlist and  to view watchlist. Click on any ticker or stock name for detailed market intelligence report for that stock. to view watchlist. Click on any ticker or stock name for detailed market intelligence report for that stock. |
12Stocks.com Performance of Stocks in Smallcap Index
| Ticker | Stock Name | Watchlist | Category | Recent Price | Smart Investing & Trading Score | Change % | YTD Change% |
| GRNT | Granite Ridge |   | Energy | 6.79 | 59 | 0.89% | 12.60% |
| SOUN | SoundHound AI | | Technology | 4.07 | 58 | 7.54% | 89.95% |
| WVE | Wave Life | | Health Care | 5.13 | 58 | 5.89% | 1.49% |
| KBH | KB Home | | Industrials | 64.07 | 58 | 2.20% | 2.58% |
| GPI | Group 1 | | Services & Goods | 273.97 | 58 | 2.07% | -10.10% |
| BBAI | BigBear.ai | | Technology | 1.72 | 58 | 10.26% | -19.25% |
| AEO | American Eagle | | Services & Goods | 22.95 | 58 | 1.91% | 8.46% |
| TMHC | Taylor Morrison | | Industrials | 56.06 | 58 | 1.83% | 5.07% |
| BARK | BARK | | Services & Goods | 1.12 | 58 | 1.82% | 39.97% |
| TPH | TRI Pointe | | Industrials | 35.90 | 58 | 1.79% | 1.41% |
| TTMI | TTM | | Technology | 14.48 | 58 | 1.54% | -8.41% |
| ALRM | Alarm.com | | Technology | 65.78 | 58 | 1.48% | 1.80% |
| FWRG | First Watch | | Services & Goods | 22.59 | 58 | 1.41% | 13.37% |
| SXI | Standex | | Industrials | 171.19 | 58 | 1.25% | 8.08% |
| PTGX | Protagonist | | Health Care | 26.94 | 58 | 1.24% | 17.49% |
| GES | Guess | | Services & Goods | 26.07 | 58 | 1.20% | 13.05% |
| GFF | Griffon | | Industrials | 67.29 | 58 | 1.16% | 10.40% |
| APAM | Artisan Partners | | Financials | 43.02 | 58 | 1.12% | -2.61% |
| LYTS | LSI Industries | | Industrials | 14.68 | 58 | 1.10% | 4.26% |
| MBC | MasterBrand | | Services & Goods | 16.99 | 58 | 1.07% | 13.84% |
| ANF | Abercrombie & Fitch Co | | Services & Goods | 116.06 | 58 | 1.06% | 31.56% |
| NE | Noble | | Energy | 46.79 | 58 | 0.99% | -2.84% |
| RDN | Radian Group | | Financials | 30.20 | 58 | 0.94% | 5.78% |
| CXW | CoreCivic | | Financials | 15.05 | 58 | 0.74% | 3.58% |
| PATK | Patrick Industries | | Industrials | 106.31 | 58 | 0.72% | 5.93% |
| For chart view version of above stock list: Chart View ➞ 0 - 25 , 25 - 50 , 50 - 75 , 75 - 100 , 100 - 125 , 125 - 150 , 150 - 175 , 175 - 200 , 200 - 225 , 225 - 250 , 250 - 275 , 275 - 300 , 300 - 325 , 325 - 350 , 350 - 375 , 375 - 400 , 400 - 425 , 425 - 450 , 450 - 475 , 475 - 500 , 500 - 525 , 525 - 550 , 550 - 575 , 575 - 600 , 600 - 625 , 625 - 650 , 650 - 675 , 675 - 700 , 700 - 725 , 725 - 750 , 750 - 775 , 775 - 800 , 800 - 825 , 825 - 850 , 850 - 875 , 875 - 900 , 900 - 925 , 925 - 950 , 950 - 975 , 975 - 1000 , 1000 - 1025 , 1025 - 1050 , 1050 - 1075 , 1075 - 1100 , 1100 - 1125 , 1125 - 1150 , 1150 - 1175 , 1175 - 1200 , 1200 - 1225 , 1225 - 1250 , 1250 - 1275 , 1275 - 1300 , 1300 - 1325 , 1325 - 1350 , 1350 - 1375 | ||
 | Click To Change The Sort Order: By Market Cap or Company Size Performance: Year-to-date, Week and Day |  |
| Too many stocks? View smallcap stocks filtered by marketcap & sector |
| Marketcap: All SmallCap Stocks (default-no microcap), Large, Mid-Range, Small |
| Smallcap Sector: Tech, Finance, Energy, Staples, Retail, Industrial, Materials, & Medical |
|
Get the most comprehensive stock market coverage daily at 12Stocks.com ➞ Best Stocks Today ➞ Best Stocks Weekly ➞ Best Stocks Year-to-Date ➞ Best Stocks Trends ➞  Best Stocks Today 12Stocks.com Best Nasdaq Stocks ➞ Best S&P 500 Stocks ➞ Best Tech Stocks ➞ Best Biotech Stocks ➞ |
| Detailed Overview of SmallCap Stocks |
| SmallCap Technical Overview, Leaders & Laggards, Top SmallCap ETF Funds & Detailed SmallCap Stocks List, Charts, Trends & More |
| Smallcap: Technical Analysis, Trends & YTD Performance | |
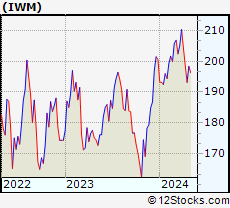
| SmallCap segment as represented by
IWM, an exchange-traded fund [ETF], holds basket of thousands of smallcap stocks from across all major sectors of the US stock market. The smallcap index (contains stocks like Riverbed & Sotheby's) is down by -1.52% and is currently underperforming the overall market by -6.66% year-to-date. Below is a quick view of technical charts and trends: | |
 IWM Weekly Chart |
|
| Long Term Trend: Good | |
| Medium Term Trend: Not Good | |
 IWM Daily Chart |
|
| Short Term Trend: Very Good | |
| Overall Trend Score: 58 | |
| YTD Performance: -1.52% | |
| **Trend Scores & Views Are Only For Educational Purposes And Not For Investing | |
| 12Stocks.com: Top Performing Small Cap Index Stocks | ||||||||||||||||||||||||||||||||||||||||||||||||
 The top performing Small Cap Index stocks year to date are
Now, more recently, over last week, the top performing Small Cap Index stocks on the move are


|
||||||||||||||||||||||||||||||||||||||||||||||||
| 12Stocks.com: Investing in Smallcap Index using Exchange Traded Funds | |
|
The following table shows list of key exchange traded funds (ETF) that
help investors track Smallcap index. The following list also includes leveraged ETF funds that track twice or thrice the daily returns of Smallcap indices. Short or inverse ETF funds move in the opposite direction to the index they track and are useful during market pullbacks or during bear markets. Quick View: Move mouse or cursor over ETF symbol (ticker) to view short-term technical chart and over ETF name to view long term chart. Click on ticker or stock name for detailed view. Click on to add stock symbol to your watchlist and to view watchlist. |
12Stocks.com List of ETFs that track Smallcap Index
| Ticker | ETF Name | Watchlist | Recent Price | Smart Investing & Trading Score | Change % | Week % | Year-to-date % |
| IWM | iShares Russell 2000 | | 197.66 | 58 | 1.21 | 2.34 | -1.52% |
| VTWO | Vanguard Russell 2000 ETF | | 79.92 | 65 | 1.27 | 2.36 | -1.45% |
| IJR | iShares Core S&P Small-Cap | | 105.23 | 45 | 1.71 | 1.95 | -2.79% |
| IWN | iShares Russell 2000 Value | | 150.98 | 63 | 0.98 | 2.17 | -2.8% |
| IWO | iShares Russell 2000 Growth | | 251.63 | 51 | 1.50 | 2.58 | -0.23% |
| IJS | iShares S&P Small-Cap 600 Value | | 97.52 | 39 | 1.13 | 2 | -5.38% |
| IJT | iShares S&P Small-Cap 600 Growth | | 123.36 | 70 | 0.00 | 0.94 | -1.42% |
| XSLV | PowerShares S&P SmallCap Low Volatil ETF | | 42.74 | 62 | 0.72 | 1.34 | -3.18% |
| 12Stocks.com: Charts, Trends, Fundamental Data and Performances of SmallCap Stocks | |
|
We now take in-depth look at all SmallCap stocks including charts, multi-period performances and overall trends (as measured by Smart Investing & Trading Score). One can sort SmallCap stocks (click link to choose) by Daily, Weekly and by Year-to-Date performances. Also, one can sort by size of the company or by market capitalization. |
| Select Your Default Chart Type: | |||||
| |||||
| Click on stock symbol or name for detailed view. Click on to add stock symbol to your watchlist and to view watchlist. Quick View: Move mouse or cursor over "Daily" to quickly view daily technical stock chart and over "Weekly" to view weekly technical stock chart. | |||||

 | GRNT Granite Ridge Resources, Inc. |
| Sector: Energy | |
| SubSector: Oil & Gas E&P | |
| MarketCap: 890 Millions | |
| Recent Price: 6.79 Smart Investing & Trading Score: 59 | |
| Day Percent Change: 0.89% Day Change: 0.06 | |
| Week Change: -0.73% Year-to-date Change: 12.6% | |
| GRNT Links: Profile News Message Board | |
| Charts:- Daily , Weekly | |
| Add GRNT to Watchlist: View: Get Complete GRNT Trend Analysis ➞ | |
 | SOUN SoundHound AI, Inc. |
| Sector: Technology | |
| SubSector: Software - Application | |
| MarketCap: 1040 Millions | |
| Recent Price: 4.07 Smart Investing & Trading Score: 58 | |
| Day Percent Change: 7.54% Day Change: 0.29 | |
| Week Change: 14.51% Year-to-date Change: 90.0% | |
| SOUN Links: Profile News Message Board | |
| Charts:- Daily , Weekly | |
| Add SOUN to Watchlist: View: Get Complete SOUN Trend Analysis ➞ | |
 | WVE Wave Life Sciences Ltd. |
| Sector: Health Care | |
| SubSector: Biotechnology | |
| MarketCap: 452.785 Millions | |
| Recent Price: 5.13 Smart Investing & Trading Score: 58 | |
| Day Percent Change: 5.89% Day Change: 0.29 | |
| Week Change: 5.24% Year-to-date Change: 1.5% | |
| WVE Links: Profile News Message Board | |
| Charts:- Daily , Weekly | |
| Add WVE to Watchlist: View: Get Complete WVE Trend Analysis ➞ | |
 | KBH KB Home |
| Sector: Industrials | |
| SubSector: Residential Construction | |
| MarketCap: 1249.66 Millions | |
| Recent Price: 64.07 Smart Investing & Trading Score: 58 | |
| Day Percent Change: 2.20% Day Change: 1.38 | |
| Week Change: 4.98% Year-to-date Change: 2.6% | |
| KBH Links: Profile News Message Board | |
| Charts:- Daily , Weekly | |
| Add KBH to Watchlist: View: Get Complete KBH Trend Analysis ➞ | |
 | GPI Group 1 Automotive, Inc. |
| Sector: Services & Goods | |
| SubSector: Auto Dealerships | |
| MarketCap: 921.021 Millions | |
| Recent Price: 273.97 Smart Investing & Trading Score: 58 | |
| Day Percent Change: 2.07% Day Change: 5.55 | |
| Week Change: 3.18% Year-to-date Change: -10.1% | |
| GPI Links: Profile News Message Board | |
| Charts:- Daily , Weekly | |
| Add GPI to Watchlist: View: Get Complete GPI Trend Analysis ➞ | |
 | BBAI BigBear.ai Holdings, Inc. |
| Sector: Technology | |
| SubSector: Information Technology Services | |
| MarketCap: 339 Millions | |
| Recent Price: 1.72 Smart Investing & Trading Score: 58 | |
| Day Percent Change: 10.26% Day Change: 0.16 | |
| Week Change: 18.62% Year-to-date Change: -19.3% | |
| BBAI Links: Profile News Message Board | |
| Charts:- Daily , Weekly | |
| Add BBAI to Watchlist: View: Get Complete BBAI Trend Analysis ➞ | |
 | AEO American Eagle Outfitters, Inc. |
| Sector: Services & Goods | |
| SubSector: Apparel Stores | |
| MarketCap: 1577.08 Millions | |
| Recent Price: 22.95 Smart Investing & Trading Score: 58 | |
| Day Percent Change: 1.91% Day Change: 0.43 | |
| Week Change: 2.55% Year-to-date Change: 8.5% | |
| AEO Links: Profile News Message Board | |
| Charts:- Daily , Weekly | |
| Add AEO to Watchlist: View: Get Complete AEO Trend Analysis ➞ | |
 | TMHC Taylor Morrison Home Corporation |
| Sector: Industrials | |
| SubSector: Residential Construction | |
| MarketCap: 1336.76 Millions | |
| Recent Price: 56.06 Smart Investing & Trading Score: 58 | |
| Day Percent Change: 1.83% Day Change: 1.01 | |
| Week Change: 3.38% Year-to-date Change: 5.1% | |
| TMHC Links: Profile News Message Board | |
| Charts:- Daily , Weekly | |
| Add TMHC to Watchlist: View: Get Complete TMHC Trend Analysis ➞ | |
 | BARK BARK, Inc. |
| Sector: Services & Goods | |
| SubSector: Specialty Retail | |
| MarketCap: 234 Millions | |
| Recent Price: 1.12 Smart Investing & Trading Score: 58 | |
| Day Percent Change: 1.82% Day Change: 0.02 | |
| Week Change: 4.67% Year-to-date Change: 40.0% | |
| BARK Links: Profile News Message Board | |
| Charts:- Daily , Weekly | |
| Add BARK to Watchlist: View: Get Complete BARK Trend Analysis ➞ | |
 | TPH TRI Pointe Group, Inc. |
| Sector: Industrials | |
| SubSector: Residential Construction | |
| MarketCap: 1140.06 Millions | |
| Recent Price: 35.90 Smart Investing & Trading Score: 58 | |
| Day Percent Change: 1.79% Day Change: 0.63 | |
| Week Change: 2.78% Year-to-date Change: 1.4% | |
| TPH Links: Profile News Message Board | |
| Charts:- Daily , Weekly | |
| Add TPH to Watchlist: View: Get Complete TPH Trend Analysis ➞ | |
 | TTMI TTM Technologies, Inc. |
| Sector: Technology | |
| SubSector: Printed Circuit Boards | |
| MarketCap: 1028.35 Millions | |
| Recent Price: 14.48 Smart Investing & Trading Score: 58 | |
| Day Percent Change: 1.54% Day Change: 0.22 | |
| Week Change: 3.06% Year-to-date Change: -8.4% | |
| TTMI Links: Profile News Message Board | |
| Charts:- Daily , Weekly | |
| Add TTMI to Watchlist: View: Get Complete TTMI Trend Analysis ➞ | |
 | ALRM Alarm.com Holdings, Inc. |
| Sector: Technology | |
| SubSector: Application Software | |
| MarketCap: 2035.62 Millions | |
| Recent Price: 65.78 Smart Investing & Trading Score: 58 | |
| Day Percent Change: 1.48% Day Change: 0.96 | |
| Week Change: 2.6% Year-to-date Change: 1.8% | |
| ALRM Links: Profile News Message Board | |
| Charts:- Daily , Weekly | |
| Add ALRM to Watchlist: View: Get Complete ALRM Trend Analysis ➞ | |
 | FWRG First Watch Restaurant Group, Inc. |
| Sector: Services & Goods | |
| SubSector: Restaurants | |
| MarketCap: 1000 Millions | |
| Recent Price: 22.59 Smart Investing & Trading Score: 58 | |
| Day Percent Change: 1.41% Day Change: 0.31 | |
| Week Change: 1.32% Year-to-date Change: 13.4% | |
| FWRG Links: Profile News Message Board | |
| Charts:- Daily , Weekly | |
| Add FWRG to Watchlist: View: Get Complete FWRG Trend Analysis ➞ | |
 | SXI Standex International Corporation |
| Sector: Industrials | |
| SubSector: Industrial Equipment & Components | |
| MarketCap: 644.109 Millions | |
| Recent Price: 171.19 Smart Investing & Trading Score: 58 | |
| Day Percent Change: 1.25% Day Change: 2.12 | |
| Week Change: 2.18% Year-to-date Change: 8.1% | |
| SXI Links: Profile News Message Board | |
| Charts:- Daily , Weekly | |
| Add SXI to Watchlist: View: Get Complete SXI Trend Analysis ➞ | |
 | PTGX Protagonist Therapeutics, Inc. |
| Sector: Health Care | |
| SubSector: Biotechnology | |
| MarketCap: 165.285 Millions | |
| Recent Price: 26.94 Smart Investing & Trading Score: 58 | |
| Day Percent Change: 1.24% Day Change: 0.33 | |
| Week Change: 5.19% Year-to-date Change: 17.5% | |
| PTGX Links: Profile News Message Board | |
| Charts:- Daily , Weekly | |
| Add PTGX to Watchlist: View: Get Complete PTGX Trend Analysis ➞ | |
 | GES Guess , Inc. |
| Sector: Services & Goods | |
| SubSector: Apparel Stores | |
| MarketCap: 591.908 Millions | |
| Recent Price: 26.07 Smart Investing & Trading Score: 58 | |
| Day Percent Change: 1.20% Day Change: 0.31 | |
| Week Change: 1.48% Year-to-date Change: 13.1% | |
| GES Links: Profile News Message Board | |
| Charts:- Daily , Weekly | |
| Add GES to Watchlist: View: Get Complete GES Trend Analysis ➞ | |
 | GFF Griffon Corporation |
| Sector: Industrials | |
| SubSector: General Building Materials | |
| MarketCap: 616 Millions | |
| Recent Price: 67.29 Smart Investing & Trading Score: 58 | |
| Day Percent Change: 1.16% Day Change: 0.77 | |
| Week Change: 2% Year-to-date Change: 10.4% | |
| GFF Links: Profile News Message Board | |
| Charts:- Daily , Weekly | |
| Add GFF to Watchlist: View: Get Complete GFF Trend Analysis ➞ | |
 | APAM Artisan Partners Asset Management Inc. |
| Sector: Financials | |
| SubSector: Asset Management | |
| MarketCap: 1688.33 Millions | |
| Recent Price: 43.02 Smart Investing & Trading Score: 58 | |
| Day Percent Change: 1.12% Day Change: 0.48 | |
| Week Change: 0.95% Year-to-date Change: -2.6% | |
| APAM Links: Profile News Message Board | |
| Charts:- Daily , Weekly | |
| Add APAM to Watchlist: View: Get Complete APAM Trend Analysis ➞ | |
 | LYTS LSI Industries Inc. |
| Sector: Industrials | |
| SubSector: Industrial Electrical Equipment | |
| MarketCap: 85.7879 Millions | |
| Recent Price: 14.68 Smart Investing & Trading Score: 58 | |
| Day Percent Change: 1.10% Day Change: 0.16 | |
| Week Change: -0.14% Year-to-date Change: 4.3% | |
| LYTS Links: Profile News Message Board | |
| Charts:- Daily , Weekly | |
| Add LYTS to Watchlist: View: Get Complete LYTS Trend Analysis ➞ | |
 | MBC MasterBrand, Inc. |
| Sector: Services & Goods | |
| SubSector: Furnishings, Fixtures & Appliances | |
| MarketCap: 1480 Millions | |
| Recent Price: 16.99 Smart Investing & Trading Score: 58 | |
| Day Percent Change: 1.07% Day Change: 0.18 | |
| Week Change: 2.16% Year-to-date Change: 13.8% | |
| MBC Links: Profile News Message Board | |
| Charts:- Daily , Weekly | |
| Add MBC to Watchlist: View: Get Complete MBC Trend Analysis ➞ | |
 | ANF Abercrombie & Fitch Co. |
| Sector: Services & Goods | |
| SubSector: Apparel Stores | |
| MarketCap: 589.108 Millions | |
| Recent Price: 116.06 Smart Investing & Trading Score: 58 | |
| Day Percent Change: 1.06% Day Change: 1.22 | |
| Week Change: 5.16% Year-to-date Change: 31.6% | |
| ANF Links: Profile News Message Board | |
| Charts:- Daily , Weekly | |
| Add ANF to Watchlist: View: Get Complete ANF Trend Analysis ➞ | |
 | NE Noble Corporation Plc |
| Sector: Energy | |
| SubSector: Oil & Gas Drilling | |
| MarketCap: 5520 Millions | |
| Recent Price: 46.79 Smart Investing & Trading Score: 58 | |
| Day Percent Change: 0.99% Day Change: 0.46 | |
| Week Change: 1.39% Year-to-date Change: -2.8% | |
| NE Links: Profile News Message Board | |
| Charts:- Daily , Weekly | |
| Add NE to Watchlist: View: Get Complete NE Trend Analysis ➞ | |
 | RDN Radian Group Inc. |
| Sector: Financials | |
| SubSector: Property & Casualty Insurance | |
| MarketCap: 2950.12 Millions | |
| Recent Price: 30.20 Smart Investing & Trading Score: 58 | |
| Day Percent Change: 0.94% Day Change: 0.28 | |
| Week Change: 1.82% Year-to-date Change: 5.8% | |
| RDN Links: Profile News Message Board | |
| Charts:- Daily , Weekly | |
| Add RDN to Watchlist: View: Get Complete RDN Trend Analysis ➞ | |
 | CXW CoreCivic, Inc. |
| Sector: Financials | |
| SubSector: REIT - Diversified | |
| MarketCap: 1440.23 Millions | |
| Recent Price: 15.05 Smart Investing & Trading Score: 58 | |
| Day Percent Change: 0.74% Day Change: 0.11 | |
| Week Change: 2.17% Year-to-date Change: 3.6% | |
| CXW Links: Profile News Message Board | |
| Charts:- Daily , Weekly | |
| Add CXW to Watchlist: View: Get Complete CXW Trend Analysis ➞ | |
 | PATK Patrick Industries, Inc. |
| Sector: Industrials | |
| SubSector: Lumber, Wood Production | |
| MarketCap: 565.838 Millions | |
| Recent Price: 106.31 Smart Investing & Trading Score: 58 | |
| Day Percent Change: 0.72% Day Change: 0.77 | |
| Week Change: 2.81% Year-to-date Change: 5.9% | |
| PATK Links: Profile News Message Board | |
| Charts:- Daily , Weekly | |
| Add PATK to Watchlist: View: Get Complete PATK Trend Analysis ➞ | |
| For tabular summary view of above stock list: Summary View ➞ 0 - 25 , 25 - 50 , 50 - 75 , 75 - 100 , 100 - 125 , 125 - 150 , 150 - 175 , 175 - 200 , 200 - 225 , 225 - 250 , 250 - 275 , 275 - 300 , 300 - 325 , 325 - 350 , 350 - 375 , 375 - 400 , 400 - 425 , 425 - 450 , 450 - 475 , 475 - 500 , 500 - 525 , 525 - 550 , 550 - 575 , 575 - 600 , 600 - 625 , 625 - 650 , 650 - 675 , 675 - 700 , 700 - 725 , 725 - 750 , 750 - 775 , 775 - 800 , 800 - 825 , 825 - 850 , 850 - 875 , 875 - 900 , 900 - 925 , 925 - 950 , 950 - 975 , 975 - 1000 , 1000 - 1025 , 1025 - 1050 , 1050 - 1075 , 1075 - 1100 , 1100 - 1125 , 1125 - 1150 , 1150 - 1175 , 1175 - 1200 , 1200 - 1225 , 1225 - 1250 , 1250 - 1275 , 1275 - 1300 , 1300 - 1325 , 1325 - 1350 , 1350 - 1375 | ||
| Click To Change The Sort Order: By Market Cap or Company Size Performance: Year-to-date, Week and Day | |
| Select Chart Type: | ||
| Too many stocks? View smallcap stocks filtered by marketcap & sector |
| Marketcap: All SmallCap Stocks (default-no microcap), Large, Mid-Range, Small & MicroCap |
| Sector: Tech, Finance, Energy, Staples, Retail, Industrial, Materials, Utilities & Medical |
|
Best Stocks Today 12Stocks.com |
© 2024 12Stocks.com Terms & Conditions Privacy Contact Us
All Information Provided Only For Education And Not To Be Used For Investing or Trading. See Terms & Conditions


One More Thing ... Get Best Stocks Delivered Daily!
Never Ever Miss A Move With Our Top Ten Stocks Lists
Find Best Stocks In Any Market - Bull or Bear Market
Take A Peek At Our Top Ten Stocks Lists: Daily, Weekly, Year-to-Date & Top Trends
Find Best Stocks In Any Market - Bull or Bear Market
Take A Peek At Our Top Ten Stocks Lists: Daily, Weekly, Year-to-Date & Top Trends
Smallcap Stocks With Best Up Trends [0-bearish to 100-bullish]: Riot Blockchain[100], Payoneer Global[100], Gannett Co[100], Vertex Energy[100], Cricut [100], Piedmont Office[100], Badger Meter[100], Liberty Latin[100], Napco Security[100], Mercury General[100], BancFirst [100]
Best Smallcap Stocks Year-to-Date:
Janux [365.24%], Viking [246.13%], Longboard [219.64%], Super Micro[167.81%], Vera [163.02%], Hippo [129.8%], MicroStrategy [113.41%], Sana [99.27%], Verde Clean[97%], Dyne [90.56%], SoundHound AI[89.95%] Best Smallcap Stocks This Week:
Matterport [166.95%], ProKidney [31.37%], Riot Blockchain[31.11%], Cipher Mining[23.83%], Hibbett Sports[21.03%], BigBear.ai [18.62%], Prime Medicine[15.3%], Marathon Patent[15.21%], MicroStrategy [14.8%], SoundHound AI[14.51%], Stem [13.55%] Best Smallcap Stocks Daily:
Hibbett Sports[18.78%], Marathon Patent[17.38%], SES AI[16.52%], FuelCell Energy[13.40%], Heron [11.39%], BigBear.ai [10.26%], Digital Turbine[10.22%], Aceto [9.50%], HealthStream [9.12%], Prime Medicine[8.79%], BioLife Solutions[8.72%]