
 Login Sign Up


| |||||
 |  | ||||

| 12Stocks.com Market Intelligence |
Best SmallCap Stocks
|
| In a hurry? Small Cap Stock Lists: Performance Trends Table, Stock Charts
Sort Small Cap stocks: Daily, Weekly, Year-to-Date, Market Cap & Trends. Filter Small Cap stocks list by sector: Show all, Tech, Finance, Energy, Staples, Retail, Industrial, Materials, Utilities and HealthCare Filter Small Cap stocks list by size: All Large Medium Small and MicroCap |
| 12Stocks.com Small Cap Stocks Performances & Trends Daily | |||||||||
|
|  The overall Smart Investing & Trading Score is 23 (0-bearish to 100-bullish) which puts Small Cap index in short term bearish to neutral trend. The Smart Investing & Trading Score from previous trading session is 13 and hence an improvement of trend.
| ||||||||
Here are the Smart Investing & Trading Scores of the most requested small cap stocks at 12Stocks.com (click stock name for detailed review):
|


| 12Stocks.com: Investing in Smallcap Index with Stocks | |
|
The following table helps investors and traders sort through current performance and trends (as measured by Smart Investing & Trading Score) of various
stocks in the Smallcap Index. Quick View: Move mouse or cursor over stock symbol (ticker) to view short-term technical chart and over stock name to view long term chart. Click on  to add stock symbol to your watchlist and to add stock symbol to your watchlist and  to view watchlist. Click on any ticker or stock name for detailed market intelligence report for that stock. to view watchlist. Click on any ticker or stock name for detailed market intelligence report for that stock. |
12Stocks.com Performance of Stocks in Smallcap Index
| Ticker | Stock Name | Watchlist | Category | Recent Price | Smart Investing & Trading Score | Change % | YTD Change% |
| FIP | FTAI Infrastructure |   | Industrials | 6.70 | 60 | 2.37% | 72.11% |
| JRVR | James River | | Financials | 9.21 | 59 | 5.62% | -0.32% |
| FNKO | Funko | | Consumer Staples | 6.03 | 59 | 5.60% | -21.99% |
| SPTN | SpartanNash | | Consumer Staples | 19.22 | 59 | 0.89% | -16.25% |
| LVWR | LiveWire Group | | Services & Goods | 7.58 | 59 | -0.79% | -34.88% |
| LLAP | Terran Orbital | | Industrials | 1.35 | 59 | -6.90% | 17.90% |
| ENFN | Enfusion | | Technology | 9.26 | 59 | -0.48% | -6.12% |
| LYEL | Lyell Immunopharma | | Health Care | 2.38 | 59 | -0.21% | 21.37% |
| CIFR | Cipher Mining | | Financials | 3.71 | 58 | 8.65% | -9.85% |
| DUOL | Duolingo | | Technology | 210.24 | 58 | 8.01% | -7.74% |
| POWL | Powell Industries | | Industrials | 128.14 | 58 | 3.81% | 44.95% |
| AVDX | AvidXchange | | Technology | 11.71 | 58 | 3.17% | -5.68% |
| DAKT | Daktronics | | Technology | 9.22 | 58 | 2.90% | 8.73% |
| ACT | Enact | | Financials | 29.71 | 58 | 1.47% | 2.17% |
| EIG | Employers | | Financials | 43.10 | 58 | 1.46% | 9.39% |
| SOUN | SoundHound AI | | Technology | 4.01 | 58 | 1.26% | 87.62% |
| SLCA | U.S. Silica | | Materials | 12.68 | 58 | 1.04% | 12.11% |
| DOLE | Dole | | Consumer Staples | 11.75 | 58 | 0.95% | -4.74% |
| BLMN | Bloomin | | Services & Goods | 27.03 | 58 | 0.45% | -3.98% |
| TNET | TriNet Group | | Services & Goods | 129.50 | 58 | 0.29% | 8.89% |
| ALDX | Aldeyra | | Health Care | 3.98 | 58 | 0.25% | 13.39% |
| BOWL | Bowlero | | Services & Goods | 12.13 | 58 | 0.00% | -14.09% |
| REX | REX American | | Industrials | 55.30 | 58 | -3.24% | 16.91% |
| FTAI | Fortress Transportation | | Transports | 68.07 | 58 | -2.63% | 46.70% |
| PNRG | PrimeEnergy Resources | | Energy | 99.78 | 58 | -2.40% | -6.18% |


| Too many stocks? View smallcap stocks filtered by marketcap & sector |
| Marketcap: All SmallCap Stocks (default-no microcap), Large, Mid-Range, Small |
| Smallcap Sector: Tech, Finance, Energy, Staples, Retail, Industrial, Materials, & Medical |
|
Get the most comprehensive stock market coverage daily at 12Stocks.com ➞ Best Stocks Today ➞ Best Stocks Weekly ➞ Best Stocks Year-to-Date ➞ Best Stocks Trends ➞  Best Stocks Today 12Stocks.com Best Nasdaq Stocks ➞ Best S&P 500 Stocks ➞ Best Tech Stocks ➞ Best Biotech Stocks ➞ |
| Detailed Overview of SmallCap Stocks |
| SmallCap Technical Overview, Leaders & Laggards, Top SmallCap ETF Funds & Detailed SmallCap Stocks List, Charts, Trends & More |
| Smallcap: Technical Analysis, Trends & YTD Performance | |
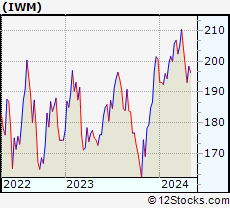
| SmallCap segment as represented by
IWM, an exchange-traded fund [ETF], holds basket of thousands of smallcap stocks from across all major sectors of the US stock market. The smallcap index (contains stocks like Riverbed & Sotheby's) is down by -3.92% and is currently underperforming the overall market by -8.11% year-to-date. Below is a quick view of technical charts and trends: | |
 IWM Weekly Chart |
|
| Long Term Trend: Not Good | |
| Medium Term Trend: Not Good | |
 IWM Daily Chart |
|
| Short Term Trend: Not Good | |
| Overall Trend Score: 23 | |
| YTD Performance: -3.92% | |
| **Trend Scores & Views Are Only For Educational Purposes And Not For Investing | |
| 12Stocks.com: Top Performing Small Cap Index Stocks | ||||||||||||||||||||||||||||||||||||||||||||||||
 The top performing Small Cap Index stocks year to date are
Now, more recently, over last week, the top performing Small Cap Index stocks on the move are


|
||||||||||||||||||||||||||||||||||||||||||||||||
| 12Stocks.com: Investing in Smallcap Index using Exchange Traded Funds | |
|
The following table shows list of key exchange traded funds (ETF) that
help investors track Smallcap index. The following list also includes leveraged ETF funds that track twice or thrice the daily returns of Smallcap indices. Short or inverse ETF funds move in the opposite direction to the index they track and are useful during market pullbacks or during bear markets. Quick View: Move mouse or cursor over ETF symbol (ticker) to view short-term technical chart and over ETF name to view long term chart. Click on ticker or stock name for detailed view. Click on to add stock symbol to your watchlist and to view watchlist. |
12Stocks.com List of ETFs that track Smallcap Index
| Ticker | ETF Name | Watchlist | Recent Price | Smart Investing & Trading Score | Change % | Week % | Year-to-date % |
| IWM | iShares Russell 2000 | | 192.84 | 23 | -0.08 | -2.94 | -3.92% |
| IJR | iShares Core S&P Small-Cap | | 102.34 | 10 | 0.21 | -2.08 | -5.46% |
| VTWO | Vanguard Russell 2000 ETF | | 77.95 | 23 | -0.13 | -2.95 | -3.88% |
| IWN | iShares Russell 2000 Value | | 146.33 | 10 | 0.21 | -2.69 | -5.79% |
| IJS | iShares S&P Small-Cap 600 Value | | 94.51 | 18 | 0.41 | -1.73 | -8.31% |
| IWO | iShares Russell 2000 Growth | | 246.94 | 36 | -0.44 | -3.3 | -2.09% |
| IJT | iShares S&P Small-Cap 600 Growth | | 121.57 | 13 | -0.22 | -2.57 | -2.85% |
| XSLV | PowerShares S&P SmallCap Low Volatil ETF | | 41.65 | 25 | 0.56 | -1.05 | -5.66% |
| SAA | ProShares Ultra SmallCap600 | | 21.62 | 10 | -0.18 | -4.17 | -13.35% |
| SMLV | SPDR SSGA US Small Cap Low Volatil ETF | | 103.83 | 10 | 0.16 | -1.13 | -7.72% |
| SBB | ProShares Short SmallCap600 | | 16.98 | 100 | 0.77 | 2.62 | 6.59% |
| SDD | ProShares UltraShort SmallCap600 | | 20.69 | 95 | 0.44 | 4.33 | 12.28% |
| 12Stocks.com: Charts, Trends, Fundamental Data and Performances of SmallCap Stocks | |
|
We now take in-depth look at all SmallCap stocks including charts, multi-period performances and overall trends (as measured by Smart Investing & Trading Score). One can sort SmallCap stocks (click link to choose) by Daily, Weekly and by Year-to-Date performances. Also, one can sort by size of the company or by market capitalization. |
| Select Your Default Chart Type: | |||||
| |||||
| Click on stock symbol or name for detailed view. Click on to add stock symbol to your watchlist and to view watchlist. Quick View: Move mouse or cursor over "Daily" to quickly view daily technical stock chart and over "Weekly" to view weekly technical stock chart. | |||||

 | FIP FTAI Infrastructure Inc. |
| Sector: Industrials | |
| SubSector: Industrials | |
| MarketCap: 368 Millions | |
| Recent Price: 6.70 Smart Investing & Trading Score: 60 | |
| Day Percent Change: 2.37% Day Change: 0.16 | |
| Week Change: 4.12% Year-to-date Change: 72.1% | |
| FIP Links: Profile News Message Board | |
| Charts:- Daily , Weekly | |
| Add FIP to Watchlist: View: Get Complete FIP Trend Analysis ➞ | |
 | JRVR James River Group Holdings, Ltd. |
| Sector: Financials | |
| SubSector: Property & Casualty Insurance | |
| MarketCap: 978.312 Millions | |
| Recent Price: 9.21 Smart Investing & Trading Score: 59 | |
| Day Percent Change: 5.62% Day Change: 0.49 | |
| Week Change: 8.87% Year-to-date Change: -0.3% | |
| JRVR Links: Profile News Message Board | |
| Charts:- Daily , Weekly | |
| Add JRVR to Watchlist: View: Get Complete JRVR Trend Analysis ➞ | |
 | FNKO Funko, Inc. |
| Sector: Consumer Staples | |
| SubSector: Toys & Games | |
| MarketCap: 246.38 Millions | |
| Recent Price: 6.03 Smart Investing & Trading Score: 59 | |
| Day Percent Change: 5.60% Day Change: 0.32 | |
| Week Change: 3.97% Year-to-date Change: -22.0% | |
| FNKO Links: Profile News Message Board | |
| Charts:- Daily , Weekly | |
| Add FNKO to Watchlist: View: Get Complete FNKO Trend Analysis ➞ | |
 | SPTN SpartanNash Company |
| Sector: Consumer Staples | |
| SubSector: Food Wholesale | |
| MarketCap: 671.229 Millions | |
| Recent Price: 19.22 Smart Investing & Trading Score: 59 | |
| Day Percent Change: 0.89% Day Change: 0.17 | |
| Week Change: 2.62% Year-to-date Change: -16.3% | |
| SPTN Links: Profile News Message Board | |
| Charts:- Daily , Weekly | |
| Add SPTN to Watchlist: View: Get Complete SPTN Trend Analysis ➞ | |
 | LVWR LiveWire Group, Inc. |
| Sector: Services & Goods | |
| SubSector: Auto Manufacturers | |
| MarketCap: 2400 Millions | |
| Recent Price: 7.58 Smart Investing & Trading Score: 59 | |
| Day Percent Change: -0.79% Day Change: -0.06 | |
| Week Change: 3.27% Year-to-date Change: -34.9% | |
| LVWR Links: Profile News Message Board | |
| Charts:- Daily , Weekly | |
| Add LVWR to Watchlist: View: Get Complete LVWR Trend Analysis ➞ | |
 | LLAP Terran Orbital Corporation |
| Sector: Industrials | |
| SubSector: Aerospace & Defense | |
| MarketCap: 206 Millions | |
| Recent Price: 1.35 Smart Investing & Trading Score: 59 | |
| Day Percent Change: -6.90% Day Change: -0.10 | |
| Week Change: -8.16% Year-to-date Change: 17.9% | |
| LLAP Links: Profile News Message Board | |
| Charts:- Daily , Weekly | |
| Add LLAP to Watchlist: View: Get Complete LLAP Trend Analysis ➞ | |
 | ENFN Enfusion, Inc. |
| Sector: Technology | |
| SubSector: Software - Application | |
| MarketCap: 1290 Millions | |
| Recent Price: 9.26 Smart Investing & Trading Score: 59 | |
| Day Percent Change: -0.48% Day Change: -0.04 | |
| Week Change: -3.29% Year-to-date Change: -6.1% | |
| ENFN Links: Profile News Message Board | |
| Charts:- Daily , Weekly | |
| Add ENFN to Watchlist: View: Get Complete ENFN Trend Analysis ➞ | |
 | LYEL Lyell Immunopharma, Inc. |
| Sector: Health Care | |
| SubSector: Biotechnology | |
| MarketCap: 809 Millions | |
| Recent Price: 2.38 Smart Investing & Trading Score: 59 | |
| Day Percent Change: -0.21% Day Change: -0.01 | |
| Week Change: -20.76% Year-to-date Change: 21.4% | |
| LYEL Links: Profile News Message Board | |
| Charts:- Daily , Weekly | |
| Add LYEL to Watchlist: View: Get Complete LYEL Trend Analysis ➞ | |
 | CIFR Cipher Mining Inc. |
| Sector: Financials | |
| SubSector: Capital Markets | |
| MarketCap: 712 Millions | |
| Recent Price: 3.71 Smart Investing & Trading Score: 58 | |
| Day Percent Change: 8.65% Day Change: 0.29 | |
| Week Change: -3.14% Year-to-date Change: -9.9% | |
| CIFR Links: Profile News Message Board | |
| Charts:- Daily , Weekly | |
| Add CIFR to Watchlist: View: Get Complete CIFR Trend Analysis ➞ | |
 | DUOL Duolingo, Inc. |
| Sector: Technology | |
| SubSector: Software - Application | |
| MarketCap: 6070 Millions | |
| Recent Price: 210.24 Smart Investing & Trading Score: 58 | |
| Day Percent Change: 8.01% Day Change: 15.60 | |
| Week Change: -0.38% Year-to-date Change: -7.7% | |
| DUOL Links: Profile News Message Board | |
| Charts:- Daily , Weekly | |
| Add DUOL to Watchlist: View: Get Complete DUOL Trend Analysis ➞ | |
 | POWL Powell Industries, Inc. |
| Sector: Industrials | |
| SubSector: Diversified Machinery | |
| MarketCap: 257.216 Millions | |
| Recent Price: 128.14 Smart Investing & Trading Score: 58 | |
| Day Percent Change: 3.81% Day Change: 4.70 | |
| Week Change: 1.74% Year-to-date Change: 45.0% | |
| POWL Links: Profile News Message Board | |
| Charts:- Daily , Weekly | |
| Add POWL to Watchlist: View: Get Complete POWL Trend Analysis ➞ | |
 | AVDX AvidXchange Holdings, Inc. |
| Sector: Technology | |
| SubSector: Software - Infrastructure | |
| MarketCap: 2120 Millions | |
| Recent Price: 11.71 Smart Investing & Trading Score: 58 | |
| Day Percent Change: 3.17% Day Change: 0.36 | |
| Week Change: 0.6% Year-to-date Change: -5.7% | |
| AVDX Links: Profile News Message Board | |
| Charts:- Daily , Weekly | |
| Add AVDX to Watchlist: View: Get Complete AVDX Trend Analysis ➞ | |
 | DAKT Daktronics, Inc. |
| Sector: Technology | |
| SubSector: Computer Based Systems | |
| MarketCap: 223.539 Millions | |
| Recent Price: 9.22 Smart Investing & Trading Score: 58 | |
| Day Percent Change: 2.90% Day Change: 0.26 | |
| Week Change: -2.74% Year-to-date Change: 8.7% | |
| DAKT Links: Profile News Message Board | |
| Charts:- Daily , Weekly | |
| Add DAKT to Watchlist: View: Get Complete DAKT Trend Analysis ➞ | |
 | ACT Enact Holdings, Inc. |
| Sector: Financials | |
| SubSector: Insurance - Specialty | |
| MarketCap: 4010 Millions | |
| Recent Price: 29.71 Smart Investing & Trading Score: 58 | |
| Day Percent Change: 1.47% Day Change: 0.43 | |
| Week Change: 0.41% Year-to-date Change: 2.2% | |
| ACT Links: Profile News Message Board | |
| Charts:- Daily , Weekly | |
| Add ACT to Watchlist: View: Get Complete ACT Trend Analysis ➞ | |
 | EIG Employers Holdings, Inc. |
| Sector: Financials | |
| SubSector: Accident & Health Insurance | |
| MarketCap: 1202.6 Millions | |
| Recent Price: 43.10 Smart Investing & Trading Score: 58 | |
| Day Percent Change: 1.46% Day Change: 0.62 | |
| Week Change: 1.15% Year-to-date Change: 9.4% | |
| EIG Links: Profile News Message Board | |
| Charts:- Daily , Weekly | |
| Add EIG to Watchlist: View: Get Complete EIG Trend Analysis ➞ | |
 | SOUN SoundHound AI, Inc. |
| Sector: Technology | |
| SubSector: Software - Application | |
| MarketCap: 1040 Millions | |
| Recent Price: 4.01 Smart Investing & Trading Score: 58 | |
| Day Percent Change: 1.26% Day Change: 0.05 | |
| Week Change: -8.33% Year-to-date Change: 87.6% | |
| SOUN Links: Profile News Message Board | |
| Charts:- Daily , Weekly | |
| Add SOUN to Watchlist: View: Get Complete SOUN Trend Analysis ➞ | |
 | SLCA U.S. Silica Holdings, Inc. |
| Sector: Materials | |
| SubSector: Industrial Metals & Minerals | |
| MarketCap: 93 Millions | |
| Recent Price: 12.68 Smart Investing & Trading Score: 58 | |
| Day Percent Change: 1.04% Day Change: 0.13 | |
| Week Change: -1.71% Year-to-date Change: 12.1% | |
| SLCA Links: Profile News Message Board | |
| Charts:- Daily , Weekly | |
| Add SLCA to Watchlist: View: Get Complete SLCA Trend Analysis ➞ | |
 | DOLE Dole plc |
| Sector: Consumer Staples | |
| SubSector: Farm Products | |
| MarketCap: 1300 Millions | |
| Recent Price: 11.75 Smart Investing & Trading Score: 58 | |
| Day Percent Change: 0.95% Day Change: 0.11 | |
| Week Change: 0.69% Year-to-date Change: -4.7% | |
| DOLE Links: Profile News Message Board | |
| Charts:- Daily , Weekly | |
| Add DOLE to Watchlist: View: Get Complete DOLE Trend Analysis ➞ | |
 | BLMN Bloomin Brands, Inc. |
| Sector: Services & Goods | |
| SubSector: Restaurants | |
| MarketCap: 503.47 Millions | |
| Recent Price: 27.03 Smart Investing & Trading Score: 58 | |
| Day Percent Change: 0.45% Day Change: 0.12 | |
| Week Change: 1.96% Year-to-date Change: -4.0% | |
| BLMN Links: Profile News Message Board | |
| Charts:- Daily , Weekly | |
| Add BLMN to Watchlist: View: Get Complete BLMN Trend Analysis ➞ | |
 | TNET TriNet Group, Inc. |
| Sector: Services & Goods | |
| SubSector: Business Services | |
| MarketCap: 2648.72 Millions | |
| Recent Price: 129.50 Smart Investing & Trading Score: 58 | |
| Day Percent Change: 0.29% Day Change: 0.38 | |
| Week Change: 1.13% Year-to-date Change: 8.9% | |
| TNET Links: Profile News Message Board | |
| Charts:- Daily , Weekly | |
| Add TNET to Watchlist: View: Get Complete TNET Trend Analysis ➞ | |
 | ALDX Aldeyra Therapeutics, Inc. |
| Sector: Health Care | |
| SubSector: Biotechnology | |
| MarketCap: 61.2785 Millions | |
| Recent Price: 3.98 Smart Investing & Trading Score: 58 | |
| Day Percent Change: 0.25% Day Change: 0.01 | |
| Week Change: -6.35% Year-to-date Change: 13.4% | |
| ALDX Links: Profile News Message Board | |
| Charts:- Daily , Weekly | |
| Add ALDX to Watchlist: View: Get Complete ALDX Trend Analysis ➞ | |
 | BOWL Bowlero Corp. |
| Sector: Services & Goods | |
| SubSector: Leisure | |
| MarketCap: 2000 Millions | |
| Recent Price: 12.13 Smart Investing & Trading Score: 58 | |
| Day Percent Change: 0.00% Day Change: 0.00 | |
| Week Change: -1.7% Year-to-date Change: -14.1% | |
| BOWL Links: Profile News Message Board | |
| Charts:- Daily , Weekly | |
| Add BOWL to Watchlist: View: Get Complete BOWL Trend Analysis ➞ | |
 | REX REX American Resources Corporation |
| Sector: Industrials | |
| SubSector: Conglomerates | |
| MarketCap: 373.748 Millions | |
| Recent Price: 55.30 Smart Investing & Trading Score: 58 | |
| Day Percent Change: -3.24% Day Change: -1.85 | |
| Week Change: -2.5% Year-to-date Change: 16.9% | |
| REX Links: Profile News Message Board | |
| Charts:- Daily , Weekly | |
| Add REX to Watchlist: View: Get Complete REX Trend Analysis ➞ | |
 | FTAI Fortress Transportation and Infrastructure Investors LLC |
| Sector: Transports | |
| SubSector: Rental & Leasing Services | |
| MarketCap: 758.344 Millions | |
| Recent Price: 68.07 Smart Investing & Trading Score: 58 | |
| Day Percent Change: -2.63% Day Change: -1.84 | |
| Week Change: -5.13% Year-to-date Change: 46.7% | |
| FTAI Links: Profile News Message Board | |
| Charts:- Daily , Weekly | |
| Add FTAI to Watchlist: View: Get Complete FTAI Trend Analysis ➞ | |
 | PNRG PrimeEnergy Resources Corporation |
| Sector: Energy | |
| SubSector: Independent Oil & Gas | |
| MarketCap: 112.593 Millions | |
| Recent Price: 99.78 Smart Investing & Trading Score: 58 | |
| Day Percent Change: -2.40% Day Change: -2.45 | |
| Week Change: -0.31% Year-to-date Change: -6.2% | |
| PNRG Links: Profile News Message Board | |
| Charts:- Daily , Weekly | |
| Add PNRG to Watchlist: View: Get Complete PNRG Trend Analysis ➞ | |
| Too many stocks? View smallcap stocks filtered by marketcap & sector |
| Marketcap: All SmallCap Stocks (default-no microcap), Large, Mid-Range, Small & MicroCap |
| Sector: Tech, Finance, Energy, Staples, Retail, Industrial, Materials, Utilities & Medical |
|
Best Stocks Today 12Stocks.com |
© 2024 12Stocks.com Terms & Conditions Privacy Contact Us
All Information Provided Only For Education And Not To Be Used For Investing or Trading. See Terms & Conditions


One More Thing ... Get Best Stocks Delivered Daily!
Never Ever Miss A Move With Our Top Ten Stocks Lists
Find Best Stocks In Any Market - Bull or Bear Market
Take A Peek At Our Top Ten Stocks Lists: Daily, Weekly, Year-to-Date & Top Trends
Find Best Stocks In Any Market - Bull or Bear Market
Take A Peek At Our Top Ten Stocks Lists: Daily, Weekly, Year-to-Date & Top Trends
Smallcap Stocks With Best Up Trends [0-bearish to 100-bullish]: Badger Meter[100], Cullinan Oncology[100], Oscar Health[100], NextNav [100], EchoStar [100], Victory Capital[100], Macatawa Bank[100], IMAX [100], Envestnet [100], ALX Oncology[100], Argan [95]
Best Smallcap Stocks Year-to-Date:
Agenus [500.31%], CareMax [417.53%], Janux [348.12%], Viking [247.5%], Alpine Immune[238.5%], Super Micro[226.63%], Longboard [194.76%], Arcutis Bio[192.57%], Vera [161.3%], Avidity Biosciences[154.87%], Hippo [128.32%] Best Smallcap Stocks This Week:
Macatawa Bank[44.42%], 23andMe Holding[33.3%], ProKidney [32%], Snap One[29.73%], Vertex Energy[25.96%], ALX Oncology[20.64%], Vanda [20.63%], Expensify [18.37%], Badger Meter[16.72%], ContextLogic [15%], Cullinan Oncology[13.89%] Best Smallcap Stocks Daily:
23andMe Holding[65.91%], Vertex Energy[33.78%], Zura Bio[17.20%], Badger Meter[16.65%], ContextLogic [15.81%], Expensify [15.23%], Montrose Environmental[12.84%], Vaxxinity [10.05%], Cipher Mining[8.65%], FiscalNote [8.61%], Vuzix [8.15%]