
 Login Sign Up


| |||||
 |  | ||||

| 12Stocks.com Market Intelligence |
Best SmallCap Stocks
|
| In a hurry? Small Cap Stock Lists: Performance Trends Table, Stock Charts
Sort Small Cap stocks: Daily, Weekly, Year-to-Date, Market Cap & Trends. Filter Small Cap stocks list by sector: Show all, Tech, Finance, Energy, Staples, Retail, Industrial, Materials, Utilities and HealthCare Filter Small Cap stocks list by size: All Large Medium Small and MicroCap |
| 12Stocks.com Small Cap Stocks Performances & Trends Daily | |||||||||
|
|  The overall Smart Investing & Trading Score is 23 (0-bearish to 100-bullish) which puts Small Cap index in short term bearish to neutral trend. The Smart Investing & Trading Score from previous trading session is 13 and hence an improvement of trend.
| ||||||||
Here are the Smart Investing & Trading Scores of the most requested small cap stocks at 12Stocks.com (click stock name for detailed review):
|


| 12Stocks.com: Investing in Smallcap Index with Stocks | |
|
The following table helps investors and traders sort through current performance and trends (as measured by Smart Investing & Trading Score) of various
stocks in the Smallcap Index. Quick View: Move mouse or cursor over stock symbol (ticker) to view short-term technical chart and over stock name to view long term chart. Click on  to add stock symbol to your watchlist and to add stock symbol to your watchlist and  to view watchlist. Click on any ticker or stock name for detailed market intelligence report for that stock. to view watchlist. Click on any ticker or stock name for detailed market intelligence report for that stock. |
12Stocks.com Performance of Stocks in Smallcap Index
| Ticker | Stock Name | Watchlist | Category | Recent Price | Smart Investing & Trading Score | Change % | YTD Change% |
| NWBI | Northwest Bancshares |   | Financials | 10.80 | 17 | 0.84% | -13.46% |
| LZB | La-Z-Boy | | Consumer Staples | 32.98 | 17 | 0.83% | -10.67% |
| JBGS | JBG SMITH | | Financials | 14.63 | 17 | 0.83% | -13.99% |
| FG | F&G Annuities | | Financials | 35.59 | 17 | 0.82% | -22.81% |
| IBEX | IBEX | | Technology | 13.19 | 17 | 0.80% | -30.53% |
| AMWL | American Well | | Health Care | 0.52 | 17 | 0.78% | -65.24% |
| NBHC | National Bank | | Financials | 32.82 | 17 | 0.74% | -11.75% |
| GPMT | Granite Point | | Financials | 4.31 | 17 | 0.70% | -27.44% |
| ESNT | Essent Group | | Financials | 52.67 | 17 | 0.65% | -0.13% |
| TDUP | ThredUp | | Services & Goods | 1.54 | 17 | 0.65% | -31.86% |
| IIIN | Insteel Industries | | Materials | 32.95 | 17 | 0.63% | -13.93% |
| VERV | Verve | | Health Care | 6.78 | 17 | 0.59% | -51.42% |
| CVRX | CVRx | | Health Care | 15.83 | 17 | 0.51% | -49.68% |
| PPBI | Pacific Premier | | Financials | 21.33 | 17 | 0.42% | -26.73% |
| SHLS | Shoals | | Technology | 8.31 | 17 | 0.42% | -46.35% |
| FCPT | Four Corners | | Financials | 22.66 | 17 | 0.40% | -10.43% |
| RMR | RMR Group | | Financials | 23.34 | 17 | 0.39% | -17.32% |
| MASS | 908 Devices | | Health Care | 5.61 | 17 | 0.36% | -49.91% |
| CTKB | Cytek Biosciences | | Health Care | 5.95 | 17 | 0.34% | -35.29% |
| ATGE | Adtalem Global | | Services & Goods | 46.14 | 17 | 0.33% | -21.73% |
| PDLB | PDL Community | | Financials | 8.00 | 17 | 0.25% | -18.03% |
| OFG | OFG Bancorp | | Financials | 33.44 | 17 | 0.21% | -10.78% |
| AURA | Aura Biosciences | | Health Care | 7.05 | 17 | 0.21% | -20.28% |
| PRVA | Privia Health | | Health Care | 17.86 | 17 | 0.14% | -24.42% |
| BRZE | Braze | | Technology | 39.54 | 17 | 0.10% | -25.73% |


| Too many stocks? View smallcap stocks filtered by marketcap & sector |
| Marketcap: All SmallCap Stocks (default-no microcap), Large, Mid-Range, Small |
| Smallcap Sector: Tech, Finance, Energy, Staples, Retail, Industrial, Materials, & Medical |
|
Get the most comprehensive stock market coverage daily at 12Stocks.com ➞ Best Stocks Today ➞ Best Stocks Weekly ➞ Best Stocks Year-to-Date ➞ Best Stocks Trends ➞  Best Stocks Today 12Stocks.com Best Nasdaq Stocks ➞ Best S&P 500 Stocks ➞ Best Tech Stocks ➞ Best Biotech Stocks ➞ |
| Detailed Overview of SmallCap Stocks |
| SmallCap Technical Overview, Leaders & Laggards, Top SmallCap ETF Funds & Detailed SmallCap Stocks List, Charts, Trends & More |
| Smallcap: Technical Analysis, Trends & YTD Performance | |
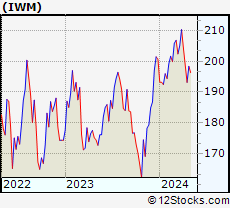
| SmallCap segment as represented by
IWM, an exchange-traded fund [ETF], holds basket of thousands of smallcap stocks from across all major sectors of the US stock market. The smallcap index (contains stocks like Riverbed & Sotheby's) is down by -3.92% and is currently underperforming the overall market by -8.11% year-to-date. Below is a quick view of technical charts and trends: | |
 IWM Weekly Chart |
|
| Long Term Trend: Not Good | |
| Medium Term Trend: Not Good | |
 IWM Daily Chart |
|
| Short Term Trend: Not Good | |
| Overall Trend Score: 23 | |
| YTD Performance: -3.92% | |
| **Trend Scores & Views Are Only For Educational Purposes And Not For Investing | |
| 12Stocks.com: Top Performing Small Cap Index Stocks | ||||||||||||||||||||||||||||||||||||||||||||||||
 The top performing Small Cap Index stocks year to date are
Now, more recently, over last week, the top performing Small Cap Index stocks on the move are


|
||||||||||||||||||||||||||||||||||||||||||||||||
| 12Stocks.com: Investing in Smallcap Index using Exchange Traded Funds | |
|
The following table shows list of key exchange traded funds (ETF) that
help investors track Smallcap index. The following list also includes leveraged ETF funds that track twice or thrice the daily returns of Smallcap indices. Short or inverse ETF funds move in the opposite direction to the index they track and are useful during market pullbacks or during bear markets. Quick View: Move mouse or cursor over ETF symbol (ticker) to view short-term technical chart and over ETF name to view long term chart. Click on ticker or stock name for detailed view. Click on to add stock symbol to your watchlist and to view watchlist. |
12Stocks.com List of ETFs that track Smallcap Index
| Ticker | ETF Name | Watchlist | Recent Price | Smart Investing & Trading Score | Change % | Week % | Year-to-date % |
| IWM | iShares Russell 2000 | | 192.84 | 23 | -0.08 | -2.94 | -3.92% |
| IJR | iShares Core S&P Small-Cap | | 102.31 | 31 | 0.18 | -2.11 | -5.49% |
| VTWO | Vanguard Russell 2000 ETF | | 77.94 | 23 | -0.14 | -2.96 | -3.9% |
| IWN | iShares Russell 2000 Value | | 146.23 | 10 | 0.14 | -2.76 | -5.86% |
| IJS | iShares S&P Small-Cap 600 Value | | 94.57 | 10 | 0.48 | -1.66 | -8.25% |
| IWO | iShares Russell 2000 Growth | | 246.94 | 36 | -0.44 | -3.3 | -2.09% |
| IJT | iShares S&P Small-Cap 600 Growth | | 121.59 | 23 | -0.21 | -2.56 | -2.84% |
| XSLV | PowerShares S&P SmallCap Low Volatil ETF | | 41.65 | 25 | 0.56 | -1.05 | -5.66% |
| SAA | ProShares Ultra SmallCap600 | | 21.57 | 10 | -0.42 | -4.39 | -13.55% |
| SMLV | SPDR SSGA US Small Cap Low Volatil ETF | | 103.83 | 18 | 0.16 | -1.13 | -7.72% |
| SBB | ProShares Short SmallCap600 | | 16.77 | 80 | -0.50 | 1.32 | 5.24% |
| SDD | ProShares UltraShort SmallCap600 | | 20.16 | 73 | -2.14 | 1.66 | 9.41% |
| 12Stocks.com: Charts, Trends, Fundamental Data and Performances of SmallCap Stocks | |
|
We now take in-depth look at all SmallCap stocks including charts, multi-period performances and overall trends (as measured by Smart Investing & Trading Score). One can sort SmallCap stocks (click link to choose) by Daily, Weekly and by Year-to-Date performances. Also, one can sort by size of the company or by market capitalization. |
| Select Your Default Chart Type: | |||||
| |||||
| Click on stock symbol or name for detailed view. Click on to add stock symbol to your watchlist and to view watchlist. Quick View: Move mouse or cursor over "Daily" to quickly view daily technical stock chart and over "Weekly" to view weekly technical stock chart. | |||||

 | NWBI Northwest Bancshares, Inc. |
| Sector: Financials | |
| SubSector: Savings & Loans | |
| MarketCap: 1266.3 Millions | |
| Recent Price: 10.80 Smart Investing & Trading Score: 17 | |
| Day Percent Change: 0.84% Day Change: 0.09 | |
| Week Change: -0.18% Year-to-date Change: -13.5% | |
| NWBI Links: Profile News Message Board | |
| Charts:- Daily , Weekly | |
| Add NWBI to Watchlist: View: Get Complete NWBI Trend Analysis ➞ | |
 | LZB La-Z-Boy Incorporated |
| Sector: Consumer Staples | |
| SubSector: Home Furnishings & Fixtures | |
| MarketCap: 951.635 Millions | |
| Recent Price: 32.98 Smart Investing & Trading Score: 17 | |
| Day Percent Change: 0.83% Day Change: 0.27 | |
| Week Change: -2.91% Year-to-date Change: -10.7% | |
| LZB Links: Profile News Message Board | |
| Charts:- Daily , Weekly | |
| Add LZB to Watchlist: View: Get Complete LZB Trend Analysis ➞ | |
 | JBGS JBG SMITH Properties |
| Sector: Financials | |
| SubSector: Property Management | |
| MarketCap: 4335.32 Millions | |
| Recent Price: 14.63 Smart Investing & Trading Score: 17 | |
| Day Percent Change: 0.83% Day Change: 0.12 | |
| Week Change: -4.25% Year-to-date Change: -14.0% | |
| JBGS Links: Profile News Message Board | |
| Charts:- Daily , Weekly | |
| Add JBGS to Watchlist: View: Get Complete JBGS Trend Analysis ➞ | |
 | FG F&G Annuities & Life, Inc. |
| Sector: Financials | |
| SubSector: Insurance - Life | |
| MarketCap: 2960 Millions | |
| Recent Price: 35.59 Smart Investing & Trading Score: 17 | |
| Day Percent Change: 0.82% Day Change: 0.29 | |
| Week Change: -3.05% Year-to-date Change: -22.8% | |
| FG Links: Profile News Message Board | |
| Charts:- Daily , Weekly | |
| Add FG to Watchlist: View: Get Complete FG Trend Analysis ➞ | |
 | IBEX IBEX Limited |
| Sector: Technology | |
| SubSector: Software Application | |
| MarketCap: 37787 Millions | |
| Recent Price: 13.19 Smart Investing & Trading Score: 17 | |
| Day Percent Change: 0.80% Day Change: 0.11 | |
| Week Change: -6.49% Year-to-date Change: -30.5% | |
| IBEX Links: Profile News Message Board | |
| Charts:- Daily , Weekly | |
| Add IBEX to Watchlist: View: Get Complete IBEX Trend Analysis ➞ | |
 | AMWL American Well Corporation |
| Sector: Health Care | |
| SubSector: Health Information Services | |
| MarketCap: 71987 Millions | |
| Recent Price: 0.52 Smart Investing & Trading Score: 17 | |
| Day Percent Change: 0.78% Day Change: 0.00 | |
| Week Change: -9.98% Year-to-date Change: -65.2% | |
| AMWL Links: Profile News Message Board | |
| Charts:- Daily , Weekly | |
| Add AMWL to Watchlist: View: Get Complete AMWL Trend Analysis ➞ | |
 | NBHC National Bank Holdings Corporation |
| Sector: Financials | |
| SubSector: Regional - Midwest Banks | |
| MarketCap: 766.87 Millions | |
| Recent Price: 32.82 Smart Investing & Trading Score: 17 | |
| Day Percent Change: 0.74% Day Change: 0.24 | |
| Week Change: -1.11% Year-to-date Change: -11.8% | |
| NBHC Links: Profile News Message Board | |
| Charts:- Daily , Weekly | |
| Add NBHC to Watchlist: View: Get Complete NBHC Trend Analysis ➞ | |
 | GPMT Granite Point Mortgage Trust Inc. |
| Sector: Financials | |
| SubSector: Mortgage Investment | |
| MarketCap: 289.739 Millions | |
| Recent Price: 4.31 Smart Investing & Trading Score: 17 | |
| Day Percent Change: 0.70% Day Change: 0.03 | |
| Week Change: -2.49% Year-to-date Change: -27.4% | |
| GPMT Links: Profile News Message Board | |
| Charts:- Daily , Weekly | |
| Add GPMT to Watchlist: View: Get Complete GPMT Trend Analysis ➞ | |
 | ESNT Essent Group Ltd. |
| Sector: Financials | |
| SubSector: Mortgage Investment | |
| MarketCap: 2806.19 Millions | |
| Recent Price: 52.67 Smart Investing & Trading Score: 17 | |
| Day Percent Change: 0.65% Day Change: 0.34 | |
| Week Change: -1.84% Year-to-date Change: -0.1% | |
| ESNT Links: Profile News Message Board | |
| Charts:- Daily , Weekly | |
| Add ESNT to Watchlist: View: Get Complete ESNT Trend Analysis ➞ | |
 | TDUP ThredUp Inc. |
| Sector: Services & Goods | |
| SubSector: Internet Retail | |
| MarketCap: 258 Millions | |
| Recent Price: 1.54 Smart Investing & Trading Score: 17 | |
| Day Percent Change: 0.65% Day Change: 0.01 | |
| Week Change: -7.78% Year-to-date Change: -31.9% | |
| TDUP Links: Profile News Message Board | |
| Charts:- Daily , Weekly | |
| Add TDUP to Watchlist: View: Get Complete TDUP Trend Analysis ➞ | |
 | IIIN Insteel Industries, Inc. |
| Sector: Materials | |
| SubSector: Steel & Iron | |
| MarketCap: 269.488 Millions | |
| Recent Price: 32.95 Smart Investing & Trading Score: 17 | |
| Day Percent Change: 0.63% Day Change: 0.20 | |
| Week Change: -4.26% Year-to-date Change: -13.9% | |
| IIIN Links: Profile News Message Board | |
| Charts:- Daily , Weekly | |
| Add IIIN to Watchlist: View: Get Complete IIIN Trend Analysis ➞ | |
 | VERV Verve Therapeutics, Inc. |
| Sector: Health Care | |
| SubSector: Biotechnology | |
| MarketCap: 1200 Millions | |
| Recent Price: 6.78 Smart Investing & Trading Score: 17 | |
| Day Percent Change: 0.59% Day Change: 0.04 | |
| Week Change: -10.79% Year-to-date Change: -51.4% | |
| VERV Links: Profile News Message Board | |
| Charts:- Daily , Weekly | |
| Add VERV to Watchlist: View: Get Complete VERV Trend Analysis ➞ | |
 | CVRX CVRx, Inc. |
| Sector: Health Care | |
| SubSector: Medical Devices | |
| MarketCap: 327 Millions | |
| Recent Price: 15.83 Smart Investing & Trading Score: 17 | |
| Day Percent Change: 0.51% Day Change: 0.08 | |
| Week Change: -8.13% Year-to-date Change: -49.7% | |
| CVRX Links: Profile News Message Board | |
| Charts:- Daily , Weekly | |
| Add CVRX to Watchlist: View: Get Complete CVRX Trend Analysis ➞ | |
 | PPBI Pacific Premier Bancorp, Inc. |
| Sector: Financials | |
| SubSector: Regional - Pacific Banks | |
| MarketCap: 978.029 Millions | |
| Recent Price: 21.33 Smart Investing & Trading Score: 17 | |
| Day Percent Change: 0.42% Day Change: 0.09 | |
| Week Change: -2.42% Year-to-date Change: -26.7% | |
| PPBI Links: Profile News Message Board | |
| Charts:- Daily , Weekly | |
| Add PPBI to Watchlist: View: Get Complete PPBI Trend Analysis ➞ | |
 | SHLS Shoals Technologies Group, Inc. |
| Sector: Technology | |
| SubSector: Solar | |
| MarketCap: 4360 Millions | |
| Recent Price: 8.31 Smart Investing & Trading Score: 17 | |
| Day Percent Change: 0.42% Day Change: 0.04 | |
| Week Change: -9.32% Year-to-date Change: -46.4% | |
| SHLS Links: Profile News Message Board | |
| Charts:- Daily , Weekly | |
| Add SHLS to Watchlist: View: Get Complete SHLS Trend Analysis ➞ | |
 | FCPT Four Corners Property Trust, Inc. |
| Sector: Financials | |
| SubSector: REIT - Hotel/Motel | |
| MarketCap: 1218.94 Millions | |
| Recent Price: 22.66 Smart Investing & Trading Score: 17 | |
| Day Percent Change: 0.40% Day Change: 0.09 | |
| Week Change: -2.91% Year-to-date Change: -10.4% | |
| FCPT Links: Profile News Message Board | |
| Charts:- Daily , Weekly | |
| Add FCPT to Watchlist: View: Get Complete FCPT Trend Analysis ➞ | |
 | RMR The RMR Group Inc. |
| Sector: Financials | |
| SubSector: Real Estate Development | |
| MarketCap: 797.419 Millions | |
| Recent Price: 23.34 Smart Investing & Trading Score: 17 | |
| Day Percent Change: 0.39% Day Change: 0.09 | |
| Week Change: -2.91% Year-to-date Change: -17.3% | |
| RMR Links: Profile News Message Board | |
| Charts:- Daily , Weekly | |
| Add RMR to Watchlist: View: Get Complete RMR Trend Analysis ➞ | |
 | MASS 908 Devices Inc. |
| Sector: Health Care | |
| SubSector: Medical Devices | |
| MarketCap: 225 Millions | |
| Recent Price: 5.61 Smart Investing & Trading Score: 17 | |
| Day Percent Change: 0.36% Day Change: 0.02 | |
| Week Change: -7.58% Year-to-date Change: -49.9% | |
| MASS Links: Profile News Message Board | |
| Charts:- Daily , Weekly | |
| Add MASS to Watchlist: View: Get Complete MASS Trend Analysis ➞ | |
 | CTKB Cytek Biosciences, Inc. |
| Sector: Health Care | |
| SubSector: Medical Devices | |
| MarketCap: 1140 Millions | |
| Recent Price: 5.95 Smart Investing & Trading Score: 17 | |
| Day Percent Change: 0.34% Day Change: 0.02 | |
| Week Change: -3.57% Year-to-date Change: -35.3% | |
| CTKB Links: Profile News Message Board | |
| Charts:- Daily , Weekly | |
| Add CTKB to Watchlist: View: Get Complete CTKB Trend Analysis ➞ | |
 | ATGE Adtalem Global Education Inc. |
| Sector: Services & Goods | |
| SubSector: Education & Training Services | |
| MarketCap: 1273.86 Millions | |
| Recent Price: 46.14 Smart Investing & Trading Score: 17 | |
| Day Percent Change: 0.33% Day Change: 0.15 | |
| Week Change: -0.26% Year-to-date Change: -21.7% | |
| ATGE Links: Profile News Message Board | |
| Charts:- Daily , Weekly | |
| Add ATGE to Watchlist: View: Get Complete ATGE Trend Analysis ➞ | |
 | PDLB PDL Community Bancorp |
| Sector: Financials | |
| SubSector: REIT - Retail | |
| MarketCap: 206.114 Millions | |
| Recent Price: 8.00 Smart Investing & Trading Score: 17 | |
| Day Percent Change: 0.25% Day Change: 0.02 | |
| Week Change: -1.23% Year-to-date Change: -18.0% | |
| PDLB Links: Profile News Message Board | |
| Charts:- Daily , Weekly | |
| Add PDLB to Watchlist: View: Get Complete PDLB Trend Analysis ➞ | |
 | OFG OFG Bancorp |
| Sector: Financials | |
| SubSector: Money Center Banks | |
| MarketCap: 537.599 Millions | |
| Recent Price: 33.44 Smart Investing & Trading Score: 17 | |
| Day Percent Change: 0.21% Day Change: 0.07 | |
| Week Change: -2.71% Year-to-date Change: -10.8% | |
| OFG Links: Profile News Message Board | |
| Charts:- Daily , Weekly | |
| Add OFG to Watchlist: View: Get Complete OFG Trend Analysis ➞ | |
 | AURA Aura Biosciences, Inc. |
| Sector: Health Care | |
| SubSector: Biotechnology | |
| MarketCap: 469 Millions | |
| Recent Price: 7.05 Smart Investing & Trading Score: 17 | |
| Day Percent Change: 0.21% Day Change: 0.01 | |
| Week Change: -6.43% Year-to-date Change: -20.3% | |
| AURA Links: Profile News Message Board | |
| Charts:- Daily , Weekly | |
| Add AURA to Watchlist: View: Get Complete AURA Trend Analysis ➞ | |
 | PRVA Privia Health Group, Inc. |
| Sector: Health Care | |
| SubSector: Health Information Services | |
| MarketCap: 3130 Millions | |
| Recent Price: 17.86 Smart Investing & Trading Score: 17 | |
| Day Percent Change: 0.14% Day Change: 0.02 | |
| Week Change: -3.67% Year-to-date Change: -24.4% | |
| PRVA Links: Profile News Message Board | |
| Charts:- Daily , Weekly | |
| Add PRVA to Watchlist: View: Get Complete PRVA Trend Analysis ➞ | |
 | BRZE Braze, Inc. |
| Sector: Technology | |
| SubSector: Software - Application | |
| MarketCap: 4340 Millions | |
| Recent Price: 39.54 Smart Investing & Trading Score: 17 | |
| Day Percent Change: 0.10% Day Change: 0.04 | |
| Week Change: -5.54% Year-to-date Change: -25.7% | |
| BRZE Links: Profile News Message Board | |
| Charts:- Daily , Weekly | |
| Add BRZE to Watchlist: View: Get Complete BRZE Trend Analysis ➞ | |
| Too many stocks? View smallcap stocks filtered by marketcap & sector |
| Marketcap: All SmallCap Stocks (default-no microcap), Large, Mid-Range, Small & MicroCap |
| Sector: Tech, Finance, Energy, Staples, Retail, Industrial, Materials, Utilities & Medical |
|
Best Stocks Today 12Stocks.com |
© 2024 12Stocks.com Terms & Conditions Privacy Contact Us
All Information Provided Only For Education And Not To Be Used For Investing or Trading. See Terms & Conditions


One More Thing ... Get Best Stocks Delivered Daily!
Never Ever Miss A Move With Our Top Ten Stocks Lists
Find Best Stocks In Any Market - Bull or Bear Market
Take A Peek At Our Top Ten Stocks Lists: Daily, Weekly, Year-to-Date & Top Trends
Find Best Stocks In Any Market - Bull or Bear Market
Take A Peek At Our Top Ten Stocks Lists: Daily, Weekly, Year-to-Date & Top Trends
Smallcap Stocks With Best Up Trends [0-bearish to 100-bullish]: Badger Meter[100], Cullinan Oncology[100], Oscar Health[100], NextNav [100], Richardson Electronics[100], Seneca Foods[100], Lantheus [100], Macatawa Bank[100], Geron [100], IMAX [100], Regional Management[100]
Best Smallcap Stocks Year-to-Date:
Agenus [500.31%], CareMax [417.53%], Janux [348.12%], Viking [248.9%], Alpine Immune[238.5%], Super Micro[226.74%], Longboard [194.76%], Arcutis Bio[192.57%], Vera [161.3%], Avidity Biosciences[154.87%], Hippo [128.32%] Best Smallcap Stocks This Week:
Macatawa Bank[44.53%], 23andMe Holding[33.3%], ProKidney [32%], Snap One[29.73%], Vertex Energy[23.08%], ALX Oncology[20.64%], Vanda [20.63%], Expensify [18.37%], Badger Meter[16.69%], ContextLogic [15%], Cullinan Oncology[13.89%] Best Smallcap Stocks Daily:
23andMe Holding[65.91%], Vertex Energy[30.72%], Zura Bio[17.20%], Badger Meter[16.62%], ContextLogic [15.81%], Expensify [15.23%], Montrose Environmental[13.03%], Vaxxinity [10.05%], Vuzix [9.87%], Cipher Mining[8.65%], FiscalNote [8.61%]