
 Login Sign Up


| |||||
 |  | ||||

| 12Stocks.com Market Intelligence |
Best SmallCap Stocks
|
| In a hurry? Small Cap Stock Lists: Performance Trends Table, Stock Charts
Sort Small Cap stocks: Daily, Weekly, Year-to-Date, Market Cap & Trends. Filter Small Cap stocks list by sector: Show all, Tech, Finance, Energy, Staples, Retail, Industrial, Materials, Utilities and HealthCare Filter Small Cap stocks list by size: All Large Medium Small and MicroCap |
| 12Stocks.com Small Cap Stocks Performances & Trends Daily | |||||||||
|
|  The overall Smart Investing & Trading Score is 23 (0-bearish to 100-bullish) which puts Small Cap index in short term bearish to neutral trend. The Smart Investing & Trading Score from previous trading session is 13 and hence an improvement of trend.
| ||||||||
Here are the Smart Investing & Trading Scores of the most requested small cap stocks at 12Stocks.com (click stock name for detailed review):
|


| 12Stocks.com: Investing in Smallcap Index with Stocks | |
|
The following table helps investors and traders sort through current performance and trends (as measured by Smart Investing & Trading Score) of various
stocks in the Smallcap Index. Quick View: Move mouse or cursor over stock symbol (ticker) to view short-term technical chart and over stock name to view long term chart. Click on  to add stock symbol to your watchlist and to add stock symbol to your watchlist and  to view watchlist. Click on any ticker or stock name for detailed market intelligence report for that stock. to view watchlist. Click on any ticker or stock name for detailed market intelligence report for that stock. |
12Stocks.com Performance of Stocks in Smallcap Index
| Ticker | Stock Name | Watchlist | Category | Recent Price | Smart Investing & Trading Score | Change % | YTD Change% |
| MLP | Maui Land |   | Financials | 19.27 | 25 | 0.16% | 21.27% |
| DM | Dominion Midstream | | Energy | 0.83 | 25 | -3.71% | 10.16% |
| LPSN | LivePerson | | Technology | 0.56 | 25 | -3.49% | -85.17% |
| BW | Babcock & Wilcox Enterprises | | Industrials | 0.97 | 25 | -3.16% | -33.67% |
| AUR | Aurora Innovation | | Technology | 2.96 | 25 | -2.48% | -32.92% |
| SFIX | Stitch Fix | | Services & Goods | 2.19 | 25 | -1.79% | -38.66% |
| TRUE | TrueCar | | Technology | 2.82 | 25 | -1.74% | -18.50% |
| NEOG | Neogen | | Health Care | 11.94 | 25 | -1.65% | -40.63% |
| OPFI | OppFi | | Financials | 2.88 | 25 | -1.37% | -43.64% |
| LNZA | LanzaTech Global | | Industrials | 3.04 | 25 | -0.98% | -38.52% |
| FLNC | Fluence Energy | | Utilities | 15.87 | 25 | -0.87% | -33.65% |
| ITI | Iteris | | Technology | 4.60 | 25 | -0.86% | -11.54% |
| PRGS | Progress | | Technology | 50.18 | 25 | -0.81% | -7.59% |
| OPI | Office Properties | | Financials | 1.88 | 25 | -0.79% | -74.39% |
| UEC | Uranium Energy | | Materials | 6.83 | 25 | -0.73% | 6.72% |
| VRNS | Varonis Systems | | Technology | 43.20 | 25 | -0.71% | -4.59% |
| TELA | TELA Bio | | Health Care | 5.15 | 25 | -0.39% | -22.21% |
| ATRC | AtriCure | | Health Care | 23.37 | 25 | -0.34% | -34.52% |
| TCMD | Tactile Systems | | Health Care | 14.14 | 25 | -0.14% | -1.12% |
| GRTS | Gritstone Oncology | | Health Care | 0.74 | 25 | -0.08% | -63.50% |
| NVCT | Nuvectis Pharma | | Health Care | 6.72 | 25 | -0.07% | -18.68% |
| BBUC | Brookfield Business | | Financials | 20.97 | 25 | 2.69% | -9.57% |
| MCS | Marcus | | Services & Goods | 13.16 | 25 | 2.57% | -9.74% |
| CATO | Cato | | Services & Goods | 4.94 | 25 | 2.49% | -30.81% |
| HELE | Helen of Troy | | Consumer Staples | 98.39 | 25 | 2.33% | -18.56% |


| Too many stocks? View smallcap stocks filtered by marketcap & sector |
| Marketcap: All SmallCap Stocks (default-no microcap), Large, Mid-Range, Small |
| Smallcap Sector: Tech, Finance, Energy, Staples, Retail, Industrial, Materials, & Medical |
|
Get the most comprehensive stock market coverage daily at 12Stocks.com ➞ Best Stocks Today ➞ Best Stocks Weekly ➞ Best Stocks Year-to-Date ➞ Best Stocks Trends ➞  Best Stocks Today 12Stocks.com Best Nasdaq Stocks ➞ Best S&P 500 Stocks ➞ Best Tech Stocks ➞ Best Biotech Stocks ➞ |
| Detailed Overview of SmallCap Stocks |
| SmallCap Technical Overview, Leaders & Laggards, Top SmallCap ETF Funds & Detailed SmallCap Stocks List, Charts, Trends & More |
| Smallcap: Technical Analysis, Trends & YTD Performance | |
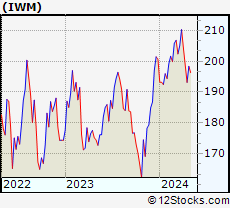
| SmallCap segment as represented by
IWM, an exchange-traded fund [ETF], holds basket of thousands of smallcap stocks from across all major sectors of the US stock market. The smallcap index (contains stocks like Riverbed & Sotheby's) is down by -3.92% and is currently underperforming the overall market by -8.11% year-to-date. Below is a quick view of technical charts and trends: | |
 IWM Weekly Chart |
|
| Long Term Trend: Not Good | |
| Medium Term Trend: Not Good | |
 IWM Daily Chart |
|
| Short Term Trend: Not Good | |
| Overall Trend Score: 23 | |
| YTD Performance: -3.92% | |
| **Trend Scores & Views Are Only For Educational Purposes And Not For Investing | |
| 12Stocks.com: Top Performing Small Cap Index Stocks | ||||||||||||||||||||||||||||||||||||||||||||||||
 The top performing Small Cap Index stocks year to date are
Now, more recently, over last week, the top performing Small Cap Index stocks on the move are


|
||||||||||||||||||||||||||||||||||||||||||||||||
| 12Stocks.com: Investing in Smallcap Index using Exchange Traded Funds | |
|
The following table shows list of key exchange traded funds (ETF) that
help investors track Smallcap index. The following list also includes leveraged ETF funds that track twice or thrice the daily returns of Smallcap indices. Short or inverse ETF funds move in the opposite direction to the index they track and are useful during market pullbacks or during bear markets. Quick View: Move mouse or cursor over ETF symbol (ticker) to view short-term technical chart and over ETF name to view long term chart. Click on ticker or stock name for detailed view. Click on to add stock symbol to your watchlist and to view watchlist. |
12Stocks.com List of ETFs that track Smallcap Index
| Ticker | ETF Name | Watchlist | Recent Price | Smart Investing & Trading Score | Change % | Week % | Year-to-date % |
| IWM | iShares Russell 2000 | | 192.84 | 23 | -0.08 | -2.94 | -3.92% |
| IJR | iShares Core S&P Small-Cap | | 102.34 | 31 | 0.21 | -2.08 | -5.46% |
| VTWO | Vanguard Russell 2000 ETF | | 77.94 | 23 | -0.14 | -2.96 | -3.9% |
| IWN | iShares Russell 2000 Value | | 146.33 | 10 | 0.21 | -2.69 | -5.79% |
| IJS | iShares S&P Small-Cap 600 Value | | 94.51 | 10 | 0.41 | -1.73 | -8.31% |
| IWO | iShares Russell 2000 Growth | | 246.94 | 36 | -0.44 | -3.3 | -2.09% |
| IJT | iShares S&P Small-Cap 600 Growth | | 121.59 | 23 | -0.21 | -2.56 | -2.84% |
| XSLV | PowerShares S&P SmallCap Low Volatil ETF | | 41.65 | 25 | 0.56 | -1.05 | -5.66% |
| SAA | ProShares Ultra SmallCap600 | | 21.62 | 10 | -0.18 | -4.17 | -13.35% |
| SMLV | SPDR SSGA US Small Cap Low Volatil ETF | | 103.83 | 18 | 0.16 | -1.13 | -7.72% |
| SBB | ProShares Short SmallCap600 | | 16.77 | 80 | -0.50 | 1.32 | 5.24% |
| SDD | ProShares UltraShort SmallCap600 | | 20.16 | 73 | -2.14 | 1.66 | 9.41% |
| 12Stocks.com: Charts, Trends, Fundamental Data and Performances of SmallCap Stocks | |
|
We now take in-depth look at all SmallCap stocks including charts, multi-period performances and overall trends (as measured by Smart Investing & Trading Score). One can sort SmallCap stocks (click link to choose) by Daily, Weekly and by Year-to-Date performances. Also, one can sort by size of the company or by market capitalization. |
| Select Your Default Chart Type: | |||||
| |||||
| Click on stock symbol or name for detailed view. Click on to add stock symbol to your watchlist and to view watchlist. Quick View: Move mouse or cursor over "Daily" to quickly view daily technical stock chart and over "Weekly" to view weekly technical stock chart. | |||||

 | MLP Maui Land & Pineapple Company, Inc. |
| Sector: Financials | |
| SubSector: Real Estate Development | |
| MarketCap: 186.619 Millions | |
| Recent Price: 19.27 Smart Investing & Trading Score: 25 | |
| Day Percent Change: 0.16% Day Change: 0.03 | |
| Week Change: -1.78% Year-to-date Change: 21.3% | |
| MLP Links: Profile News Message Board | |
| Charts:- Daily , Weekly | |
| Add MLP to Watchlist: View: Get Complete MLP Trend Analysis ➞ | |
 | DM Dominion Midstream Partners, LP |
| Sector: Energy | |
| SubSector: Oil & Gas Pipelines | |
| MarketCap: 3017.01 Millions | |
| Recent Price: 0.83 Smart Investing & Trading Score: 25 | |
| Day Percent Change: -3.71% Day Change: -0.03 | |
| Week Change: -13.49% Year-to-date Change: 10.2% | |
| DM Links: Profile News Message Board | |
| Charts:- Daily , Weekly | |
| Add DM to Watchlist: View: Get Complete DM Trend Analysis ➞ | |
 | LPSN LivePerson, Inc. |
| Sector: Technology | |
| SubSector: Business Software & Services | |
| MarketCap: 1070.58 Millions | |
| Recent Price: 0.56 Smart Investing & Trading Score: 25 | |
| Day Percent Change: -3.49% Day Change: -0.02 | |
| Week Change: -6.75% Year-to-date Change: -85.2% | |
| LPSN Links: Profile News Message Board | |
| Charts:- Daily , Weekly | |
| Add LPSN to Watchlist: View: Get Complete LPSN Trend Analysis ➞ | |
 | BW Babcock & Wilcox Enterprises, Inc. |
| Sector: Industrials | |
| SubSector: Industrial Electrical Equipment | |
| MarketCap: 59.0879 Millions | |
| Recent Price: 0.97 Smart Investing & Trading Score: 25 | |
| Day Percent Change: -3.16% Day Change: -0.03 | |
| Week Change: -7.77% Year-to-date Change: -33.7% | |
| BW Links: Profile News Message Board | |
| Charts:- Daily , Weekly | |
| Add BW to Watchlist: View: Get Complete BW Trend Analysis ➞ | |
 | AUR Aurora Innovation, Inc. |
| Sector: Technology | |
| SubSector: Information Technology Services | |
| MarketCap: 3220 Millions | |
| Recent Price: 2.96 Smart Investing & Trading Score: 25 | |
| Day Percent Change: -2.48% Day Change: -0.07 | |
| Week Change: -3.75% Year-to-date Change: -32.9% | |
| AUR Links: Profile News Message Board | |
| Charts:- Daily , Weekly | |
| Add AUR to Watchlist: View: Get Complete AUR Trend Analysis ➞ | |
 | SFIX Stitch Fix, Inc. |
| Sector: Services & Goods | |
| SubSector: Specialty Retail, Other | |
| MarketCap: 1693.64 Millions | |
| Recent Price: 2.19 Smart Investing & Trading Score: 25 | |
| Day Percent Change: -1.79% Day Change: -0.04 | |
| Week Change: -5.19% Year-to-date Change: -38.7% | |
| SFIX Links: Profile News Message Board | |
| Charts:- Daily , Weekly | |
| Add SFIX to Watchlist: View: Get Complete SFIX Trend Analysis ➞ | |
 | TRUE TrueCar, Inc. |
| Sector: Technology | |
| SubSector: Internet Service Providers | |
| MarketCap: 244.18 Millions | |
| Recent Price: 2.82 Smart Investing & Trading Score: 25 | |
| Day Percent Change: -1.74% Day Change: -0.05 | |
| Week Change: -3.75% Year-to-date Change: -18.5% | |
| TRUE Links: Profile News Message Board | |
| Charts:- Daily , Weekly | |
| Add TRUE to Watchlist: View: Get Complete TRUE Trend Analysis ➞ | |
 | NEOG Neogen Corporation |
| Sector: Health Care | |
| SubSector: Diagnostic Substances | |
| MarketCap: 3234.71 Millions | |
| Recent Price: 11.94 Smart Investing & Trading Score: 25 | |
| Day Percent Change: -1.65% Day Change: -0.20 | |
| Week Change: -3.55% Year-to-date Change: -40.6% | |
| NEOG Links: Profile News Message Board | |
| Charts:- Daily , Weekly | |
| Add NEOG to Watchlist: View: Get Complete NEOG Trend Analysis ➞ | |
 | OPFI OppFi Inc. |
| Sector: Financials | |
| SubSector: Credit Services | |
| MarketCap: 226 Millions | |
| Recent Price: 2.88 Smart Investing & Trading Score: 25 | |
| Day Percent Change: -1.37% Day Change: -0.04 | |
| Week Change: -10% Year-to-date Change: -43.6% | |
| OPFI Links: Profile News Message Board | |
| Charts:- Daily , Weekly | |
| Add OPFI to Watchlist: View: Get Complete OPFI Trend Analysis ➞ | |
 | LNZA LanzaTech Global, Inc. |
| Sector: Industrials | |
| SubSector: Waste Management | |
| MarketCap: 1340 Millions | |
| Recent Price: 3.04 Smart Investing & Trading Score: 25 | |
| Day Percent Change: -0.98% Day Change: -0.03 | |
| Week Change: -1.94% Year-to-date Change: -38.5% | |
| LNZA Links: Profile News Message Board | |
| Charts:- Daily , Weekly | |
| Add LNZA to Watchlist: View: Get Complete LNZA Trend Analysis ➞ | |
 | FLNC Fluence Energy, Inc. |
| Sector: Utilities | |
| SubSector: Utilities - Renewable | |
| MarketCap: 4550 Millions | |
| Recent Price: 15.87 Smart Investing & Trading Score: 25 | |
| Day Percent Change: -0.87% Day Change: -0.14 | |
| Week Change: -5.54% Year-to-date Change: -33.7% | |
| FLNC Links: Profile News Message Board | |
| Charts:- Daily , Weekly | |
| Add FLNC to Watchlist: View: Get Complete FLNC Trend Analysis ➞ | |
 | ITI Iteris, Inc. |
| Sector: Technology | |
| SubSector: Communication Equipment | |
| MarketCap: 129.939 Millions | |
| Recent Price: 4.60 Smart Investing & Trading Score: 25 | |
| Day Percent Change: -0.86% Day Change: -0.04 | |
| Week Change: -1.92% Year-to-date Change: -11.5% | |
| ITI Links: Profile News Message Board | |
| Charts:- Daily , Weekly | |
| Add ITI to Watchlist: View: Get Complete ITI Trend Analysis ➞ | |
 | PRGS Progress Software Corporation |
| Sector: Technology | |
| SubSector: Application Software | |
| MarketCap: 1407.22 Millions | |
| Recent Price: 50.18 Smart Investing & Trading Score: 25 | |
| Day Percent Change: -0.81% Day Change: -0.41 | |
| Week Change: -1.57% Year-to-date Change: -7.6% | |
| PRGS Links: Profile News Message Board | |
| Charts:- Daily , Weekly | |
| Add PRGS to Watchlist: View: Get Complete PRGS Trend Analysis ➞ | |
 | OPI Office Properties Income Trust |
| Sector: Financials | |
| SubSector: REIT - Office | |
| MarketCap: 1245.66 Millions | |
| Recent Price: 1.88 Smart Investing & Trading Score: 25 | |
| Day Percent Change: -0.79% Day Change: -0.01 | |
| Week Change: -8.09% Year-to-date Change: -74.4% | |
| OPI Links: Profile News Message Board | |
| Charts:- Daily , Weekly | |
| Add OPI to Watchlist: View: Get Complete OPI Trend Analysis ➞ | |
 | UEC Uranium Energy Corp. |
| Sector: Materials | |
| SubSector: Industrial Metals & Minerals | |
| MarketCap: 138.91 Millions | |
| Recent Price: 6.83 Smart Investing & Trading Score: 25 | |
| Day Percent Change: -0.73% Day Change: -0.05 | |
| Week Change: -5.92% Year-to-date Change: 6.7% | |
| UEC Links: Profile News Message Board | |
| Charts:- Daily , Weekly | |
| Add UEC to Watchlist: View: Get Complete UEC Trend Analysis ➞ | |
 | VRNS Varonis Systems, Inc. |
| Sector: Technology | |
| SubSector: Technical & System Software | |
| MarketCap: 1715 Millions | |
| Recent Price: 43.20 Smart Investing & Trading Score: 25 | |
| Day Percent Change: -0.71% Day Change: -0.31 | |
| Week Change: -2.96% Year-to-date Change: -4.6% | |
| VRNS Links: Profile News Message Board | |
| Charts:- Daily , Weekly | |
| Add VRNS to Watchlist: View: Get Complete VRNS Trend Analysis ➞ | |
 | TELA TELA Bio, Inc. |
| Sector: Health Care | |
| SubSector: Medical Appliances & Equipment | |
| MarketCap: 81.808 Millions | |
| Recent Price: 5.15 Smart Investing & Trading Score: 25 | |
| Day Percent Change: -0.39% Day Change: -0.02 | |
| Week Change: 4.67% Year-to-date Change: -22.2% | |
| TELA Links: Profile News Message Board | |
| Charts:- Daily , Weekly | |
| Add TELA to Watchlist: View: Get Complete TELA Trend Analysis ➞ | |
 | ATRC AtriCure, Inc. |
| Sector: Health Care | |
| SubSector: Medical Instruments & Supplies | |
| MarketCap: 1158.7 Millions | |
| Recent Price: 23.37 Smart Investing & Trading Score: 25 | |
| Day Percent Change: -0.34% Day Change: -0.08 | |
| Week Change: -2.99% Year-to-date Change: -34.5% | |
| ATRC Links: Profile News Message Board | |
| Charts:- Daily , Weekly | |
| Add ATRC to Watchlist: View: Get Complete ATRC Trend Analysis ➞ | |
 | TCMD Tactile Systems Technology, Inc. |
| Sector: Health Care | |
| SubSector: Medical Instruments & Supplies | |
| MarketCap: 655.96 Millions | |
| Recent Price: 14.14 Smart Investing & Trading Score: 25 | |
| Day Percent Change: -0.14% Day Change: -0.02 | |
| Week Change: -4.33% Year-to-date Change: -1.1% | |
| TCMD Links: Profile News Message Board | |
| Charts:- Daily , Weekly | |
| Add TCMD to Watchlist: View: Get Complete TCMD Trend Analysis ➞ | |
 | GRTS Gritstone Oncology, Inc. |
| Sector: Health Care | |
| SubSector: Biotechnology | |
| MarketCap: 240.085 Millions | |
| Recent Price: 0.74 Smart Investing & Trading Score: 25 | |
| Day Percent Change: -0.08% Day Change: 0.00 | |
| Week Change: -11.47% Year-to-date Change: -63.5% | |
| GRTS Links: Profile News Message Board | |
| Charts:- Daily , Weekly | |
| Add GRTS to Watchlist: View: Get Complete GRTS Trend Analysis ➞ | |
 | NVCT Nuvectis Pharma, Inc. |
| Sector: Health Care | |
| SubSector: Biotechnology | |
| MarketCap: 258 Millions | |
| Recent Price: 6.72 Smart Investing & Trading Score: 25 | |
| Day Percent Change: -0.07% Day Change: -0.01 | |
| Week Change: -4.2% Year-to-date Change: -18.7% | |
| NVCT Links: Profile News Message Board | |
| Charts:- Daily , Weekly | |
| Add NVCT to Watchlist: View: Get Complete NVCT Trend Analysis ➞ | |
 | BBUC Brookfield Business Corporation |
| Sector: Financials | |
| SubSector: Asset Management | |
| MarketCap: 1810 Millions | |
| Recent Price: 20.97 Smart Investing & Trading Score: 25 | |
| Day Percent Change: 2.69% Day Change: 0.55 | |
| Week Change: 0.77% Year-to-date Change: -9.6% | |
| BBUC Links: Profile News Message Board | |
| Charts:- Daily , Weekly | |
| Add BBUC to Watchlist: View: Get Complete BBUC Trend Analysis ➞ | |
 | MCS The Marcus Corporation |
| Sector: Services & Goods | |
| SubSector: Entertainment - Diversified | |
| MarketCap: 441.437 Millions | |
| Recent Price: 13.16 Smart Investing & Trading Score: 25 | |
| Day Percent Change: 2.57% Day Change: 0.33 | |
| Week Change: 0.3% Year-to-date Change: -9.7% | |
| MCS Links: Profile News Message Board | |
| Charts:- Daily , Weekly | |
| Add MCS to Watchlist: View: Get Complete MCS Trend Analysis ➞ | |
 | CATO The Cato Corporation |
| Sector: Services & Goods | |
| SubSector: Apparel Stores | |
| MarketCap: 305.208 Millions | |
| Recent Price: 4.94 Smart Investing & Trading Score: 25 | |
| Day Percent Change: 2.49% Day Change: 0.12 | |
| Week Change: -1.59% Year-to-date Change: -30.8% | |
| CATO Links: Profile News Message Board | |
| Charts:- Daily , Weekly | |
| Add CATO to Watchlist: View: Get Complete CATO Trend Analysis ➞ | |
 | HELE Helen of Troy Limited |
| Sector: Consumer Staples | |
| SubSector: Housewares & Accessories | |
| MarketCap: 3199.53 Millions | |
| Recent Price: 98.39 Smart Investing & Trading Score: 25 | |
| Day Percent Change: 2.33% Day Change: 2.24 | |
| Week Change: -1.46% Year-to-date Change: -18.6% | |
| HELE Links: Profile News Message Board | |
| Charts:- Daily , Weekly | |
| Add HELE to Watchlist: View: Get Complete HELE Trend Analysis ➞ | |
| Too many stocks? View smallcap stocks filtered by marketcap & sector |
| Marketcap: All SmallCap Stocks (default-no microcap), Large, Mid-Range, Small & MicroCap |
| Sector: Tech, Finance, Energy, Staples, Retail, Industrial, Materials, Utilities & Medical |
|
Best Stocks Today 12Stocks.com |
© 2024 12Stocks.com Terms & Conditions Privacy Contact Us
All Information Provided Only For Education And Not To Be Used For Investing or Trading. See Terms & Conditions


One More Thing ... Get Best Stocks Delivered Daily!
Never Ever Miss A Move With Our Top Ten Stocks Lists
Find Best Stocks In Any Market - Bull or Bear Market
Take A Peek At Our Top Ten Stocks Lists: Daily, Weekly, Year-to-Date & Top Trends
Find Best Stocks In Any Market - Bull or Bear Market
Take A Peek At Our Top Ten Stocks Lists: Daily, Weekly, Year-to-Date & Top Trends
Smallcap Stocks With Best Up Trends [0-bearish to 100-bullish]: Badger Meter[100], Cullinan Oncology[100], Oscar Health[100], NextNav [100], Richardson Electronics[100], Seneca Foods[100], Lantheus [100], Macatawa Bank[100], Geron [100], IMAX [100], Regional Management[100]
Best Smallcap Stocks Year-to-Date:
Agenus [500.31%], CareMax [417.53%], Janux [348.12%], Viking [248.9%], Alpine Immune[238.5%], Super Micro[226.74%], Longboard [194.76%], Arcutis Bio[192.57%], Vera [161.3%], Avidity Biosciences[154.87%], Hippo [128.32%] Best Smallcap Stocks This Week:
Macatawa Bank[44.53%], 23andMe Holding[33.3%], ProKidney [32%], Snap One[29.73%], Vertex Energy[23.08%], ALX Oncology[20.64%], Vanda [20.63%], Expensify [18.37%], Badger Meter[16.72%], ContextLogic [15%], Cullinan Oncology[13.89%] Best Smallcap Stocks Daily:
23andMe Holding[65.91%], Vertex Energy[30.72%], Zura Bio[17.20%], Badger Meter[16.65%], ContextLogic [15.81%], Expensify [15.23%], Montrose Environmental[12.84%], Vaxxinity [10.05%], Vuzix [9.87%], Cipher Mining[8.65%], FiscalNote [8.61%]