
 Login Sign Up


| |||||
 |  | ||||

| 12Stocks.com Market Intelligence |
Best SmallCap Stocks
|
| In a hurry? Small Cap Stock Lists: Performance Trends Table, Stock Charts
Sort Small Cap stocks: Daily, Weekly, Year-to-Date, Market Cap & Trends. Filter Small Cap stocks list by sector: Show all, Tech, Finance, Energy, Staples, Retail, Industrial, Materials, Utilities and HealthCare Filter Small Cap stocks list by size: All Large Medium Small and MicroCap |
| 12Stocks.com Small Cap Stocks Performances & Trends Daily | |||||||||
|
|  The overall Smart Investing & Trading Score is 23 (0-bearish to 100-bullish) which puts Small Cap index in short term bearish to neutral trend. The Smart Investing & Trading Score from previous trading session is 13 and an improvement of trend continues.
| ||||||||
Here are the Smart Investing & Trading Scores of the most requested small cap stocks at 12Stocks.com (click stock name for detailed review):
|


| 12Stocks.com: Investing in Smallcap Index with Stocks | |
|
The following table helps investors and traders sort through current performance and trends (as measured by Smart Investing & Trading Score) of various
stocks in the Smallcap Index. Quick View: Move mouse or cursor over stock symbol (ticker) to view short-term technical chart and over stock name to view long term chart. Click on  to add stock symbol to your watchlist and to add stock symbol to your watchlist and  to view watchlist. Click on any ticker or stock name for detailed market intelligence report for that stock. to view watchlist. Click on any ticker or stock name for detailed market intelligence report for that stock. |
12Stocks.com Performance of Stocks in Smallcap Index
| Ticker | Stock Name | Watchlist | Category | Recent Price | Smart Investing & Trading Score | Change % | YTD Change% |
| ASRT | Assertio |   | Health Care | 0.78 | 27 | 3.24 | -27.64% |
| NWFL | Norwood Financial | | Financials | 24.31 | 18 | 3.23 | -26.13% |
| AGEN | Agenus | | Health Care | 5.13 | 68 | 3.22 | 519.64% |
| NEXT | NextDecade | | Energy | 6.13 | 83 | 3.20 | 28.51% |
| NFBK | Northfield Bancorp | | Financials | 8.39 | 42 | 3.20 | -33.31% |
| WSBF | Waterstone Financial | | Financials | 11.45 | 59 | 3.20 | -19.40% |
| HTLD | Heartland Express | | Transports | 10.48 | 25 | 3.15 | -26.51% |
| TCBK | TriCo Bancshares | | Financials | 33.07 | 42 | 3.12 | -23.04% |
| SAMG | Silvercrest Asset | | Financials | 14.58 | 25 | 3.11 | -14.24% |
| FMBH | First Mid | | Financials | 30.79 | 47 | 3.11 | -11.17% |
| FC | Franklin Covey | | Services & Goods | 39.15 | 60 | 3.08 | -10.06% |
| SFST | Southern First | | Financials | 28.10 | 42 | 3.08 | -24.26% |
| AMBC | Ambac Financial | | Financials | 14.44 | 25 | 3.07 | -12.38% |
| LXFR | Luxfer | | Industrials | 9.68 | 46 | 3.04 | 8.22% |
| GBCI | Glacier Bancorp | | Financials | 36.16 | 42 | 3.02 | -12.49% |
| ULH | Universal Logistics | | Transports | 33.17 | 68 | 3.01 | 18.38% |
| HSTM | HealthStream | | Technology | 24.71 | 17 | 3.00 | -8.58% |
| PPBI | Pacific Premier | | Financials | 21.95 | 52 | 3.00 | -24.60% |
| MOFG | MidWestOne Financial | | Financials | 20.31 | 25 | 2.99 | -24.53% |
| BRT | BRT Apartments | | Financials | 17.11 | 27 | 2.98 | -7.93% |
| RLYB | Rallybio | | Health Care | 1.73 | 43 | 2.98 | -26.69% |
| LOVE | Lovesac | | Consumer Staples | 20.97 | 42 | 2.97 | -17.93% |
| SSBK | Southern States | | Financials | 24.45 | 42 | 2.95 | -16.95% |
| CAC | Camden National | | Financials | 29.56 | 32 | 2.94 | -21.46% |
| XFOR | X4 | | Health Care | 1.23 | 48 | 2.93 | 46.69% |


| Too many stocks? View smallcap stocks filtered by marketcap & sector |
| Marketcap: All SmallCap Stocks (default-no microcap), Large, Mid-Range, Small |
| Smallcap Sector: Tech, Finance, Energy, Staples, Retail, Industrial, Materials, & Medical |
|
Get the most comprehensive stock market coverage daily at 12Stocks.com ➞ Best Stocks Today ➞ Best Stocks Weekly ➞ Best Stocks Year-to-Date ➞ Best Stocks Trends ➞  Best Stocks Today 12Stocks.com Best Nasdaq Stocks ➞ Best S&P 500 Stocks ➞ Best Tech Stocks ➞ Best Biotech Stocks ➞ |
| Detailed Overview of SmallCap Stocks |
| SmallCap Technical Overview, Leaders & Laggards, Top SmallCap ETF Funds & Detailed SmallCap Stocks List, Charts, Trends & More |
| Smallcap: Technical Analysis, Trends & YTD Performance | |
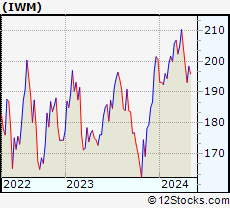
| SmallCap segment as represented by
IWM, an exchange-traded fund [ETF], holds basket of thousands of smallcap stocks from across all major sectors of the US stock market. The smallcap index (contains stocks like Riverbed & Sotheby's) is down by -4.52% and is currently underperforming the overall market by -7.67% year-to-date. Below is a quick view of technical charts and trends: | |
 IWM Weekly Chart |
|
| Long Term Trend: Not Good | |
| Medium Term Trend: Not Good | |
 IWM Daily Chart |
|
| Short Term Trend: Not Good | |
| Overall Trend Score: 23 | |
| YTD Performance: -4.52% | |
| **Trend Scores & Views Are Only For Educational Purposes And Not For Investing | |
| 12Stocks.com: Top Performing Small Cap Index Stocks | ||||||||||||||||||||||||||||||||||||||||||||||||
 The top performing Small Cap Index stocks year to date are
Now, more recently, over last week, the top performing Small Cap Index stocks on the move are


|
||||||||||||||||||||||||||||||||||||||||||||||||
| 12Stocks.com: Investing in Smallcap Index using Exchange Traded Funds | |
|
The following table shows list of key exchange traded funds (ETF) that
help investors track Smallcap index. The following list also includes leveraged ETF funds that track twice or thrice the daily returns of Smallcap indices. Short or inverse ETF funds move in the opposite direction to the index they track and are useful during market pullbacks or during bear markets. Quick View: Move mouse or cursor over ETF symbol (ticker) to view short-term technical chart and over ETF name to view long term chart. Click on ticker or stock name for detailed view. Click on to add stock symbol to your watchlist and to view watchlist. |
12Stocks.com List of ETFs that track Smallcap Index
| Ticker | ETF Name | Watchlist | Recent Price | Smart Investing & Trading Score | Change % | Week % | Year-to-date % |
| IWM | iShares Russell 2000 | | 191.63 | 23 | -0.63 | -3.55 | -4.52% |
| IWN | iShares Russell 2000 Value | | 146.63 | 10 | 0.21 | -2.49 | -5.6% |
| IJR | iShares Core S&P Small-Cap | | 102.51 | 10 | 0.16 | -1.92 | -5.31% |
| VTWO | Vanguard Russell 2000 ETF | | 77.48 | 23 | -0.60 | -3.53 | -4.46% |
| IWO | iShares Russell 2000 Growth | | 243.13 | 36 | -1.54 | -4.79 | -3.6% |
| IJS | iShares S&P Small-Cap 600 Value | | 95.00 | 17 | 0.52 | -1.22 | -7.83% |
| IJT | iShares S&P Small-Cap 600 Growth | | 122.10 | 23 | 0.44 | -2.15 | -2.43% |
| SAA | ProShares Ultra SmallCap600 | | 21.91 | 18 | 1.34 | -2.88 | -12.18% |
| XSLV | PowerShares S&P SmallCap Low Volatil ETF | | 42.07 | 17 | 1.01 | -0.05 | -4.71% |
| SMLV | SPDR SSGA US Small Cap Low Volatil ETF | | 105.89 | 32 | 1.98 | 0.84 | -5.89% |
| SDD | ProShares UltraShort SmallCap600 | | 20.32 | 76 | -1.79 | 2.47 | 10.28% |
| SBB | ProShares Short SmallCap600 | | 16.78 | 76 | -1.18 | 1.41 | 5.34% |
| 12Stocks.com: Charts, Trends, Fundamental Data and Performances of SmallCap Stocks | |
|
We now take in-depth look at all SmallCap stocks including charts, multi-period performances and overall trends (as measured by Smart Investing & Trading Score). One can sort SmallCap stocks (click link to choose) by Daily, Weekly and by Year-to-Date performances. Also, one can sort by size of the company or by market capitalization. |
| Select Your Default Chart Type: | |||||
| |||||
| Click on stock symbol or name for detailed view. Click on to add stock symbol to your watchlist and to view watchlist. Quick View: Move mouse or cursor over "Daily" to quickly view daily technical stock chart and over "Weekly" to view weekly technical stock chart. | |||||

 | ASRT Assertio Therapeutics, Inc. |
| Sector: Health Care | |
| SubSector: Drugs - Generic | |
| MarketCap: 65.8185 Millions | |
| Recent Price: 0.78 Smart Investing & Trading Score: 27 | |
| Day Percent Change: 3.24% Day Change: 0.02 | |
| Week Change: -9.99% Year-to-date Change: -27.6% | |
| ASRT Links: Profile News Message Board | |
| Charts:- Daily , Weekly | |
| Add ASRT to Watchlist: View: Get Complete ASRT Trend Analysis ➞ | |
 | NWFL Norwood Financial Corp. |
| Sector: Financials | |
| SubSector: Regional - Northeast Banks | |
| MarketCap: 201.899 Millions | |
| Recent Price: 24.31 Smart Investing & Trading Score: 18 | |
| Day Percent Change: 3.23% Day Change: 0.76 | |
| Week Change: 0.33% Year-to-date Change: -26.1% | |
| NWFL Links: Profile News Message Board | |
| Charts:- Daily , Weekly | |
| Add NWFL to Watchlist: View: Get Complete NWFL Trend Analysis ➞ | |
 | AGEN Agenus Inc. |
| Sector: Health Care | |
| SubSector: Biotechnology | |
| MarketCap: 274.885 Millions | |
| Recent Price: 5.13 Smart Investing & Trading Score: 68 | |
| Day Percent Change: 3.22% Day Change: 0.16 | |
| Week Change: -37.06% Year-to-date Change: 519.6% | |
| AGEN Links: Profile News Message Board | |
| Charts:- Daily , Weekly | |
| Add AGEN to Watchlist: View: Get Complete AGEN Trend Analysis ➞ | |
 | NEXT NextDecade Corporation |
| Sector: Energy | |
| SubSector: Independent Oil & Gas | |
| MarketCap: 270.893 Millions | |
| Recent Price: 6.13 Smart Investing & Trading Score: 83 | |
| Day Percent Change: 3.20% Day Change: 0.19 | |
| Week Change: -1.45% Year-to-date Change: 28.5% | |
| NEXT Links: Profile News Message Board | |
| Charts:- Daily , Weekly | |
| Add NEXT to Watchlist: View: Get Complete NEXT Trend Analysis ➞ | |
 | NFBK Northfield Bancorp, Inc. (Staten Island, NY) |
| Sector: Financials | |
| SubSector: Regional - Northeast Banks | |
| MarketCap: 540.699 Millions | |
| Recent Price: 8.39 Smart Investing & Trading Score: 42 | |
| Day Percent Change: 3.20% Day Change: 0.26 | |
| Week Change: 0.24% Year-to-date Change: -33.3% | |
| NFBK Links: Profile News Message Board | |
| Charts:- Daily , Weekly | |
| Add NFBK to Watchlist: View: Get Complete NFBK Trend Analysis ➞ | |
 | WSBF Waterstone Financial, Inc. |
| Sector: Financials | |
| SubSector: Savings & Loans | |
| MarketCap: 371.93 Millions | |
| Recent Price: 11.45 Smart Investing & Trading Score: 59 | |
| Day Percent Change: 3.20% Day Change: 0.36 | |
| Week Change: 1.1% Year-to-date Change: -19.4% | |
| WSBF Links: Profile News Message Board | |
| Charts:- Daily , Weekly | |
| Add WSBF to Watchlist: View: Get Complete WSBF Trend Analysis ➞ | |
 | HTLD Heartland Express, Inc. |
| Sector: Transports | |
| SubSector: Trucking | |
| MarketCap: 1461.25 Millions | |
| Recent Price: 10.48 Smart Investing & Trading Score: 25 | |
| Day Percent Change: 3.15% Day Change: 0.32 | |
| Week Change: -3.76% Year-to-date Change: -26.5% | |
| HTLD Links: Profile News Message Board | |
| Charts:- Daily , Weekly | |
| Add HTLD to Watchlist: View: Get Complete HTLD Trend Analysis ➞ | |
 | TCBK TriCo Bancshares |
| Sector: Financials | |
| SubSector: Regional - Pacific Banks | |
| MarketCap: 875.129 Millions | |
| Recent Price: 33.07 Smart Investing & Trading Score: 42 | |
| Day Percent Change: 3.12% Day Change: 1.00 | |
| Week Change: 1.38% Year-to-date Change: -23.0% | |
| TCBK Links: Profile News Message Board | |
| Charts:- Daily , Weekly | |
| Add TCBK to Watchlist: View: Get Complete TCBK Trend Analysis ➞ | |
 | SAMG Silvercrest Asset Management Group Inc. |
| Sector: Financials | |
| SubSector: Asset Management | |
| MarketCap: 116.303 Millions | |
| Recent Price: 14.58 Smart Investing & Trading Score: 25 | |
| Day Percent Change: 3.11% Day Change: 0.44 | |
| Week Change: -1.49% Year-to-date Change: -14.2% | |
| SAMG Links: Profile News Message Board | |
| Charts:- Daily , Weekly | |
| Add SAMG to Watchlist: View: Get Complete SAMG Trend Analysis ➞ | |
 | FMBH First Mid Bancshares, Inc. |
| Sector: Financials | |
| SubSector: Regional - Midwest Banks | |
| MarketCap: 373.27 Millions | |
| Recent Price: 30.79 Smart Investing & Trading Score: 47 | |
| Day Percent Change: 3.11% Day Change: 0.93 | |
| Week Change: 4.34% Year-to-date Change: -11.2% | |
| FMBH Links: Profile News Message Board | |
| Charts:- Daily , Weekly | |
| Add FMBH to Watchlist: View: Get Complete FMBH Trend Analysis ➞ | |
 | FC Franklin Covey Co. |
| Sector: Services & Goods | |
| SubSector: Education & Training Services | |
| MarketCap: 243.306 Millions | |
| Recent Price: 39.15 Smart Investing & Trading Score: 60 | |
| Day Percent Change: 3.08% Day Change: 1.17 | |
| Week Change: 0.54% Year-to-date Change: -10.1% | |
| FC Links: Profile News Message Board | |
| Charts:- Daily , Weekly | |
| Add FC to Watchlist: View: Get Complete FC Trend Analysis ➞ | |
 | SFST Southern First Bancshares, Inc. |
| Sector: Financials | |
| SubSector: Money Center Banks | |
| MarketCap: 189.099 Millions | |
| Recent Price: 28.10 Smart Investing & Trading Score: 42 | |
| Day Percent Change: 3.08% Day Change: 0.84 | |
| Week Change: 5.8% Year-to-date Change: -24.3% | |
| SFST Links: Profile News Message Board | |
| Charts:- Daily , Weekly | |
| Add SFST to Watchlist: View: Get Complete SFST Trend Analysis ➞ | |
 | AMBC Ambac Financial Group, Inc. |
| Sector: Financials | |
| SubSector: Surety & Title Insurance | |
| MarketCap: 587.818 Millions | |
| Recent Price: 14.44 Smart Investing & Trading Score: 25 | |
| Day Percent Change: 3.07% Day Change: 0.43 | |
| Week Change: -3.41% Year-to-date Change: -12.4% | |
| AMBC Links: Profile News Message Board | |
| Charts:- Daily , Weekly | |
| Add AMBC to Watchlist: View: Get Complete AMBC Trend Analysis ➞ | |
 | LXFR Luxfer Holdings PLC |
| Sector: Industrials | |
| SubSector: Diversified Machinery | |
| MarketCap: 406.716 Millions | |
| Recent Price: 9.68 Smart Investing & Trading Score: 46 | |
| Day Percent Change: 3.04% Day Change: 0.29 | |
| Week Change: -4.68% Year-to-date Change: 8.2% | |
| LXFR Links: Profile News Message Board | |
| Charts:- Daily , Weekly | |
| Add LXFR to Watchlist: View: Get Complete LXFR Trend Analysis ➞ | |
 | GBCI Glacier Bancorp, Inc. |
| Sector: Financials | |
| SubSector: Regional - Pacific Banks | |
| MarketCap: 3142.89 Millions | |
| Recent Price: 36.16 Smart Investing & Trading Score: 42 | |
| Day Percent Change: 3.02% Day Change: 1.06 | |
| Week Change: 0.25% Year-to-date Change: -12.5% | |
| GBCI Links: Profile News Message Board | |
| Charts:- Daily , Weekly | |
| Add GBCI to Watchlist: View: Get Complete GBCI Trend Analysis ➞ | |
 | ULH Universal Logistics Holdings, Inc. |
| Sector: Transports | |
| SubSector: Trucking | |
| MarketCap: 354.915 Millions | |
| Recent Price: 33.17 Smart Investing & Trading Score: 68 | |
| Day Percent Change: 3.01% Day Change: 0.97 | |
| Week Change: 0.21% Year-to-date Change: 18.4% | |
| ULH Links: Profile News Message Board | |
| Charts:- Daily , Weekly | |
| Add ULH to Watchlist: View: Get Complete ULH Trend Analysis ➞ | |
 | HSTM HealthStream, Inc. |
| Sector: Technology | |
| SubSector: Healthcare Information Services | |
| MarketCap: 770.255 Millions | |
| Recent Price: 24.71 Smart Investing & Trading Score: 17 | |
| Day Percent Change: 3.00% Day Change: 0.72 | |
| Week Change: -0.2% Year-to-date Change: -8.6% | |
| HSTM Links: Profile News Message Board | |
| Charts:- Daily , Weekly | |
| Add HSTM to Watchlist: View: Get Complete HSTM Trend Analysis ➞ | |
 | PPBI Pacific Premier Bancorp, Inc. |
| Sector: Financials | |
| SubSector: Regional - Pacific Banks | |
| MarketCap: 978.029 Millions | |
| Recent Price: 21.95 Smart Investing & Trading Score: 52 | |
| Day Percent Change: 3.00% Day Change: 0.64 | |
| Week Change: 0.41% Year-to-date Change: -24.6% | |
| PPBI Links: Profile News Message Board | |
| Charts:- Daily , Weekly | |
| Add PPBI to Watchlist: View: Get Complete PPBI Trend Analysis ➞ | |
 | MOFG MidWestOne Financial Group, Inc. |
| Sector: Financials | |
| SubSector: Regional - Southwest Banks | |
| MarketCap: 345.265 Millions | |
| Recent Price: 20.31 Smart Investing & Trading Score: 25 | |
| Day Percent Change: 2.99% Day Change: 0.59 | |
| Week Change: -1.36% Year-to-date Change: -24.5% | |
| MOFG Links: Profile News Message Board | |
| Charts:- Daily , Weekly | |
| Add MOFG to Watchlist: View: Get Complete MOFG Trend Analysis ➞ | |
 | BRT BRT Apartments Corp. |
| Sector: Financials | |
| SubSector: Mortgage Investment | |
| MarketCap: 163.239 Millions | |
| Recent Price: 17.11 Smart Investing & Trading Score: 27 | |
| Day Percent Change: 2.98% Day Change: 0.49 | |
| Week Change: -2.98% Year-to-date Change: -7.9% | |
| BRT Links: Profile News Message Board | |
| Charts:- Daily , Weekly | |
| Add BRT to Watchlist: View: Get Complete BRT Trend Analysis ➞ | |
 | RLYB Rallybio Corporation |
| Sector: Health Care | |
| SubSector: Biotechnology | |
| MarketCap: 226 Millions | |
| Recent Price: 1.73 Smart Investing & Trading Score: 43 | |
| Day Percent Change: 2.98% Day Change: 0.05 | |
| Week Change: -21.36% Year-to-date Change: -26.7% | |
| RLYB Links: Profile News Message Board | |
| Charts:- Daily , Weekly | |
| Add RLYB to Watchlist: View: Get Complete RLYB Trend Analysis ➞ | |
 | LOVE The Lovesac Company |
| Sector: Consumer Staples | |
| SubSector: Home Furnishings & Fixtures | |
| MarketCap: 112.835 Millions | |
| Recent Price: 20.97 Smart Investing & Trading Score: 42 | |
| Day Percent Change: 2.97% Day Change: 0.61 | |
| Week Change: 7.48% Year-to-date Change: -17.9% | |
| LOVE Links: Profile News Message Board | |
| Charts:- Daily , Weekly | |
| Add LOVE to Watchlist: View: Get Complete LOVE Trend Analysis ➞ | |
 | SSBK Southern States Bancshares, Inc. |
| Sector: Financials | |
| SubSector: Banks - Regional | |
| MarketCap: 187 Millions | |
| Recent Price: 24.45 Smart Investing & Trading Score: 42 | |
| Day Percent Change: 2.95% Day Change: 0.70 | |
| Week Change: 4.53% Year-to-date Change: -17.0% | |
| SSBK Links: Profile News Message Board | |
| Charts:- Daily , Weekly | |
| Add SSBK to Watchlist: View: Get Complete SSBK Trend Analysis ➞ | |
 | CAC Camden National Corporation |
| Sector: Financials | |
| SubSector: Regional - Northeast Banks | |
| MarketCap: 550.999 Millions | |
| Recent Price: 29.56 Smart Investing & Trading Score: 32 | |
| Day Percent Change: 2.94% Day Change: 0.84 | |
| Week Change: 0.84% Year-to-date Change: -21.5% | |
| CAC Links: Profile News Message Board | |
| Charts:- Daily , Weekly | |
| Add CAC to Watchlist: View: Get Complete CAC Trend Analysis ➞ | |
 | XFOR X4 Pharmaceuticals, Inc. |
| Sector: Health Care | |
| SubSector: Biotechnology | |
| MarketCap: 143.385 Millions | |
| Recent Price: 1.23 Smart Investing & Trading Score: 48 | |
| Day Percent Change: 2.93% Day Change: 0.03 | |
| Week Change: -8.21% Year-to-date Change: 46.7% | |
| XFOR Links: Profile News Message Board | |
| Charts:- Daily , Weekly | |
| Add XFOR to Watchlist: View: Get Complete XFOR Trend Analysis ➞ | |
| Too many stocks? View smallcap stocks filtered by marketcap & sector |
| Marketcap: All SmallCap Stocks (default-no microcap), Large, Mid-Range, Small & MicroCap |
| Sector: Tech, Finance, Energy, Staples, Retail, Industrial, Materials, Utilities & Medical |
|
Best Stocks Today 12Stocks.com |
© 2024 12Stocks.com Terms & Conditions Privacy Contact Us
All Information Provided Only For Education And Not To Be Used For Investing or Trading. See Terms & Conditions


One More Thing ... Get Best Stocks Delivered Daily!
Never Ever Miss A Move With Our Top Ten Stocks Lists
Find Best Stocks In Any Market - Bull or Bear Market
Take A Peek At Our Top Ten Stocks Lists: Daily, Weekly, Year-to-Date & Top Trends
Find Best Stocks In Any Market - Bull or Bear Market
Take A Peek At Our Top Ten Stocks Lists: Daily, Weekly, Year-to-Date & Top Trends
Smallcap Stocks With Best Up Trends [0-bearish to 100-bullish]: Humacyte [100], Victory Capital[100], Cricut [100], Old Second[100], United Fire[100], Century Aluminum[100], Portland General[100], Tejon Ranch[100], Gannett Co[100], Lantheus [100], Target Hospitality[100]
Best Smallcap Stocks Year-to-Date:
Agenus [519.64%], CareMax [423.71%], Janux [336.95%], Alpine Immune[238.42%], Viking [231.81%], Longboard [194.11%], Arcutis Bio[184.06%], Super Micro[155.54%], Avidity Biosciences[153.65%], Vera [138.18%], Stoke [121.48%] Best Smallcap Stocks This Week:
Macatawa Bank[45.99%], Vertex Energy[43.75%], Snap One[29.61%], Vanda [24.76%], Humacyte [23.78%], ALX Oncology[22.49%], ContextLogic [20%], ProKidney [16.57%], Badger Meter[15.82%], Calavo Growers[14.44%], Accolade [13.45%] Best Smallcap Stocks Daily:
Origin Materials[20.44%], Metropolitan Bank[17.73%], Tellurian [17.66%], Vertex Energy[14.12%], Fossil Group[10.55%], Genelux [10.37%], Humacyte [9.86%], Riot Blockchain[9.11%], Cohen & Steers[8.81%], Chemung Financial[8.68%], Urban One[8.21%]