
 Login Sign Up


| |||||
 |  | ||||

| 12Stocks.com Market Intelligence |
Best SmallCap Stocks
|
| In a hurry? Small Cap Stock Lists: Performance Trends Table, Stock Charts
Sort Small Cap stocks: Daily, Weekly, Year-to-Date, Market Cap & Trends. Filter Small Cap stocks list by sector: Show all, Tech, Finance, Energy, Staples, Retail, Industrial, Materials, Utilities and HealthCare Filter Small Cap stocks list by size: All Large Medium Small and MicroCap |
| 12Stocks.com Small Cap Stocks Performances & Trends Daily | |||||||||
|
|  The overall Smart Investing & Trading Score is 23 (0-bearish to 100-bullish) which puts Small Cap index in short term bearish to neutral trend. The Smart Investing & Trading Score from previous trading session is 13 and an improvement of trend continues.
| ||||||||
Here are the Smart Investing & Trading Scores of the most requested small cap stocks at 12Stocks.com (click stock name for detailed review):
|


| 12Stocks.com: Investing in Smallcap Index with Stocks | |
|
The following table helps investors and traders sort through current performance and trends (as measured by Smart Investing & Trading Score) of various
stocks in the Smallcap Index. Quick View: Move mouse or cursor over stock symbol (ticker) to view short-term technical chart and over stock name to view long term chart. Click on  to add stock symbol to your watchlist and to add stock symbol to your watchlist and  to view watchlist. Click on any ticker or stock name for detailed market intelligence report for that stock. to view watchlist. Click on any ticker or stock name for detailed market intelligence report for that stock. |
12Stocks.com Performance of Stocks in Smallcap Index
| Ticker | Stock Name | Watchlist | Category | Recent Price | Smart Investing & Trading Score | Change % | YTD Change% |
| RBOT | Vicarious Surgical |   | Health Care | 0.29 | 40 | 3.23 | -21.48% |
| WAFD | Washington Federal | | Financials | 27.90 | 52 | 3.22 | -15.35% |
| FCF | First Commonwealth | | Financials | 13.20 | 52 | 3.21 | -14.51% |
| PKST | Peakstone Realty | | Financials | 12.88 | 27 | 3.21 | -37.23% |
| IPAR | Inter Parfums | | Consumer Staples | 127.88 | 32 | 3.20 | -11.20% |
| WTTR | Select Energy | | Industrials | 9.34 | 83 | 3.20 | 23.06% |
| BY | Byline Bancorp | | Financials | 20.72 | 52 | 3.19 | -12.05% |
| UBSI | United Bankshares | | Financials | 34.17 | 52 | 3.17 | -9.00% |
| TOWN | TowneBank | | Financials | 27.00 | 52 | 3.17 | -9.27% |
| CPF | Central Pacific | | Financials | 19.29 | 52 | 3.16 | -1.98% |
| NATR | Nature s | | Health Care | 19.29 | 63 | 3.16 | 11.57% |
| NWFL | Norwood Financial | | Financials | 24.29 | 42 | 3.14 | -26.19% |
| CARG | CarGurus | | Services & Goods | 22.20 | 32 | 3.09 | -8.09% |
| DOLE | Dole | | Consumer Staples | 12.11 | 100 | 3.06 | -1.82% |
| NAPA | Duckhorn Portfolio | | Consumer Staples | 8.25 | 27 | 3.06 | -16.16% |
| TLYS | Tilly s | | Services & Goods | 5.75 | 32 | 3.05 | -23.74% |
| NHC | National HealthCare | | Health Care | 90.62 | 32 | 3.04 | -1.95% |
| CRK | Comstock Resources | | Energy | 9.52 | 93 | 3.03 | 7.57% |
| OMI | Owens & Minor | | Services & Goods | 24.79 | 61 | 3.03 | 28.65% |
| CHCO | City Holding | | Financials | 103.01 | 65 | 3.03 | -6.58% |
| CADE | Cadence Ban | | Financials | 27.17 | 68 | 3.03 | -8.18% |
| GSBC | Great Southern | | Financials | 52.45 | 65 | 3.02 | -11.63% |
| MOV | Movado Group | | Consumer Staples | 25.57 | 32 | 3.02 | -15.19% |
| PSMT | PriceSmart | | Services & Goods | 82.85 | 68 | 3.02 | 9.33% |
| KIDS | OrthoPediatrics | | Health Care | 30.35 | 69 | 3.02 | -6.64% |


| Too many stocks? View smallcap stocks filtered by marketcap & sector |
| Marketcap: All SmallCap Stocks (default-no microcap), Large, Mid-Range, Small |
| Smallcap Sector: Tech, Finance, Energy, Staples, Retail, Industrial, Materials, & Medical |
|
Get the most comprehensive stock market coverage daily at 12Stocks.com ➞ Best Stocks Today ➞ Best Stocks Weekly ➞ Best Stocks Year-to-Date ➞ Best Stocks Trends ➞  Best Stocks Today 12Stocks.com Best Nasdaq Stocks ➞ Best S&P 500 Stocks ➞ Best Tech Stocks ➞ Best Biotech Stocks ➞ |
| Detailed Overview of SmallCap Stocks |
| SmallCap Technical Overview, Leaders & Laggards, Top SmallCap ETF Funds & Detailed SmallCap Stocks List, Charts, Trends & More |
| Smallcap: Technical Analysis, Trends & YTD Performance | |
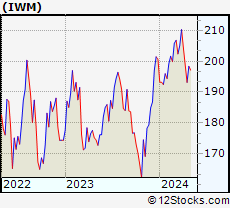
| SmallCap segment as represented by
IWM, an exchange-traded fund [ETF], holds basket of thousands of smallcap stocks from across all major sectors of the US stock market. The smallcap index (contains stocks like Riverbed & Sotheby's) is down by -3.77% and is currently underperforming the overall market by -7.15% year-to-date. Below is a quick view of technical charts and trends: | |
 IWM Weekly Chart |
|
| Long Term Trend: Good | |
| Medium Term Trend: Not Good | |
 IWM Daily Chart |
|
| Short Term Trend: Deteriorating | |
| Overall Trend Score: 23 | |
| YTD Performance: -3.77% | |
| **Trend Scores & Views Are Only For Educational Purposes And Not For Investing | |
| 12Stocks.com: Top Performing Small Cap Index Stocks | ||||||||||||||||||||||||||||||||||||||||||||||||
 The top performing Small Cap Index stocks year to date are
Now, more recently, over last week, the top performing Small Cap Index stocks on the move are


|
||||||||||||||||||||||||||||||||||||||||||||||||
| 12Stocks.com: Investing in Smallcap Index using Exchange Traded Funds | |
|
The following table shows list of key exchange traded funds (ETF) that
help investors track Smallcap index. The following list also includes leveraged ETF funds that track twice or thrice the daily returns of Smallcap indices. Short or inverse ETF funds move in the opposite direction to the index they track and are useful during market pullbacks or during bear markets. Quick View: Move mouse or cursor over ETF symbol (ticker) to view short-term technical chart and over ETF name to view long term chart. Click on ticker or stock name for detailed view. Click on to add stock symbol to your watchlist and to view watchlist. |
12Stocks.com List of ETFs that track Smallcap Index
| Ticker | ETF Name | Watchlist | Recent Price | Smart Investing & Trading Score | Change % | Week % | Year-to-date % |
| IWM | iShares Russell 2000 | | 193.14 | 23 | 0.16 | -2.79 | -3.77% |
| IJR | iShares Core S&P Small-Cap | | 103.22 | 10 | 0.86 | -1.23 | -4.65% |
| IWN | iShares Russell 2000 Value | | 147.78 | 10 | 0.99 | -1.73 | -4.86% |
| VTWO | Vanguard Russell 2000 ETF | | 78.08 | 23 | 0.17 | -2.79 | -3.72% |
| IWO | iShares Russell 2000 Growth | | 245.29 | 36 | -0.67 | -3.94 | -2.75% |
| IJS | iShares S&P Small-Cap 600 Value | | 95.61 | 17 | 1.16 | -0.58 | -7.24% |
| IJT | iShares S&P Small-Cap 600 Growth | | 122.21 | 23 | 0.53 | -2.06 | -2.34% |
| XSLV | PowerShares S&P SmallCap Low Volatil ETF | | 42.18 | 17 | 1.27 | 0.21 | -4.46% |
| SAA | ProShares Ultra SmallCap600 | | 21.80 | 18 | 0.83 | -3.37 | -12.63% |
| SMLV | SPDR SSGA US Small Cap Low Volatil ETF | | 106.09 | 37 | 2.18 | 1.03 | -5.71% |
| SDD | ProShares UltraShort SmallCap600 | | 20.34 | 76 | -1.69 | 2.57 | 10.38% |
| SBB | ProShares Short SmallCap600 | | 16.84 | 76 | -0.82 | 1.77 | 5.71% |
| 12Stocks.com: Charts, Trends, Fundamental Data and Performances of SmallCap Stocks | |
|
We now take in-depth look at all SmallCap stocks including charts, multi-period performances and overall trends (as measured by Smart Investing & Trading Score). One can sort SmallCap stocks (click link to choose) by Daily, Weekly and by Year-to-Date performances. Also, one can sort by size of the company or by market capitalization. |
| Select Your Default Chart Type: | |||||
| |||||
| Click on stock symbol or name for detailed view. Click on to add stock symbol to your watchlist and to view watchlist. Quick View: Move mouse or cursor over "Daily" to quickly view daily technical stock chart and over "Weekly" to view weekly technical stock chart. | |||||

 | RBOT Vicarious Surgical Inc. |
| Sector: Health Care | |
| SubSector: Medical Devices | |
| MarketCap: 241 Millions | |
| Recent Price: 0.29 Smart Investing & Trading Score: 40 | |
| Day Percent Change: 3.23% Day Change: 0.01 | |
| Week Change: -8.05% Year-to-date Change: -21.5% | |
| RBOT Links: Profile News Message Board | |
| Charts:- Daily , Weekly | |
| Add RBOT to Watchlist: View: Get Complete RBOT Trend Analysis ➞ | |
 | WAFD Washington Federal, Inc. |
| Sector: Financials | |
| SubSector: Savings & Loans | |
| MarketCap: 2219.2 Millions | |
| Recent Price: 27.90 Smart Investing & Trading Score: 52 | |
| Day Percent Change: 3.22% Day Change: 0.87 | |
| Week Change: 3.91% Year-to-date Change: -15.4% | |
| WAFD Links: Profile News Message Board | |
| Charts:- Daily , Weekly | |
| Add WAFD to Watchlist: View: Get Complete WAFD Trend Analysis ➞ | |
 | FCF First Commonwealth Financial Corporation |
| Sector: Financials | |
| SubSector: Regional - Northeast Banks | |
| MarketCap: 900.299 Millions | |
| Recent Price: 13.20 Smart Investing & Trading Score: 52 | |
| Day Percent Change: 3.21% Day Change: 0.41 | |
| Week Change: 3.61% Year-to-date Change: -14.5% | |
| FCF Links: Profile News Message Board | |
| Charts:- Daily , Weekly | |
| Add FCF to Watchlist: View: Get Complete FCF Trend Analysis ➞ | |
 | PKST Peakstone Realty Trust |
| Sector: Financials | |
| SubSector: REIT - Diversified | |
| MarketCap: 1050 Millions | |
| Recent Price: 12.88 Smart Investing & Trading Score: 27 | |
| Day Percent Change: 3.21% Day Change: 0.40 | |
| Week Change: -6.46% Year-to-date Change: -37.2% | |
| PKST Links: Profile News Message Board | |
| Charts:- Daily , Weekly | |
| Add PKST to Watchlist: View: Get Complete PKST Trend Analysis ➞ | |
 | IPAR Inter Parfums, Inc. |
| Sector: Consumer Staples | |
| SubSector: Personal Products | |
| MarketCap: 1302.55 Millions | |
| Recent Price: 127.88 Smart Investing & Trading Score: 32 | |
| Day Percent Change: 3.20% Day Change: 3.96 | |
| Week Change: 1.19% Year-to-date Change: -11.2% | |
| IPAR Links: Profile News Message Board | |
| Charts:- Daily , Weekly | |
| Add IPAR to Watchlist: View: Get Complete IPAR Trend Analysis ➞ | |
 | WTTR Select Energy Services, Inc. |
| Sector: Industrials | |
| SubSector: Pollution & Treatment Controls | |
| MarketCap: 347.075 Millions | |
| Recent Price: 9.34 Smart Investing & Trading Score: 83 | |
| Day Percent Change: 3.20% Day Change: 0.29 | |
| Week Change: 1.52% Year-to-date Change: 23.1% | |
| WTTR Links: Profile News Message Board | |
| Charts:- Daily , Weekly | |
| Add WTTR to Watchlist: View: Get Complete WTTR Trend Analysis ➞ | |
 | BY Byline Bancorp, Inc. |
| Sector: Financials | |
| SubSector: Regional - Midwest Banks | |
| MarketCap: 381.87 Millions | |
| Recent Price: 20.72 Smart Investing & Trading Score: 52 | |
| Day Percent Change: 3.19% Day Change: 0.64 | |
| Week Change: 2.63% Year-to-date Change: -12.1% | |
| BY Links: Profile News Message Board | |
| Charts:- Daily , Weekly | |
| Add BY to Watchlist: View: Get Complete BY Trend Analysis ➞ | |
 | UBSI United Bankshares, Inc. |
| Sector: Financials | |
| SubSector: Regional - Mid-Atlantic Banks | |
| MarketCap: 2286.79 Millions | |
| Recent Price: 34.17 Smart Investing & Trading Score: 52 | |
| Day Percent Change: 3.17% Day Change: 1.05 | |
| Week Change: 3.17% Year-to-date Change: -9.0% | |
| UBSI Links: Profile News Message Board | |
| Charts:- Daily , Weekly | |
| Add UBSI to Watchlist: View: Get Complete UBSI Trend Analysis ➞ | |
 | TOWN TowneBank |
| Sector: Financials | |
| SubSector: Regional - Mid-Atlantic Banks | |
| MarketCap: 1344.09 Millions | |
| Recent Price: 27.00 Smart Investing & Trading Score: 52 | |
| Day Percent Change: 3.17% Day Change: 0.83 | |
| Week Change: 2.27% Year-to-date Change: -9.3% | |
| TOWN Links: Profile News Message Board | |
| Charts:- Daily , Weekly | |
| Add TOWN to Watchlist: View: Get Complete TOWN Trend Analysis ➞ | |
 | CPF Central Pacific Financial Corp. |
| Sector: Financials | |
| SubSector: Regional - Pacific Banks | |
| MarketCap: 407.429 Millions | |
| Recent Price: 19.29 Smart Investing & Trading Score: 52 | |
| Day Percent Change: 3.16% Day Change: 0.59 | |
| Week Change: 1.31% Year-to-date Change: -2.0% | |
| CPF Links: Profile News Message Board | |
| Charts:- Daily , Weekly | |
| Add CPF to Watchlist: View: Get Complete CPF Trend Analysis ➞ | |
 | NATR Nature s Sunshine Products, Inc. |
| Sector: Health Care | |
| SubSector: Drugs - Generic | |
| MarketCap: 153.285 Millions | |
| Recent Price: 19.29 Smart Investing & Trading Score: 63 | |
| Day Percent Change: 3.16% Day Change: 0.59 | |
| Week Change: 1.42% Year-to-date Change: 11.6% | |
| NATR Links: Profile News Message Board | |
| Charts:- Daily , Weekly | |
| Add NATR to Watchlist: View: Get Complete NATR Trend Analysis ➞ | |
 | NWFL Norwood Financial Corp. |
| Sector: Financials | |
| SubSector: Regional - Northeast Banks | |
| MarketCap: 201.899 Millions | |
| Recent Price: 24.29 Smart Investing & Trading Score: 42 | |
| Day Percent Change: 3.14% Day Change: 0.74 | |
| Week Change: 0.25% Year-to-date Change: -26.2% | |
| NWFL Links: Profile News Message Board | |
| Charts:- Daily , Weekly | |
| Add NWFL to Watchlist: View: Get Complete NWFL Trend Analysis ➞ | |
 | CARG CarGurus, Inc. |
| Sector: Services & Goods | |
| SubSector: Auto Dealerships | |
| MarketCap: 2099.31 Millions | |
| Recent Price: 22.20 Smart Investing & Trading Score: 32 | |
| Day Percent Change: 3.09% Day Change: 0.66 | |
| Week Change: -0.69% Year-to-date Change: -8.1% | |
| CARG Links: Profile News Message Board | |
| Charts:- Daily , Weekly | |
| Add CARG to Watchlist: View: Get Complete CARG Trend Analysis ➞ | |
 | DOLE Dole plc |
| Sector: Consumer Staples | |
| SubSector: Farm Products | |
| MarketCap: 1300 Millions | |
| Recent Price: 12.11 Smart Investing & Trading Score: 100 | |
| Day Percent Change: 3.06% Day Change: 0.36 | |
| Week Change: 3.77% Year-to-date Change: -1.8% | |
| DOLE Links: Profile News Message Board | |
| Charts:- Daily , Weekly | |
| Add DOLE to Watchlist: View: Get Complete DOLE Trend Analysis ➞ | |
 | NAPA The Duckhorn Portfolio, Inc. |
| Sector: Consumer Staples | |
| SubSector: Beverages - Wineries & Distilleries | |
| MarketCap: 1500 Millions | |
| Recent Price: 8.25 Smart Investing & Trading Score: 27 | |
| Day Percent Change: 3.06% Day Change: 0.24 | |
| Week Change: 0.36% Year-to-date Change: -16.2% | |
| NAPA Links: Profile News Message Board | |
| Charts:- Daily , Weekly | |
| Add NAPA to Watchlist: View: Get Complete NAPA Trend Analysis ➞ | |
 | TLYS Tilly s, Inc. |
| Sector: Services & Goods | |
| SubSector: Apparel Stores | |
| MarketCap: 127.408 Millions | |
| Recent Price: 5.75 Smart Investing & Trading Score: 32 | |
| Day Percent Change: 3.05% Day Change: 0.17 | |
| Week Change: -1.54% Year-to-date Change: -23.7% | |
| TLYS Links: Profile News Message Board | |
| Charts:- Daily , Weekly | |
| Add TLYS to Watchlist: View: Get Complete TLYS Trend Analysis ➞ | |
 | NHC National HealthCare Corporation |
| Sector: Health Care | |
| SubSector: Long-Term Care Facilities | |
| MarketCap: 1164.86 Millions | |
| Recent Price: 90.62 Smart Investing & Trading Score: 32 | |
| Day Percent Change: 3.04% Day Change: 2.67 | |
| Week Change: 1.66% Year-to-date Change: -2.0% | |
| NHC Links: Profile News Message Board | |
| Charts:- Daily , Weekly | |
| Add NHC to Watchlist: View: Get Complete NHC Trend Analysis ➞ | |
 | CRK Comstock Resources, Inc. |
| Sector: Energy | |
| SubSector: Independent Oil & Gas | |
| MarketCap: 959.793 Millions | |
| Recent Price: 9.52 Smart Investing & Trading Score: 93 | |
| Day Percent Change: 3.03% Day Change: 0.28 | |
| Week Change: -0.42% Year-to-date Change: 7.6% | |
| CRK Links: Profile News Message Board | |
| Charts:- Daily , Weekly | |
| Add CRK to Watchlist: View: Get Complete CRK Trend Analysis ➞ | |
 | OMI Owens & Minor, Inc. |
| Sector: Services & Goods | |
| SubSector: Medical Equipment Wholesale | |
| MarketCap: 403.92 Millions | |
| Recent Price: 24.79 Smart Investing & Trading Score: 61 | |
| Day Percent Change: 3.03% Day Change: 0.73 | |
| Week Change: -3.09% Year-to-date Change: 28.7% | |
| OMI Links: Profile News Message Board | |
| Charts:- Daily , Weekly | |
| Add OMI to Watchlist: View: Get Complete OMI Trend Analysis ➞ | |
 | CHCO City Holding Company |
| Sector: Financials | |
| SubSector: Regional - Mid-Atlantic Banks | |
| MarketCap: 1059.59 Millions | |
| Recent Price: 103.01 Smart Investing & Trading Score: 65 | |
| Day Percent Change: 3.03% Day Change: 3.03 | |
| Week Change: 4.28% Year-to-date Change: -6.6% | |
| CHCO Links: Profile News Message Board | |
| Charts:- Daily , Weekly | |
| Add CHCO to Watchlist: View: Get Complete CHCO Trend Analysis ➞ | |
 | CADE Cadence Bancorporation |
| Sector: Financials | |
| SubSector: Regional - Southeast Banks | |
| MarketCap: 756.335 Millions | |
| Recent Price: 27.17 Smart Investing & Trading Score: 68 | |
| Day Percent Change: 3.03% Day Change: 0.80 | |
| Week Change: 1.27% Year-to-date Change: -8.2% | |
| CADE Links: Profile News Message Board | |
| Charts:- Daily , Weekly | |
| Add CADE to Watchlist: View: Get Complete CADE Trend Analysis ➞ | |
 | GSBC Great Southern Bancorp, Inc. |
| Sector: Financials | |
| SubSector: Regional - Southwest Banks | |
| MarketCap: 524.765 Millions | |
| Recent Price: 52.45 Smart Investing & Trading Score: 65 | |
| Day Percent Change: 3.02% Day Change: 1.54 | |
| Week Change: 3.02% Year-to-date Change: -11.6% | |
| GSBC Links: Profile News Message Board | |
| Charts:- Daily , Weekly | |
| Add GSBC to Watchlist: View: Get Complete GSBC Trend Analysis ➞ | |
 | MOV Movado Group, Inc. |
| Sector: Consumer Staples | |
| SubSector: Recreational Goods, Other | |
| MarketCap: 161.659 Millions | |
| Recent Price: 25.57 Smart Investing & Trading Score: 32 | |
| Day Percent Change: 3.02% Day Change: 0.75 | |
| Week Change: 1.51% Year-to-date Change: -15.2% | |
| MOV Links: Profile News Message Board | |
| Charts:- Daily , Weekly | |
| Add MOV to Watchlist: View: Get Complete MOV Trend Analysis ➞ | |
 | PSMT PriceSmart, Inc. |
| Sector: Services & Goods | |
| SubSector: Discount, Variety Stores | |
| MarketCap: 1655.72 Millions | |
| Recent Price: 82.85 Smart Investing & Trading Score: 68 | |
| Day Percent Change: 3.02% Day Change: 2.43 | |
| Week Change: 4.28% Year-to-date Change: 9.3% | |
| PSMT Links: Profile News Message Board | |
| Charts:- Daily , Weekly | |
| Add PSMT to Watchlist: View: Get Complete PSMT Trend Analysis ➞ | |
 | KIDS OrthoPediatrics Corp. |
| Sector: Health Care | |
| SubSector: Medical Appliances & Equipment | |
| MarketCap: 742.28 Millions | |
| Recent Price: 30.35 Smart Investing & Trading Score: 69 | |
| Day Percent Change: 3.02% Day Change: 0.89 | |
| Week Change: -2.38% Year-to-date Change: -6.6% | |
| KIDS Links: Profile News Message Board | |
| Charts:- Daily , Weekly | |
| Add KIDS to Watchlist: View: Get Complete KIDS Trend Analysis ➞ | |
| Too many stocks? View smallcap stocks filtered by marketcap & sector |
| Marketcap: All SmallCap Stocks (default-no microcap), Large, Mid-Range, Small & MicroCap |
| Sector: Tech, Finance, Energy, Staples, Retail, Industrial, Materials, Utilities & Medical |
|
Best Stocks Today 12Stocks.com |
© 2024 12Stocks.com Terms & Conditions Privacy Contact Us
All Information Provided Only For Education And Not To Be Used For Investing or Trading. See Terms & Conditions


One More Thing ... Get Best Stocks Delivered Daily!
Never Ever Miss A Move With Our Top Ten Stocks Lists
Find Best Stocks In Any Market - Bull or Bear Market
Take A Peek At Our Top Ten Stocks Lists: Daily, Weekly, Year-to-Date & Top Trends
Find Best Stocks In Any Market - Bull or Bear Market
Take A Peek At Our Top Ten Stocks Lists: Daily, Weekly, Year-to-Date & Top Trends
Smallcap Stocks With Best Up Trends [0-bearish to 100-bullish]: Vertex Energy[100], BancFirst [100], Calavo Growers[100], Old Second[100], Excelerate Energy[100], Gannett Co[100], Core Molding[100], Tejon Ranch[100], United Fire[100], Victory Capital[100], Andersons [100]
Best Smallcap Stocks Year-to-Date:
Agenus [541.38%], CareMax [429.9%], Janux [353.14%], Viking [240.78%], Alpine Immune[238.94%], Longboard [185.43%], Arcutis Bio[181.42%], Avidity Biosciences[153.65%], Super Micro[151.06%], Vera [145.48%], Stoke [129.66%] Best Smallcap Stocks This Week:
Macatawa Bank[47.34%], Vertex Energy[43.27%], Snap One[29.73%], Humacyte [28.47%], Vanda [24.03%], ALX Oncology[22.49%], ContextLogic [16.8%], ProKidney [16.57%], Calavo Growers[16.24%], Badger Meter[15.61%], Accolade [13.45%] Best Smallcap Stocks Daily:
Tellurian [28.11%], Origin Materials[19.59%], Metropolitan Bank[18.01%], Genelux [14.25%], Humacyte [14.02%], Vertex Energy[13.74%], Chemung Financial[10.29%], Gevo [10.14%], Riot Blockchain[10.13%], Marathon Patent[9.78%], Emergent BioSolutions[9.68%]