
 Login Sign Up


| |||||
 |  | ||||

| 12Stocks.com Market Intelligence |
Best SmallCap Stocks
|
| In a hurry? Small Cap Stock Lists: Performance Trends Table, Stock Charts
Sort Small Cap stocks: Daily, Weekly, Year-to-Date, Market Cap & Trends. Filter Small Cap stocks list by sector: Show all, Tech, Finance, Energy, Staples, Retail, Industrial, Materials, Utilities and HealthCare Filter Small Cap stocks list by size: All Large Medium Small and MicroCap |
| 12Stocks.com Small Cap Stocks Performances & Trends Daily | |||||||||
|
|  The overall Smart Investing & Trading Score is 58 (0-bearish to 100-bullish) which puts Small Cap index in short term neutral trend. The Smart Investing & Trading Score from previous trading session is 23 and hence an improvement of trend.
| ||||||||
Here are the Smart Investing & Trading Scores of the most requested small cap stocks at 12Stocks.com (click stock name for detailed review):
|


| 12Stocks.com: Investing in Smallcap Index with Stocks | |
|
The following table helps investors and traders sort through current performance and trends (as measured by Smart Investing & Trading Score) of various
stocks in the Smallcap Index. Quick View: Move mouse or cursor over stock symbol (ticker) to view short-term technical chart and over stock name to view long term chart. Click on  to add stock symbol to your watchlist and to add stock symbol to your watchlist and  to view watchlist. Click on any ticker or stock name for detailed market intelligence report for that stock. to view watchlist. Click on any ticker or stock name for detailed market intelligence report for that stock. |
12Stocks.com Performance of Stocks in Smallcap Index
| Ticker | Stock Name | Watchlist | Category | Recent Price | Smart Investing & Trading Score | Change % | YTD Change% |
| TITN | Titan Machinery |   | Services & Goods | 23.01 | 52 | -0.99 | -20.33% |
| MWA | Mueller Water | | Industrials | 15.81 | 90 | -1.00 | 9.79% |
| NRC | National Research | | Health Care | 33.69 | 25 | -1.00 | -14.84% |
| GRND | Grindr | | Technology | 9.68 | 46 | -1.02 | 8.04% |
| BJRI | BJ s | | Services & Goods | 31.77 | 18 | -1.03 | -11.77% |
| PNRG | PrimeEnergy Resources | | Energy | 100.00 | 58 | -1.03 | -5.97% |
| RCEL | Avita Medical | | Health Care | 8.55 | 10 | -1.04 | -37.68% |
| INBX | Inhibrx | | Health Care | 34.10 | 0 | -1.04 | -10.29% |
| NAT | Nordic American | | Transports | 3.76 | 10 | -1.05 | -10.48% |
| KTOS | Kratos Defense | | Services & Goods | 17.83 | 68 | -1.05 | -12.12% |
| PUMP | ProPetro Holding | | Energy | 8.45 | 40 | -1.05 | 0.84% |
| ANAB | AnaptysBio | | Health Care | 19.66 | 0 | -1.06 | -8.22% |
| VKTX | Viking | | Health Care | 62.74 | 41 | -1.07 | 237.13% |
| ARCH | Arch Coal | | Materials | 161.39 | 25 | -1.10 | -2.74% |
| RUSHB | Rush Enterprises | | Services & Goods | 46.00 | 42 | -1.12 | -13.17% |
| ADMA | ADMA Biologics | | Health Care | 6.20 | 75 | -1.12 | 37.17% |
| HRI | Herc | | Transports | 148.40 | 23 | -1.13 | -0.33% |
| ASUR | Asure | | Technology | 6.91 | 17 | -1.14 | -27.42% |
| LNTH | Lantheus | | Health Care | 63.07 | 95 | -1.16 | 1.73% |
| LBRT | Liberty Oilfield | | Energy | 22.12 | 51 | -1.16 | 21.94% |
| WEYS | Weyco Group | | Consumer Staples | 28.80 | 25 | -1.17 | -8.16% |
| TCI | Transcontinental Realty | | Financials | 31.48 | 10 | -1.19 | -8.91% |
| MBUU | Malibu Boats | | Consumer Staples | 34.07 | 18 | -1.19 | -37.85% |
| SMBK | SmartFinancial | | Financials | 19.66 | 49 | -1.21 | -19.72% |
| NR | Newpark Resources | | Energy | 7.30 | 36 | -1.22 | 9.94% |


| Too many stocks? View smallcap stocks filtered by marketcap & sector |
| Marketcap: All SmallCap Stocks (default-no microcap), Large, Mid-Range, Small |
| Smallcap Sector: Tech, Finance, Energy, Staples, Retail, Industrial, Materials, & Medical |
|
Get the most comprehensive stock market coverage daily at 12Stocks.com ➞ Best Stocks Today ➞ Best Stocks Weekly ➞ Best Stocks Year-to-Date ➞ Best Stocks Trends ➞  Best Stocks Today 12Stocks.com Best Nasdaq Stocks ➞ Best S&P 500 Stocks ➞ Best Tech Stocks ➞ Best Biotech Stocks ➞ |
| Detailed Overview of SmallCap Stocks |
| SmallCap Technical Overview, Leaders & Laggards, Top SmallCap ETF Funds & Detailed SmallCap Stocks List, Charts, Trends & More |
| Smallcap: Technical Analysis, Trends & YTD Performance | |
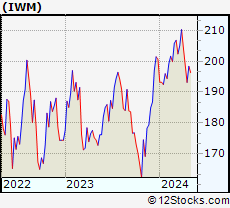
| SmallCap segment as represented by
IWM, an exchange-traded fund [ETF], holds basket of thousands of smallcap stocks from across all major sectors of the US stock market. The smallcap index (contains stocks like Riverbed & Sotheby's) is down by -2.7% and is currently underperforming the overall market by -7.09% year-to-date. Below is a quick view of technical charts and trends: | |
 IWM Weekly Chart |
|
| Long Term Trend: Good | |
| Medium Term Trend: Not Good | |
 IWM Daily Chart |
|
| Short Term Trend: Very Good | |
| Overall Trend Score: 58 | |
| YTD Performance: -2.7% | |
| **Trend Scores & Views Are Only For Educational Purposes And Not For Investing | |
| 12Stocks.com: Top Performing Small Cap Index Stocks | ||||||||||||||||||||||||||||||||||||||||||||||||
 The top performing Small Cap Index stocks year to date are
Now, more recently, over last week, the top performing Small Cap Index stocks on the move are


|
||||||||||||||||||||||||||||||||||||||||||||||||
| 12Stocks.com: Investing in Smallcap Index using Exchange Traded Funds | |
|
The following table shows list of key exchange traded funds (ETF) that
help investors track Smallcap index. The following list also includes leveraged ETF funds that track twice or thrice the daily returns of Smallcap indices. Short or inverse ETF funds move in the opposite direction to the index they track and are useful during market pullbacks or during bear markets. Quick View: Move mouse or cursor over ETF symbol (ticker) to view short-term technical chart and over ETF name to view long term chart. Click on ticker or stock name for detailed view. Click on to add stock symbol to your watchlist and to view watchlist. |
12Stocks.com List of ETFs that track Smallcap Index
| Ticker | ETF Name | Watchlist | Recent Price | Smart Investing & Trading Score | Change % | Week % | Year-to-date % |
| IWM | iShares Russell 2000 | | 195.30 | 58 | 1.12 | 1.12 | -2.7% |
| VTWO | Vanguard Russell 2000 ETF | | 78.92 | 58 | 1.08 | 1.08 | -2.69% |
| IWN | iShares Russell 2000 Value | | 149.51 | 63 | 1.17 | 1.17 | -3.75% |
| IJR | iShares Core S&P Small-Cap | | 103.47 | 45 | 0.24 | 0.24 | -4.42% |
| IWO | iShares Russell 2000 Growth | | 247.92 | 51 | 1.07 | 1.07 | -1.7% |
| IJS | iShares S&P Small-Cap 600 Value | | 96.43 | 32 | 0.86 | 0.86 | -6.44% |
| IJT | iShares S&P Small-Cap 600 Growth | | 123.36 | 70 | 0.94 | 0.94 | -1.42% |
| XSLV | PowerShares S&P SmallCap Low Volatil ETF | | 42.44 | 62 | 0.62 | 0.62 | -3.87% |
| SMLV | SPDR SSGA US Small Cap Low Volatil ETF | | 107.48 | 80 | 1.31 | 1.31 | -4.48% |
| SDD | ProShares UltraShort SmallCap600 | | 19.75 | 42 | -2.90 | -2.9 | 7.18% |
| SBB | ProShares Short SmallCap600 | | 16.62 | 42 | -1.31 | -1.31 | 4.33% |
| SAA | ProShares Ultra SmallCap600 | | 22.37 | 32 | 2.61 | 2.61 | -10.34% |
| 12Stocks.com: Charts, Trends, Fundamental Data and Performances of SmallCap Stocks | |
|
We now take in-depth look at all SmallCap stocks including charts, multi-period performances and overall trends (as measured by Smart Investing & Trading Score). One can sort SmallCap stocks (click link to choose) by Daily, Weekly and by Year-to-Date performances. Also, one can sort by size of the company or by market capitalization. |
| Select Your Default Chart Type: | |||||
| |||||
| Click on stock symbol or name for detailed view. Click on to add stock symbol to your watchlist and to view watchlist. Quick View: Move mouse or cursor over "Daily" to quickly view daily technical stock chart and over "Weekly" to view weekly technical stock chart. | |||||

 | TITN Titan Machinery Inc. |
| Sector: Services & Goods | |
| SubSector: Industrial Equipment Wholesale | |
| MarketCap: 208.958 Millions | |
| Recent Price: 23.01 Smart Investing & Trading Score: 52 | |
| Day Percent Change: -0.99% Day Change: -0.23 | |
| Week Change: -0.99% Year-to-date Change: -20.3% | |
| TITN Links: Profile News Message Board | |
| Charts:- Daily , Weekly | |
| Add TITN to Watchlist: View: Get Complete TITN Trend Analysis ➞ | |
 | MWA Mueller Water Products, Inc. |
| Sector: Industrials | |
| SubSector: Industrial Equipment & Components | |
| MarketCap: 1321.09 Millions | |
| Recent Price: 15.81 Smart Investing & Trading Score: 90 | |
| Day Percent Change: -1.00% Day Change: -0.16 | |
| Week Change: -1% Year-to-date Change: 9.8% | |
| MWA Links: Profile News Message Board | |
| Charts:- Daily , Weekly | |
| Add MWA to Watchlist: View: Get Complete MWA Trend Analysis ➞ | |
 | NRC National Research Corporation |
| Sector: Health Care | |
| SubSector: Medical Laboratories & Research | |
| MarketCap: 1187.7 Millions | |
| Recent Price: 33.69 Smart Investing & Trading Score: 25 | |
| Day Percent Change: -1.00% Day Change: -0.34 | |
| Week Change: -1% Year-to-date Change: -14.8% | |
| NRC Links: Profile News Message Board | |
| Charts:- Daily , Weekly | |
| Add NRC to Watchlist: View: Get Complete NRC Trend Analysis ➞ | |
 | GRND Grindr Inc. |
| Sector: Technology | |
| SubSector: Software - Application | |
| MarketCap: 929 Millions | |
| Recent Price: 9.68 Smart Investing & Trading Score: 46 | |
| Day Percent Change: -1.02% Day Change: -0.10 | |
| Week Change: -1.02% Year-to-date Change: 8.0% | |
| GRND Links: Profile News Message Board | |
| Charts:- Daily , Weekly | |
| Add GRND to Watchlist: View: Get Complete GRND Trend Analysis ➞ | |
 | BJRI BJ s Restaurants, Inc. |
| Sector: Services & Goods | |
| SubSector: Restaurants | |
| MarketCap: 183.67 Millions | |
| Recent Price: 31.77 Smart Investing & Trading Score: 18 | |
| Day Percent Change: -1.03% Day Change: -0.33 | |
| Week Change: -1.03% Year-to-date Change: -11.8% | |
| BJRI Links: Profile News Message Board | |
| Charts:- Daily , Weekly | |
| Add BJRI to Watchlist: View: Get Complete BJRI Trend Analysis ➞ | |
 | PNRG PrimeEnergy Resources Corporation |
| Sector: Energy | |
| SubSector: Independent Oil & Gas | |
| MarketCap: 112.593 Millions | |
| Recent Price: 100.00 Smart Investing & Trading Score: 58 | |
| Day Percent Change: -1.03% Day Change: -1.04 | |
| Week Change: -1.03% Year-to-date Change: -6.0% | |
| PNRG Links: Profile News Message Board | |
| Charts:- Daily , Weekly | |
| Add PNRG to Watchlist: View: Get Complete PNRG Trend Analysis ➞ | |
 | RCEL Avita Medical Limited |
| Sector: Health Care | |
| SubSector: Medical Appliances & Equipment | |
| MarketCap: 481.18 Millions | |
| Recent Price: 8.55 Smart Investing & Trading Score: 10 | |
| Day Percent Change: -1.04% Day Change: -0.09 | |
| Week Change: -1.04% Year-to-date Change: -37.7% | |
| RCEL Links: Profile News Message Board | |
| Charts:- Daily , Weekly | |
| Add RCEL to Watchlist: View: Get Complete RCEL Trend Analysis ➞ | |
 | INBX Inhibrx, Inc. |
| Sector: Health Care | |
| SubSector: Biotechnology | |
| MarketCap: 14187 Millions | |
| Recent Price: 34.10 Smart Investing & Trading Score: 0 | |
| Day Percent Change: -1.04% Day Change: -0.36 | |
| Week Change: -1.04% Year-to-date Change: -10.3% | |
| INBX Links: Profile News Message Board | |
| Charts:- Daily , Weekly | |
| Add INBX to Watchlist: View: Get Complete INBX Trend Analysis ➞ | |
 | NAT Nordic American Tankers Limited |
| Sector: Transports | |
| SubSector: Shipping | |
| MarketCap: 416.114 Millions | |
| Recent Price: 3.76 Smart Investing & Trading Score: 10 | |
| Day Percent Change: -1.05% Day Change: -0.04 | |
| Week Change: -1.05% Year-to-date Change: -10.5% | |
| NAT Links: Profile News Message Board | |
| Charts:- Daily , Weekly | |
| Add NAT to Watchlist: View: Get Complete NAT Trend Analysis ➞ | |
 | KTOS Kratos Defense & Security Solutions, Inc. |
| Sector: Services & Goods | |
| SubSector: Security & Protection Services | |
| MarketCap: 1369.63 Millions | |
| Recent Price: 17.83 Smart Investing & Trading Score: 68 | |
| Day Percent Change: -1.05% Day Change: -0.19 | |
| Week Change: -1.05% Year-to-date Change: -12.1% | |
| KTOS Links: Profile News Message Board | |
| Charts:- Daily , Weekly | |
| Add KTOS to Watchlist: View: Get Complete KTOS Trend Analysis ➞ | |
 | PUMP ProPetro Holding Corp. |
| Sector: Energy | |
| SubSector: Oil & Gas Equipment & Services | |
| MarketCap: 181.261 Millions | |
| Recent Price: 8.45 Smart Investing & Trading Score: 40 | |
| Day Percent Change: -1.05% Day Change: -0.09 | |
| Week Change: -1.05% Year-to-date Change: 0.8% | |
| PUMP Links: Profile News Message Board | |
| Charts:- Daily , Weekly | |
| Add PUMP to Watchlist: View: Get Complete PUMP Trend Analysis ➞ | |
 | ANAB AnaptysBio, Inc. |
| Sector: Health Care | |
| SubSector: Biotechnology | |
| MarketCap: 405.985 Millions | |
| Recent Price: 19.66 Smart Investing & Trading Score: 0 | |
| Day Percent Change: -1.06% Day Change: -0.21 | |
| Week Change: -1.06% Year-to-date Change: -8.2% | |
| ANAB Links: Profile News Message Board | |
| Charts:- Daily , Weekly | |
| Add ANAB to Watchlist: View: Get Complete ANAB Trend Analysis ➞ | |
 | VKTX Viking Therapeutics, Inc. |
| Sector: Health Care | |
| SubSector: Biotechnology | |
| MarketCap: 388.585 Millions | |
| Recent Price: 62.74 Smart Investing & Trading Score: 41 | |
| Day Percent Change: -1.07% Day Change: -0.68 | |
| Week Change: -1.07% Year-to-date Change: 237.1% | |
| VKTX Links: Profile News Message Board | |
| Charts:- Daily , Weekly | |
| Add VKTX to Watchlist: View: Get Complete VKTX Trend Analysis ➞ | |
 | ARCH Arch Coal, Inc. |
| Sector: Materials | |
| SubSector: Industrial Metals & Minerals | |
| MarketCap: 547.21 Millions | |
| Recent Price: 161.39 Smart Investing & Trading Score: 25 | |
| Day Percent Change: -1.10% Day Change: -1.79 | |
| Week Change: -1.1% Year-to-date Change: -2.7% | |
| ARCH Links: Profile News Message Board | |
| Charts:- Daily , Weekly | |
| Add ARCH to Watchlist: View: Get Complete ARCH Trend Analysis ➞ | |
 | RUSHB Rush Enterprises, Inc. |
| Sector: Services & Goods | |
| SubSector: Auto Dealerships | |
| MarketCap: 203.221 Millions | |
| Recent Price: 46.00 Smart Investing & Trading Score: 42 | |
| Day Percent Change: -1.12% Day Change: -0.52 | |
| Week Change: -1.12% Year-to-date Change: -13.2% | |
| RUSHB Links: Profile News Message Board | |
| Charts:- Daily , Weekly | |
| Add RUSHB to Watchlist: View: Get Complete RUSHB Trend Analysis ➞ | |
 | ADMA ADMA Biologics, Inc. |
| Sector: Health Care | |
| SubSector: Biotechnology | |
| MarketCap: 204.985 Millions | |
| Recent Price: 6.20 Smart Investing & Trading Score: 75 | |
| Day Percent Change: -1.12% Day Change: -0.07 | |
| Week Change: -1.12% Year-to-date Change: 37.2% | |
| ADMA Links: Profile News Message Board | |
| Charts:- Daily , Weekly | |
| Add ADMA to Watchlist: View: Get Complete ADMA Trend Analysis ➞ | |
 | HRI Herc Holdings Inc. |
| Sector: Transports | |
| SubSector: Rental & Leasing Services | |
| MarketCap: 469.344 Millions | |
| Recent Price: 148.40 Smart Investing & Trading Score: 23 | |
| Day Percent Change: -1.13% Day Change: -1.69 | |
| Week Change: -1.13% Year-to-date Change: -0.3% | |
| HRI Links: Profile News Message Board | |
| Charts:- Daily , Weekly | |
| Add HRI to Watchlist: View: Get Complete HRI Trend Analysis ➞ | |
 | ASUR Asure Software, Inc. |
| Sector: Technology | |
| SubSector: Business Software & Services | |
| MarketCap: 103.758 Millions | |
| Recent Price: 6.91 Smart Investing & Trading Score: 17 | |
| Day Percent Change: -1.14% Day Change: -0.08 | |
| Week Change: -1.14% Year-to-date Change: -27.4% | |
| ASUR Links: Profile News Message Board | |
| Charts:- Daily , Weekly | |
| Add ASUR to Watchlist: View: Get Complete ASUR Trend Analysis ➞ | |
 | LNTH Lantheus Holdings, Inc. |
| Sector: Health Care | |
| SubSector: Medical Appliances & Equipment | |
| MarketCap: 467.18 Millions | |
| Recent Price: 63.07 Smart Investing & Trading Score: 95 | |
| Day Percent Change: -1.16% Day Change: -0.74 | |
| Week Change: -1.16% Year-to-date Change: 1.7% | |
| LNTH Links: Profile News Message Board | |
| Charts:- Daily , Weekly | |
| Add LNTH to Watchlist: View: Get Complete LNTH Trend Analysis ➞ | |
 | LBRT Liberty Oilfield Services Inc. |
| Sector: Energy | |
| SubSector: Oil & Gas Equipment & Services | |
| MarketCap: 308.261 Millions | |
| Recent Price: 22.12 Smart Investing & Trading Score: 51 | |
| Day Percent Change: -1.16% Day Change: -0.26 | |
| Week Change: -1.16% Year-to-date Change: 21.9% | |
| LBRT Links: Profile News Message Board | |
| Charts:- Daily , Weekly | |
| Add LBRT to Watchlist: View: Get Complete LBRT Trend Analysis ➞ | |
 | WEYS Weyco Group, Inc. |
| Sector: Consumer Staples | |
| SubSector: Textile - Apparel Footwear & Accessories | |
| MarketCap: 198.87 Millions | |
| Recent Price: 28.80 Smart Investing & Trading Score: 25 | |
| Day Percent Change: -1.17% Day Change: -0.34 | |
| Week Change: -1.17% Year-to-date Change: -8.2% | |
| WEYS Links: Profile News Message Board | |
| Charts:- Daily , Weekly | |
| Add WEYS to Watchlist: View: Get Complete WEYS Trend Analysis ➞ | |
 | TCI Transcontinental Realty Investors, Inc. |
| Sector: Financials | |
| SubSector: REIT - Diversified | |
| MarketCap: 158.653 Millions | |
| Recent Price: 31.48 Smart Investing & Trading Score: 10 | |
| Day Percent Change: -1.19% Day Change: -0.38 | |
| Week Change: -1.19% Year-to-date Change: -8.9% | |
| TCI Links: Profile News Message Board | |
| Charts:- Daily , Weekly | |
| Add TCI to Watchlist: View: Get Complete TCI Trend Analysis ➞ | |
 | MBUU Malibu Boats, Inc. |
| Sector: Consumer Staples | |
| SubSector: Recreational Goods, Other | |
| MarketCap: 561.059 Millions | |
| Recent Price: 34.07 Smart Investing & Trading Score: 18 | |
| Day Percent Change: -1.19% Day Change: -0.41 | |
| Week Change: -1.19% Year-to-date Change: -37.9% | |
| MBUU Links: Profile News Message Board | |
| Charts:- Daily , Weekly | |
| Add MBUU to Watchlist: View: Get Complete MBUU Trend Analysis ➞ | |
 | SMBK SmartFinancial, Inc. |
| Sector: Financials | |
| SubSector: Regional - Southeast Banks | |
| MarketCap: 174.035 Millions | |
| Recent Price: 19.66 Smart Investing & Trading Score: 49 | |
| Day Percent Change: -1.21% Day Change: -0.24 | |
| Week Change: -1.21% Year-to-date Change: -19.7% | |
| SMBK Links: Profile News Message Board | |
| Charts:- Daily , Weekly | |
| Add SMBK to Watchlist: View: Get Complete SMBK Trend Analysis ➞ | |
 | NR Newpark Resources, Inc. |
| Sector: Energy | |
| SubSector: Oil & Gas Equipment & Services | |
| MarketCap: 109.261 Millions | |
| Recent Price: 7.30 Smart Investing & Trading Score: 36 | |
| Day Percent Change: -1.22% Day Change: -0.09 | |
| Week Change: -1.22% Year-to-date Change: 9.9% | |
| NR Links: Profile News Message Board | |
| Charts:- Daily , Weekly | |
| Add NR to Watchlist: View: Get Complete NR Trend Analysis ➞ | |
| Too many stocks? View smallcap stocks filtered by marketcap & sector |
| Marketcap: All SmallCap Stocks (default-no microcap), Large, Mid-Range, Small & MicroCap |
| Sector: Tech, Finance, Energy, Staples, Retail, Industrial, Materials, Utilities & Medical |
|
Best Stocks Today 12Stocks.com |
© 2024 12Stocks.com Terms & Conditions Privacy Contact Us
All Information Provided Only For Education And Not To Be Used For Investing or Trading. See Terms & Conditions


One More Thing ... Get Best Stocks Delivered Daily!
Never Ever Miss A Move With Our Top Ten Stocks Lists
Find Best Stocks In Any Market - Bull or Bear Market
Take A Peek At Our Top Ten Stocks Lists: Daily, Weekly, Year-to-Date & Top Trends
Find Best Stocks In Any Market - Bull or Bear Market
Take A Peek At Our Top Ten Stocks Lists: Daily, Weekly, Year-to-Date & Top Trends
Smallcap Stocks With Best Up Trends [0-bearish to 100-bullish]: Matterport [100], Riot Blockchain[100], Ingevity [100], Vista Outdoor[100], Park National[100], Maiden [100], Amplify Energy[100], Excelerate Energy[100], Perella Weinberg[100], Zuora [100], Vertex Energy[100]
Best Smallcap Stocks Year-to-Date:
CareMax [561.86%], Janux [354.91%], Alpine Immune[239.18%], Viking [237.13%], Longboard [205.56%], Arcutis Bio[176.78%], Avidity Biosciences[167.26%], Vera [152.78%], Super Micro[152.24%], Hippo [125.58%], Y-mAbs [122.29%] Best Smallcap Stocks This Week:
Matterport [175.86%], ProKidney [33.33%], CareMax [24.9%], Riot Blockchain[23.11%], Cipher Mining[18.75%], OptiNose [15.07%], Assertio [13.48%], MicroStrategy [12.77%], Vuzix [11.57%], Seres [11.56%], Energy Vault[11.11%] Best Smallcap Stocks Daily:
Matterport [175.86%], ProKidney [33.33%], CareMax [24.90%], Riot Blockchain[23.11%], Cipher Mining[18.75%], OptiNose [15.07%], Assertio [13.48%], MicroStrategy [12.77%], Vuzix [11.57%], Seres [11.56%], Energy Vault[11.11%]