
 Login Sign Up


| |||||
 |  | ||||

| 12Stocks.com Market Intelligence |
Best SmallCap Stocks
|
| In a hurry? Small Cap Stock Lists: Performance Trends Table, Stock Charts
Sort Small Cap stocks: Daily, Weekly, Year-to-Date, Market Cap & Trends. Filter Small Cap stocks list by sector: Show all, Tech, Finance, Energy, Staples, Retail, Industrial, Materials, Utilities and HealthCare Filter Small Cap stocks list by size: All Large Medium Small and MicroCap |
| 12Stocks.com Small Cap Stocks Performances & Trends Daily | |||||||||
|
|  The overall Smart Investing & Trading Score is 13 (0-bearish to 100-bullish) which puts Small Cap index in short term bearish trend. The Smart Investing & Trading Score from previous trading session is 26 and hence a deterioration of trend.
| ||||||||
Here are the Smart Investing & Trading Scores of the most requested small cap stocks at 12Stocks.com (click stock name for detailed review):
|


| 12Stocks.com: Investing in Smallcap Index with Stocks | |
|
The following table helps investors and traders sort through current performance and trends (as measured by Smart Investing & Trading Score) of various
stocks in the Smallcap Index. Quick View: Move mouse or cursor over stock symbol (ticker) to view short-term technical chart and over stock name to view long term chart. Click on  to add stock symbol to your watchlist and to add stock symbol to your watchlist and  to view watchlist. Click on any ticker or stock name for detailed market intelligence report for that stock. to view watchlist. Click on any ticker or stock name for detailed market intelligence report for that stock. |
12Stocks.com Performance of Stocks in Smallcap Index
| Ticker | Stock Name | Watchlist | Category | Recent Price | Smart Investing & Trading Score | Change % | YTD Change% |
| CWK | Cushman & Wakefield |   | Financials | 9.27 | 10 | -1.49 | -14.17% |
| SPT | Sprout Social | | Technology | 52.16 | 7 | -1.49 | -15.10% |
| PBI | Pitney Bowes | | Consumer Staples | 3.93 | 0 | -1.50 | -10.68% |
| ARWR | Arrowhead | | Health Care | 23.32 | 0 | -1.50 | -23.81% |
| VRRM | Verra Mobility | | Services & Goods | 23.72 | 0 | -1.50 | 3.00% |
| SYBT | Stock Yards | | Financials | 42.35 | 10 | -1.51 | -17.75% |
| AMK | AssetMark Financial | | Financials | 34.64 | 31 | -1.51 | 15.66% |
| AKYA | Akoya Biosciences | | Health Care | 3.92 | 0 | -1.51 | -19.84% |
| SHCR | Sharecare | | Health Care | 0.66 | 0 | -1.51 | -39.17% |
| MBWM | Mercantile Bank | | Financials | 33.62 | 0 | -1.52 | -16.74% |
| BECN | Beacon Roofing | | Industrials | 93.18 | 36 | -1.53 | 7.08% |
| CVI | CVR Energy | | Energy | 33.41 | 0 | -1.53 | 10.26% |
| FOXF | Fox Factory | | Consumer Staples | 41.19 | 20 | -1.53 | -38.96% |
| XHR | Xenia Hotels | | Financials | 14.12 | 31 | -1.53 | 3.67% |
| TCMD | Tactile Systems | | Health Care | 14.16 | 17 | -1.53 | -0.98% |
| RBBN | Ribbon | | Technology | 2.57 | 7 | -1.53 | -11.38% |
| ROAD | Construction Partners | | Industrials | 52.94 | 31 | -1.53 | 21.65% |
| KIND | Nextdoor | | Services & Goods | 1.93 | 41 | -1.53 | 4.32% |
| PLUS | ePlus | | Technology | 75.43 | 20 | -1.54 | -5.52% |
| IRBT | iRobot | | Consumer Staples | 7.03 | 10 | -1.54 | -81.83% |
| KGS | Kodiak Gas | | Energy | 26.14 | 43 | -1.54 | 30.83% |
| ATEN | A10 s | | Technology | 12.80 | 10 | -1.54 | -2.81% |
| XPER | Xperi | | Technology | 9.58 | 0 | -1.54 | -13.07% |
| PCT | PureCycle | | Industrials | 5.13 | 36 | -1.54 | 26.51% |
| DCOM | Dime Community | | Financials | 17.73 | 27 | -1.55 | -34.16% |


| Too many stocks? View smallcap stocks filtered by marketcap & sector |
| Marketcap: All SmallCap Stocks (default-no microcap), Large, Mid-Range, Small |
| Smallcap Sector: Tech, Finance, Energy, Staples, Retail, Industrial, Materials, & Medical |
|
Get the most comprehensive stock market coverage daily at 12Stocks.com ➞ Best Stocks Today ➞ Best Stocks Weekly ➞ Best Stocks Year-to-Date ➞ Best Stocks Trends ➞  Best Stocks Today 12Stocks.com Best Nasdaq Stocks ➞ Best S&P 500 Stocks ➞ Best Tech Stocks ➞ Best Biotech Stocks ➞ |
| Detailed Overview of SmallCap Stocks |
| SmallCap Technical Overview, Leaders & Laggards, Top SmallCap ETF Funds & Detailed SmallCap Stocks List, Charts, Trends & More |
| Smallcap: Technical Analysis, Trends & YTD Performance | |
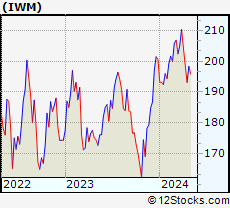
| SmallCap segment as represented by
IWM, an exchange-traded fund [ETF], holds basket of thousands of smallcap stocks from across all major sectors of the US stock market. The smallcap index (contains stocks like Riverbed & Sotheby's) is down by -3.84% and is currently underperforming the overall market by -8.25% year-to-date. Below is a quick view of technical charts and trends: | |
 IWM Weekly Chart |
|
| Long Term Trend: Good | |
| Medium Term Trend: Not Good | |
 IWM Daily Chart |
|
| Short Term Trend: Not Good | |
| Overall Trend Score: 13 | |
| YTD Performance: -3.84% | |
| **Trend Scores & Views Are Only For Educational Purposes And Not For Investing | |
| 12Stocks.com: Top Performing Small Cap Index Stocks | ||||||||||||||||||||||||||||||||||||||||||||||||
 The top performing Small Cap Index stocks year to date are
Now, more recently, over last week, the top performing Small Cap Index stocks on the move are


|
||||||||||||||||||||||||||||||||||||||||||||||||
| 12Stocks.com: Investing in Smallcap Index using Exchange Traded Funds | |
|
The following table shows list of key exchange traded funds (ETF) that
help investors track Smallcap index. The following list also includes leveraged ETF funds that track twice or thrice the daily returns of Smallcap indices. Short or inverse ETF funds move in the opposite direction to the index they track and are useful during market pullbacks or during bear markets. Quick View: Move mouse or cursor over ETF symbol (ticker) to view short-term technical chart and over ETF name to view long term chart. Click on ticker or stock name for detailed view. Click on to add stock symbol to your watchlist and to view watchlist. |
12Stocks.com List of ETFs that track Smallcap Index
| Ticker | ETF Name | Watchlist | Recent Price | Smart Investing & Trading Score | Change % | Week % | Year-to-date % |
| IWM | iShares Russell 2000 | | 193.00 | 13 | -1.06 | -2.86 | -3.84% |
| IJR | iShares Core S&P Small-Cap | | 102.13 | 17 | -0.58 | -2.28 | -5.65% |
| VTWO | Vanguard Russell 2000 ETF | | 78.05 | 36 | -1.04 | -2.83 | -3.76% |
| IWN | iShares Russell 2000 Value | | 146.03 | 23 | -0.77 | -2.89 | -5.99% |
| IWO | iShares Russell 2000 Growth | | 248.02 | 36 | -0.90 | -2.87 | -1.67% |
| IJS | iShares S&P Small-Cap 600 Value | | 94.12 | 17 | -0.57 | -2.13 | -8.68% |
| IJT | iShares S&P Small-Cap 600 Growth | | 121.84 | 41 | -1.02 | -2.36 | -2.64% |
| XSLV | PowerShares S&P SmallCap Low Volatil ETF | | 41.42 | 10 | -0.38 | -1.59 | -6.18% |
| SAA | ProShares Ultra SmallCap600 | | 21.66 | 0 | -1.19 | -3.99 | -13.19% |
| SMLV | SPDR SSGA US Small Cap Low Volatil ETF | | 103.66 | 10 | -0.17 | -1.29 | -7.87% |
| SBB | ProShares Short SmallCap600 | | 16.85 | 93 | 0.42 | 1.83 | 5.78% |
| SDD | ProShares UltraShort SmallCap600 | | 20.60 | 93 | 1.23 | 3.88 | 11.8% |
| 12Stocks.com: Charts, Trends, Fundamental Data and Performances of SmallCap Stocks | |
|
We now take in-depth look at all SmallCap stocks including charts, multi-period performances and overall trends (as measured by Smart Investing & Trading Score). One can sort SmallCap stocks (click link to choose) by Daily, Weekly and by Year-to-Date performances. Also, one can sort by size of the company or by market capitalization. |
| Select Your Default Chart Type: | |||||
| |||||
| Click on stock symbol or name for detailed view. Click on to add stock symbol to your watchlist and to view watchlist. Quick View: Move mouse or cursor over "Daily" to quickly view daily technical stock chart and over "Weekly" to view weekly technical stock chart. | |||||

 | CWK Cushman & Wakefield plc |
| Sector: Financials | |
| SubSector: Property Management | |
| MarketCap: 2651.62 Millions | |
| Recent Price: 9.27 Smart Investing & Trading Score: 10 | |
| Day Percent Change: -1.49% Day Change: -0.14 | |
| Week Change: -6.17% Year-to-date Change: -14.2% | |
| CWK Links: Profile News Message Board | |
| Charts:- Daily , Weekly | |
| Add CWK to Watchlist: View: Get Complete CWK Trend Analysis ➞ | |
 | SPT Sprout Social, Inc. |
| Sector: Technology | |
| SubSector: Software Application | |
| MarketCap: 25087 Millions | |
| Recent Price: 52.16 Smart Investing & Trading Score: 7 | |
| Day Percent Change: -1.49% Day Change: -0.79 | |
| Week Change: -7.3% Year-to-date Change: -15.1% | |
| SPT Links: Profile News Message Board | |
| Charts:- Daily , Weekly | |
| Add SPT to Watchlist: View: Get Complete SPT Trend Analysis ➞ | |
 | PBI Pitney Bowes Inc. |
| Sector: Consumer Staples | |
| SubSector: Business Equipment | |
| MarketCap: 408.067 Millions | |
| Recent Price: 3.93 Smart Investing & Trading Score: 0 | |
| Day Percent Change: -1.50% Day Change: -0.06 | |
| Week Change: -3.44% Year-to-date Change: -10.7% | |
| PBI Links: Profile News Message Board | |
| Charts:- Daily , Weekly | |
| Add PBI to Watchlist: View: Get Complete PBI Trend Analysis ➞ | |
 | ARWR Arrowhead Pharmaceuticals, Inc. |
| Sector: Health Care | |
| SubSector: Biotechnology | |
| MarketCap: 3226.15 Millions | |
| Recent Price: 23.32 Smart Investing & Trading Score: 0 | |
| Day Percent Change: -1.50% Day Change: -0.36 | |
| Week Change: -5.68% Year-to-date Change: -23.8% | |
| ARWR Links: Profile News Message Board | |
| Charts:- Daily , Weekly | |
| Add ARWR to Watchlist: View: Get Complete ARWR Trend Analysis ➞ | |
 | VRRM Verra Mobility Corporation |
| Sector: Services & Goods | |
| SubSector: Security & Protection Services | |
| MarketCap: 1265.03 Millions | |
| Recent Price: 23.72 Smart Investing & Trading Score: 0 | |
| Day Percent Change: -1.50% Day Change: -0.36 | |
| Week Change: -2.83% Year-to-date Change: 3.0% | |
| VRRM Links: Profile News Message Board | |
| Charts:- Daily , Weekly | |
| Add VRRM to Watchlist: View: Get Complete VRRM Trend Analysis ➞ | |
 | SYBT Stock Yards Bancorp, Inc. |
| Sector: Financials | |
| SubSector: Regional - Southeast Banks | |
| MarketCap: 629.235 Millions | |
| Recent Price: 42.35 Smart Investing & Trading Score: 10 | |
| Day Percent Change: -1.51% Day Change: -0.65 | |
| Week Change: -3.62% Year-to-date Change: -17.8% | |
| SYBT Links: Profile News Message Board | |
| Charts:- Daily , Weekly | |
| Add SYBT to Watchlist: View: Get Complete SYBT Trend Analysis ➞ | |
 | AMK AssetMark Financial Holdings, Inc. |
| Sector: Financials | |
| SubSector: Asset Management | |
| MarketCap: 1296.33 Millions | |
| Recent Price: 34.64 Smart Investing & Trading Score: 31 | |
| Day Percent Change: -1.51% Day Change: -0.53 | |
| Week Change: -4.1% Year-to-date Change: 15.7% | |
| AMK Links: Profile News Message Board | |
| Charts:- Daily , Weekly | |
| Add AMK to Watchlist: View: Get Complete AMK Trend Analysis ➞ | |
 | AKYA Akoya Biosciences, Inc. |
| Sector: Health Care | |
| SubSector: Medical Instruments & Supplies | |
| MarketCap: 340 Millions | |
| Recent Price: 3.92 Smart Investing & Trading Score: 0 | |
| Day Percent Change: -1.51% Day Change: -0.06 | |
| Week Change: -5.08% Year-to-date Change: -19.8% | |
| AKYA Links: Profile News Message Board | |
| Charts:- Daily , Weekly | |
| Add AKYA to Watchlist: View: Get Complete AKYA Trend Analysis ➞ | |
 | SHCR Sharecare, Inc. |
| Sector: Health Care | |
| SubSector: Health Information Services | |
| MarketCap: 640 Millions | |
| Recent Price: 0.66 Smart Investing & Trading Score: 0 | |
| Day Percent Change: -1.51% Day Change: -0.01 | |
| Week Change: -11.1% Year-to-date Change: -39.2% | |
| SHCR Links: Profile News Message Board | |
| Charts:- Daily , Weekly | |
| Add SHCR to Watchlist: View: Get Complete SHCR Trend Analysis ➞ | |
 | MBWM Mercantile Bank Corporation |
| Sector: Financials | |
| SubSector: Regional - Midwest Banks | |
| MarketCap: 372.77 Millions | |
| Recent Price: 33.62 Smart Investing & Trading Score: 0 | |
| Day Percent Change: -1.52% Day Change: -0.52 | |
| Week Change: -5.93% Year-to-date Change: -16.7% | |
| MBWM Links: Profile News Message Board | |
| Charts:- Daily , Weekly | |
| Add MBWM to Watchlist: View: Get Complete MBWM Trend Analysis ➞ | |
 | BECN Beacon Roofing Supply, Inc. |
| Sector: Industrials | |
| SubSector: General Building Materials | |
| MarketCap: 1210.13 Millions | |
| Recent Price: 93.18 Smart Investing & Trading Score: 36 | |
| Day Percent Change: -1.53% Day Change: -1.45 | |
| Week Change: -4.08% Year-to-date Change: 7.1% | |
| BECN Links: Profile News Message Board | |
| Charts:- Daily , Weekly | |
| Add BECN to Watchlist: View: Get Complete BECN Trend Analysis ➞ | |
 | CVI CVR Energy, Inc. |
| Sector: Energy | |
| SubSector: Oil & Gas Refining & Marketing | |
| MarketCap: 2482.14 Millions | |
| Recent Price: 33.41 Smart Investing & Trading Score: 0 | |
| Day Percent Change: -1.53% Day Change: -0.52 | |
| Week Change: -4.92% Year-to-date Change: 10.3% | |
| CVI Links: Profile News Message Board | |
| Charts:- Daily , Weekly | |
| Add CVI to Watchlist: View: Get Complete CVI Trend Analysis ➞ | |
 | FOXF Fox Factory Holding Corp. |
| Sector: Consumer Staples | |
| SubSector: Recreational Vehicles | |
| MarketCap: 2093.29 Millions | |
| Recent Price: 41.19 Smart Investing & Trading Score: 20 | |
| Day Percent Change: -1.53% Day Change: -0.64 | |
| Week Change: -3.54% Year-to-date Change: -39.0% | |
| FOXF Links: Profile News Message Board | |
| Charts:- Daily , Weekly | |
| Add FOXF to Watchlist: View: Get Complete FOXF Trend Analysis ➞ | |
 | XHR Xenia Hotels & Resorts, Inc. |
| Sector: Financials | |
| SubSector: REIT - Hotel/Motel | |
| MarketCap: 1058.24 Millions | |
| Recent Price: 14.12 Smart Investing & Trading Score: 31 | |
| Day Percent Change: -1.53% Day Change: -0.22 | |
| Week Change: -4.92% Year-to-date Change: 3.7% | |
| XHR Links: Profile News Message Board | |
| Charts:- Daily , Weekly | |
| Add XHR to Watchlist: View: Get Complete XHR Trend Analysis ➞ | |
 | TCMD Tactile Systems Technology, Inc. |
| Sector: Health Care | |
| SubSector: Medical Instruments & Supplies | |
| MarketCap: 655.96 Millions | |
| Recent Price: 14.16 Smart Investing & Trading Score: 17 | |
| Day Percent Change: -1.53% Day Change: -0.22 | |
| Week Change: -4.19% Year-to-date Change: -1.0% | |
| TCMD Links: Profile News Message Board | |
| Charts:- Daily , Weekly | |
| Add TCMD to Watchlist: View: Get Complete TCMD Trend Analysis ➞ | |
 | RBBN Ribbon Communications Inc. |
| Sector: Technology | |
| SubSector: Telecom Services - Domestic | |
| MarketCap: 284.577 Millions | |
| Recent Price: 2.57 Smart Investing & Trading Score: 7 | |
| Day Percent Change: -1.53% Day Change: -0.04 | |
| Week Change: -6.55% Year-to-date Change: -11.4% | |
| RBBN Links: Profile News Message Board | |
| Charts:- Daily , Weekly | |
| Add RBBN to Watchlist: View: Get Complete RBBN Trend Analysis ➞ | |
 | ROAD Construction Partners, Inc. |
| Sector: Industrials | |
| SubSector: Heavy Construction | |
| MarketCap: 903.095 Millions | |
| Recent Price: 52.94 Smart Investing & Trading Score: 31 | |
| Day Percent Change: -1.53% Day Change: -0.82 | |
| Week Change: -4.97% Year-to-date Change: 21.7% | |
| ROAD Links: Profile News Message Board | |
| Charts:- Daily , Weekly | |
| Add ROAD to Watchlist: View: Get Complete ROAD Trend Analysis ➞ | |
 | KIND Nextdoor Holdings, Inc. |
| Sector: Services & Goods | |
| SubSector: Internet Content & Information | |
| MarketCap: 1170 Millions | |
| Recent Price: 1.93 Smart Investing & Trading Score: 41 | |
| Day Percent Change: -1.53% Day Change: -0.03 | |
| Week Change: -5.39% Year-to-date Change: 4.3% | |
| KIND Links: Profile News Message Board | |
| Charts:- Daily , Weekly | |
| Add KIND to Watchlist: View: Get Complete KIND Trend Analysis ➞ | |
 | PLUS ePlus inc. |
| Sector: Technology | |
| SubSector: Application Software | |
| MarketCap: 728.262 Millions | |
| Recent Price: 75.43 Smart Investing & Trading Score: 20 | |
| Day Percent Change: -1.54% Day Change: -1.18 | |
| Week Change: -2.13% Year-to-date Change: -5.5% | |
| PLUS Links: Profile News Message Board | |
| Charts:- Daily , Weekly | |
| Add PLUS to Watchlist: View: Get Complete PLUS Trend Analysis ➞ | |
 | IRBT iRobot Corporation |
| Sector: Consumer Staples | |
| SubSector: Appliances | |
| MarketCap: 1193.38 Millions | |
| Recent Price: 7.03 Smart Investing & Trading Score: 10 | |
| Day Percent Change: -1.54% Day Change: -0.11 | |
| Week Change: -10.45% Year-to-date Change: -81.8% | |
| IRBT Links: Profile News Message Board | |
| Charts:- Daily , Weekly | |
| Add IRBT to Watchlist: View: Get Complete IRBT Trend Analysis ➞ | |
 | KGS Kodiak Gas Services, LLC |
| Sector: Energy | |
| SubSector: Oil & Gas Equipment & Services | |
| MarketCap: 1220 Millions | |
| Recent Price: 26.14 Smart Investing & Trading Score: 43 | |
| Day Percent Change: -1.54% Day Change: -0.41 | |
| Week Change: -2.93% Year-to-date Change: 30.8% | |
| KGS Links: Profile News Message Board | |
| Charts:- Daily , Weekly | |
| Add KGS to Watchlist: View: Get Complete KGS Trend Analysis ➞ | |
 | ATEN A10 Networks, Inc. |
| Sector: Technology | |
| SubSector: Communication Equipment | |
| MarketCap: 363.739 Millions | |
| Recent Price: 12.80 Smart Investing & Trading Score: 10 | |
| Day Percent Change: -1.54% Day Change: -0.20 | |
| Week Change: -2.29% Year-to-date Change: -2.8% | |
| ATEN Links: Profile News Message Board | |
| Charts:- Daily , Weekly | |
| Add ATEN to Watchlist: View: Get Complete ATEN Trend Analysis ➞ | |
 | XPER Xperi Corporation |
| Sector: Technology | |
| SubSector: Semiconductor Equipment & Materials | |
| MarketCap: 631.618 Millions | |
| Recent Price: 9.58 Smart Investing & Trading Score: 0 | |
| Day Percent Change: -1.54% Day Change: -0.15 | |
| Week Change: -6.35% Year-to-date Change: -13.1% | |
| XPER Links: Profile News Message Board | |
| Charts:- Daily , Weekly | |
| Add XPER to Watchlist: View: Get Complete XPER Trend Analysis ➞ | |
 | PCT PureCycle Technologies, Inc. |
| Sector: Industrials | |
| SubSector: Pollution & Treatment Controls | |
| MarketCap: 1610 Millions | |
| Recent Price: 5.13 Smart Investing & Trading Score: 36 | |
| Day Percent Change: -1.54% Day Change: -0.08 | |
| Week Change: -9.52% Year-to-date Change: 26.5% | |
| PCT Links: Profile News Message Board | |
| Charts:- Daily , Weekly | |
| Add PCT to Watchlist: View: Get Complete PCT Trend Analysis ➞ | |
 | DCOM Dime Community Bancshares, Inc. |
| Sector: Financials | |
| SubSector: Savings & Loans | |
| MarketCap: 477.83 Millions | |
| Recent Price: 17.73 Smart Investing & Trading Score: 27 | |
| Day Percent Change: -1.55% Day Change: -0.28 | |
| Week Change: -4.21% Year-to-date Change: -34.2% | |
| DCOM Links: Profile News Message Board | |
| Charts:- Daily , Weekly | |
| Add DCOM to Watchlist: View: Get Complete DCOM Trend Analysis ➞ | |
| Too many stocks? View smallcap stocks filtered by marketcap & sector |
| Marketcap: All SmallCap Stocks (default-no microcap), Large, Mid-Range, Small & MicroCap |
| Sector: Tech, Finance, Energy, Staples, Retail, Industrial, Materials, Utilities & Medical |
|
Best Stocks Today 12Stocks.com |
© 2024 12Stocks.com Terms & Conditions Privacy Contact Us
All Information Provided Only For Education And Not To Be Used For Investing or Trading. See Terms & Conditions


One More Thing ... Get Best Stocks Delivered Daily!
Never Ever Miss A Move With Our Top Ten Stocks Lists
Find Best Stocks In Any Market - Bull or Bear Market
Take A Peek At Our Top Ten Stocks Lists: Daily, Weekly, Year-to-Date & Top Trends
Find Best Stocks In Any Market - Bull or Bear Market
Take A Peek At Our Top Ten Stocks Lists: Daily, Weekly, Year-to-Date & Top Trends
Smallcap Stocks With Best Up Trends [0-bearish to 100-bullish]: Vanda [100], Zuora [100], ALX Oncology[100], ProKidney [100], IMAX [100], Envestnet [100], Intra-Cellular Therapies[100], Dorian LPG[95], Victory Capital[95], Oscar Health[95], Reneo [93]
Best Smallcap Stocks Year-to-Date:
Agenus [552.25%], CareMax [416.49%], Janux [346.07%], Viking [257.17%], Alpine Immune[238.55%], Super Micro[237.75%], Arcutis Bio[217.34%], Longboard [177.91%], Avidity Biosciences[160.56%], Vera [158.46%], Stoke [122.81%] Best Smallcap Stocks This Week:
ProKidney [61.71%], Macatawa Bank[42.75%], Snap One[29.85%], Vanda [27.18%], ALX Oncology[23.41%], Intra-Cellular Therapies[16.41%], Escalade [13.71%], Karyopharm [13.11%], Encore Wire[10.06%], Zuora [10%], Direxion Daily[8.81%] Best Smallcap Stocks Daily:
Vanda [29.38%], Karyopharm [25.45%], Cutera [18.41%], Children s[16.46%], WW [14.10%], Lineage Cell[12.17%], Zuora [11.69%], ALX Oncology[10.97%], Marinus [10.77%], Acrivon [9.19%], Cue Biopharma[9.03%]