
 Login Sign Up


| |||||
 |  | ||||

| 12Stocks.com Market Intelligence |
Best SmallCap Stocks
|
| In a hurry? Small Cap Stock Lists: Performance Trends Table, Stock Charts
Sort Small Cap stocks: Daily, Weekly, Year-to-Date, Market Cap & Trends. Filter Small Cap stocks list by sector: Show all, Tech, Finance, Energy, Staples, Retail, Industrial, Materials, Utilities and HealthCare Filter Small Cap stocks list by size: All Large Medium Small and MicroCap |
| 12Stocks.com Small Cap Stocks Performances & Trends Daily | |||||||||
|
|  The overall Smart Investing & Trading Score is 63 (0-bearish to 100-bullish) which puts Small Cap index in short term neutral to bullish trend. The Smart Investing & Trading Score from previous trading session is 58 and hence an improvement of trend.
| ||||||||
Here are the Smart Investing & Trading Scores of the most requested small cap stocks at 12Stocks.com (click stock name for detailed review):
|


| 12Stocks.com: Investing in Smallcap Index with Stocks | |
|
The following table helps investors and traders sort through current performance and trends (as measured by Smart Investing & Trading Score) of various
stocks in the Smallcap Index. Quick View: Move mouse or cursor over stock symbol (ticker) to view short-term technical chart and over stock name to view long term chart. Click on  to add stock symbol to your watchlist and to add stock symbol to your watchlist and  to view watchlist. Click on any ticker or stock name for detailed market intelligence report for that stock. to view watchlist. Click on any ticker or stock name for detailed market intelligence report for that stock. |
12Stocks.com Performance of Stocks in Smallcap Index
| Ticker | Stock Name | Watchlist | Category | Recent Price | Smart Investing & Trading Score | Change % | YTD Change% |
| CIFR | Cipher Mining |   | Financials | 4.80 | 95 | 5.26 | 16.79% |
| EGHT | 8x8 | | Technology | 2.31 | 54 | 5.23 | -38.76% |
| SASR | Sandy Spring | | Financials | 21.93 | 74 | 5.21 | -19.51% |
| PRAA | PRA Group | | Services & Goods | 24.90 | 75 | 5.20 | -4.96% |
| GLT | P. H. | | Consumer Staples | 1.62 | 68 | 5.19 | -16.49% |
| TREE | LendingTree | | Financials | 37.36 | 63 | 5.15 | 23.22% |
| EXPI | eXp World | | Financials | 10.55 | 37 | 5.13 | -32.06% |
| OM | Outset Medical | | Health Care | 2.46 | 49 | 5.13 | -54.53% |
| IAUX | i-80 Gold | | Materials | 1.23 | 30 | 5.13 | -29.71% |
| CCS | Century Communities | | Industrials | 83.80 | 39 | 5.10 | -8.05% |
| WVE | Wave Life | | Health Care | 5.09 | 58 | 5.06 | 0.69% |
| EGRX | Eagle | | Health Care | 4.78 | 47 | 5.05 | -8.60% |
| ENVA | Enova | | Financials | 64.32 | 93 | 5.05 | 16.18% |
| RCEL | Avita Medical | | Health Care | 8.98 | 17 | 5.03 | -34.55% |
| SGHT | Sight Sciences | | Health Care | 5.64 | 68 | 5.03 | 9.20% |
| CDNA | CareDx | | Services & Goods | 8.58 | 50 | 5.02 | -28.50% |
| ACET | Aceto | | Materials | 2.10 | 57 | 5.00 | 11.11% |
| BKD | Brookdale Senior | | Health Care | 6.93 | 100 | 5.00 | 19.07% |
| SKYT | SkyWater | | Technology | 9.06 | 17 | 4.98 | -6.02% |
| KTB | Kontoor Brands | | Consumer Staples | 60.23 | 44 | 4.97 | -3.51% |
| STEM | Stem | | Technology | 1.70 | 52 | 4.94 | -55.73% |
| QSI | Quantum-Si | | Health Care | 1.70 | 63 | 4.94 | -15.42% |
| PRCT | PROCEPT BioRobotics | | Health Care | 53.72 | 85 | 4.93 | 26.87% |
| ADMA | ADMA Biologics | | Health Care | 6.50 | 90 | 4.92 | 43.92% |
| PLAB | Photronics | | Technology | 26.94 | 42 | 4.91 | -14.12% |


| Too many stocks? View smallcap stocks filtered by marketcap & sector |
| Marketcap: All SmallCap Stocks (default-no microcap), Large, Mid-Range, Small |
| Smallcap Sector: Tech, Finance, Energy, Staples, Retail, Industrial, Materials, & Medical |
|
Get the most comprehensive stock market coverage daily at 12Stocks.com ➞ Best Stocks Today ➞ Best Stocks Weekly ➞ Best Stocks Year-to-Date ➞ Best Stocks Trends ➞  Best Stocks Today 12Stocks.com Best Nasdaq Stocks ➞ Best S&P 500 Stocks ➞ Best Tech Stocks ➞ Best Biotech Stocks ➞ |
| Detailed Overview of SmallCap Stocks |
| SmallCap Technical Overview, Leaders & Laggards, Top SmallCap ETF Funds & Detailed SmallCap Stocks List, Charts, Trends & More |
| Smallcap: Technical Analysis, Trends & YTD Performance | |
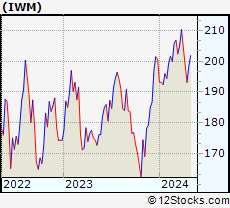
| SmallCap segment as represented by
IWM, an exchange-traded fund [ETF], holds basket of thousands of smallcap stocks from across all major sectors of the US stock market. The smallcap index (contains stocks like Riverbed & Sotheby's) is down by -1.07% and is currently underperforming the overall market by -6.71% year-to-date. Below is a quick view of technical charts and trends: | |
 IWM Weekly Chart |
|
| Long Term Trend: Good | |
| Medium Term Trend: Not Good | |
 IWM Daily Chart |
|
| Short Term Trend: Very Good | |
| Overall Trend Score: 63 | |
| YTD Performance: -1.07% | |
| **Trend Scores & Views Are Only For Educational Purposes And Not For Investing | |
| 12Stocks.com: Top Performing Small Cap Index Stocks | ||||||||||||||||||||||||||||||||||||||||||||||||
 The top performing Small Cap Index stocks year to date are
Now, more recently, over last week, the top performing Small Cap Index stocks on the move are


|
||||||||||||||||||||||||||||||||||||||||||||||||
| 12Stocks.com: Investing in Smallcap Index using Exchange Traded Funds | |
|
The following table shows list of key exchange traded funds (ETF) that
help investors track Smallcap index. The following list also includes leveraged ETF funds that track twice or thrice the daily returns of Smallcap indices. Short or inverse ETF funds move in the opposite direction to the index they track and are useful during market pullbacks or during bear markets. Quick View: Move mouse or cursor over ETF symbol (ticker) to view short-term technical chart and over ETF name to view long term chart. Click on ticker or stock name for detailed view. Click on to add stock symbol to your watchlist and to view watchlist. |
12Stocks.com List of ETFs that track Smallcap Index
| Ticker | ETF Name | Watchlist | Recent Price | Smart Investing & Trading Score | Change % | Week % | Year-to-date % |
| IWM | iShares Russell 2000 | | 198.57 | 63 | 1.67 | 2.81 | -1.07% |
| VTWO | Vanguard Russell 2000 ETF | | 80.53 | 70 | 2.04 | 3.14 | -0.7% |
| IJR | iShares Core S&P Small-Cap | | 105.44 | 75 | 1.91 | 2.16 | -2.59% |
| IJS | iShares S&P Small-Cap 600 Value | | 98.50 | 67 | 2.15 | 3.02 | -4.43% |
| IWN | iShares Russell 2000 Value | | 151.50 | 68 | 1.33 | 2.52 | -2.47% |
| IJT | iShares S&P Small-Cap 600 Growth | | 125.91 | 70 | 2.07 | 3.03 | 0.62% |
| IWO | iShares Russell 2000 Growth | | 252.16 | 58 | 1.71 | 2.8 | -0.02% |
| XSLV | PowerShares S&P SmallCap Low Volatil ETF | | 43.09 | 80 | 1.53 | 2.16 | -2.4% |
| SMLV | SPDR SSGA US Small Cap Low Volatil ETF | | 108.46 | 72 | 0.91 | 2.23 | -3.61% |
| SAA | ProShares Ultra SmallCap600 | | 23.15 | 24 | 3.49 | 6.19 | -7.21% |
| SBB | ProShares Short SmallCap600 | | 16.28 | 40 | -2.05 | -3.33 | 2.2% |
| SDD | ProShares UltraShort SmallCap600 | | 19.31 | 40 | -2.23 | -5.06 | 4.79% |
| 12Stocks.com: Charts, Trends, Fundamental Data and Performances of SmallCap Stocks | |
|
We now take in-depth look at all SmallCap stocks including charts, multi-period performances and overall trends (as measured by Smart Investing & Trading Score). One can sort SmallCap stocks (click link to choose) by Daily, Weekly and by Year-to-Date performances. Also, one can sort by size of the company or by market capitalization. |
| Select Your Default Chart Type: | |||||
| |||||
| Click on stock symbol or name for detailed view. Click on to add stock symbol to your watchlist and to view watchlist. Quick View: Move mouse or cursor over "Daily" to quickly view daily technical stock chart and over "Weekly" to view weekly technical stock chart. | |||||

 | CIFR Cipher Mining Inc. |
| Sector: Financials | |
| SubSector: Capital Markets | |
| MarketCap: 712 Millions | |
| Recent Price: 4.80 Smart Investing & Trading Score: 95 | |
| Day Percent Change: 5.26% Day Change: 0.24 | |
| Week Change: 25% Year-to-date Change: 16.8% | |
| CIFR Links: Profile News Message Board | |
| Charts:- Daily , Weekly | |
| Add CIFR to Watchlist: View: Get Complete CIFR Trend Analysis ➞ | |
 | EGHT 8x8, Inc. |
| Sector: Technology | |
| SubSector: Diversified Communication Services | |
| MarketCap: 1861.64 Millions | |
| Recent Price: 2.31 Smart Investing & Trading Score: 54 | |
| Day Percent Change: 5.23% Day Change: 0.11 | |
| Week Change: 6.19% Year-to-date Change: -38.8% | |
| EGHT Links: Profile News Message Board | |
| Charts:- Daily , Weekly | |
| Add EGHT to Watchlist: View: Get Complete EGHT Trend Analysis ➞ | |
 | SASR Sandy Spring Bancorp, Inc. |
| Sector: Financials | |
| SubSector: Regional - Mid-Atlantic Banks | |
| MarketCap: 764.659 Millions | |
| Recent Price: 21.93 Smart Investing & Trading Score: 74 | |
| Day Percent Change: 5.21% Day Change: 1.09 | |
| Week Change: 5.61% Year-to-date Change: -19.5% | |
| SASR Links: Profile News Message Board | |
| Charts:- Daily , Weekly | |
| Add SASR to Watchlist: View: Get Complete SASR Trend Analysis ➞ | |
 | PRAA PRA Group, Inc. |
| Sector: Services & Goods | |
| SubSector: Business Services | |
| MarketCap: 1290.32 Millions | |
| Recent Price: 24.90 Smart Investing & Trading Score: 75 | |
| Day Percent Change: 5.20% Day Change: 1.23 | |
| Week Change: 2.17% Year-to-date Change: -5.0% | |
| PRAA Links: Profile News Message Board | |
| Charts:- Daily , Weekly | |
| Add PRAA to Watchlist: View: Get Complete PRAA Trend Analysis ➞ | |
 | GLT P. H. Glatfelter Company |
| Sector: Consumer Staples | |
| SubSector: Paper & Paper Products | |
| MarketCap: 525.003 Millions | |
| Recent Price: 1.62 Smart Investing & Trading Score: 68 | |
| Day Percent Change: 5.19% Day Change: 0.08 | |
| Week Change: 4.52% Year-to-date Change: -16.5% | |
| GLT Links: Profile News Message Board | |
| Charts:- Daily , Weekly | |
| Add GLT to Watchlist: View: Get Complete GLT Trend Analysis ➞ | |
 | TREE LendingTree, Inc. |
| Sector: Financials | |
| SubSector: Mortgage Investment | |
| MarketCap: 2745.99 Millions | |
| Recent Price: 37.36 Smart Investing & Trading Score: 63 | |
| Day Percent Change: 5.15% Day Change: 1.83 | |
| Week Change: 9.46% Year-to-date Change: 23.2% | |
| TREE Links: Profile News Message Board | |
| Charts:- Daily , Weekly | |
| Add TREE to Watchlist: View: Get Complete TREE Trend Analysis ➞ | |
 | EXPI eXp World Holdings, Inc. |
| Sector: Financials | |
| SubSector: Property Management | |
| MarketCap: 448.042 Millions | |
| Recent Price: 10.55 Smart Investing & Trading Score: 37 | |
| Day Percent Change: 5.13% Day Change: 0.52 | |
| Week Change: 6.95% Year-to-date Change: -32.1% | |
| EXPI Links: Profile News Message Board | |
| Charts:- Daily , Weekly | |
| Add EXPI to Watchlist: View: Get Complete EXPI Trend Analysis ➞ | |
 | OM Outset Medical, Inc. |
| Sector: Health Care | |
| SubSector: Medical Devices | |
| MarketCap: 21787 Millions | |
| Recent Price: 2.46 Smart Investing & Trading Score: 49 | |
| Day Percent Change: 5.13% Day Change: 0.12 | |
| Week Change: 7.66% Year-to-date Change: -54.5% | |
| OM Links: Profile News Message Board | |
| Charts:- Daily , Weekly | |
| Add OM to Watchlist: View: Get Complete OM Trend Analysis ➞ | |
 | IAUX i-80 Gold Corp. |
| Sector: Materials | |
| SubSector: Gold | |
| MarketCap: 616 Millions | |
| Recent Price: 1.23 Smart Investing & Trading Score: 30 | |
| Day Percent Change: 5.13% Day Change: 0.06 | |
| Week Change: -3.15% Year-to-date Change: -29.7% | |
| IAUX Links: Profile News Message Board | |
| Charts:- Daily , Weekly | |
| Add IAUX to Watchlist: View: Get Complete IAUX Trend Analysis ➞ | |
 | CCS Century Communities, Inc. |
| Sector: Industrials | |
| SubSector: Residential Construction | |
| MarketCap: 459.206 Millions | |
| Recent Price: 83.80 Smart Investing & Trading Score: 39 | |
| Day Percent Change: 5.10% Day Change: 4.07 | |
| Week Change: 6.04% Year-to-date Change: -8.1% | |
| CCS Links: Profile News Message Board | |
| Charts:- Daily , Weekly | |
| Add CCS to Watchlist: View: Get Complete CCS Trend Analysis ➞ | |
 | WVE Wave Life Sciences Ltd. |
| Sector: Health Care | |
| SubSector: Biotechnology | |
| MarketCap: 452.785 Millions | |
| Recent Price: 5.09 Smart Investing & Trading Score: 58 | |
| Day Percent Change: 5.06% Day Change: 0.25 | |
| Week Change: 4.41% Year-to-date Change: 0.7% | |
| WVE Links: Profile News Message Board | |
| Charts:- Daily , Weekly | |
| Add WVE to Watchlist: View: Get Complete WVE Trend Analysis ➞ | |
 | EGRX Eagle Pharmaceuticals, Inc. |
| Sector: Health Care | |
| SubSector: Drugs - Generic | |
| MarketCap: 573.385 Millions | |
| Recent Price: 4.78 Smart Investing & Trading Score: 47 | |
| Day Percent Change: 5.05% Day Change: 0.23 | |
| Week Change: 3.69% Year-to-date Change: -8.6% | |
| EGRX Links: Profile News Message Board | |
| Charts:- Daily , Weekly | |
| Add EGRX to Watchlist: View: Get Complete EGRX Trend Analysis ➞ | |
 | ENVA Enova International, Inc. |
| Sector: Financials | |
| SubSector: Credit Services | |
| MarketCap: 345.508 Millions | |
| Recent Price: 64.32 Smart Investing & Trading Score: 93 | |
| Day Percent Change: 5.05% Day Change: 3.09 | |
| Week Change: 5.95% Year-to-date Change: 16.2% | |
| ENVA Links: Profile News Message Board | |
| Charts:- Daily , Weekly | |
| Add ENVA to Watchlist: View: Get Complete ENVA Trend Analysis ➞ | |
 | RCEL Avita Medical Limited |
| Sector: Health Care | |
| SubSector: Medical Appliances & Equipment | |
| MarketCap: 481.18 Millions | |
| Recent Price: 8.98 Smart Investing & Trading Score: 17 | |
| Day Percent Change: 5.03% Day Change: 0.43 | |
| Week Change: 3.94% Year-to-date Change: -34.6% | |
| RCEL Links: Profile News Message Board | |
| Charts:- Daily , Weekly | |
| Add RCEL to Watchlist: View: Get Complete RCEL Trend Analysis ➞ | |
 | SGHT Sight Sciences, Inc. |
| Sector: Health Care | |
| SubSector: Medical Devices | |
| MarketCap: 381 Millions | |
| Recent Price: 5.64 Smart Investing & Trading Score: 68 | |
| Day Percent Change: 5.03% Day Change: 0.27 | |
| Week Change: 9.94% Year-to-date Change: 9.2% | |
| SGHT Links: Profile News Message Board | |
| Charts:- Daily , Weekly | |
| Add SGHT to Watchlist: View: Get Complete SGHT Trend Analysis ➞ | |
 | CDNA CareDx, Inc |
| Sector: Services & Goods | |
| SubSector: Research Services | |
| MarketCap: 828.194 Millions | |
| Recent Price: 8.58 Smart Investing & Trading Score: 50 | |
| Day Percent Change: 5.02% Day Change: 0.41 | |
| Week Change: 3.25% Year-to-date Change: -28.5% | |
| CDNA Links: Profile News Message Board | |
| Charts:- Daily , Weekly | |
| Add CDNA to Watchlist: View: Get Complete CDNA Trend Analysis ➞ | |
 | ACET Aceto Corporation |
| Sector: Materials | |
| SubSector: Chemicals - Major Diversified | |
| MarketCap: 453.16 Millions | |
| Recent Price: 2.10 Smart Investing & Trading Score: 57 | |
| Day Percent Change: 5.00% Day Change: 0.10 | |
| Week Change: 7.69% Year-to-date Change: 11.1% | |
| ACET Links: Profile News Message Board | |
| Charts:- Daily , Weekly | |
| Add ACET to Watchlist: View: Get Complete ACET Trend Analysis ➞ | |
 | BKD Brookdale Senior Living Inc. |
| Sector: Health Care | |
| SubSector: Long-Term Care Facilities | |
| MarketCap: 420.686 Millions | |
| Recent Price: 6.93 Smart Investing & Trading Score: 100 | |
| Day Percent Change: 5.00% Day Change: 0.33 | |
| Week Change: 6.94% Year-to-date Change: 19.1% | |
| BKD Links: Profile News Message Board | |
| Charts:- Daily , Weekly | |
| Add BKD to Watchlist: View: Get Complete BKD Trend Analysis ➞ | |
 | SKYT SkyWater Technology, Inc. |
| Sector: Technology | |
| SubSector: Semiconductors | |
| MarketCap: 394 Millions | |
| Recent Price: 9.06 Smart Investing & Trading Score: 17 | |
| Day Percent Change: 4.98% Day Change: 0.43 | |
| Week Change: 7.99% Year-to-date Change: -6.0% | |
| SKYT Links: Profile News Message Board | |
| Charts:- Daily , Weekly | |
| Add SKYT to Watchlist: View: Get Complete SKYT Trend Analysis ➞ | |
 | KTB Kontoor Brands, Inc. |
| Sector: Consumer Staples | |
| SubSector: Textile - Apparel Clothing | |
| MarketCap: 1668.65 Millions | |
| Recent Price: 60.23 Smart Investing & Trading Score: 44 | |
| Day Percent Change: 4.97% Day Change: 2.85 | |
| Week Change: 6.7% Year-to-date Change: -3.5% | |
| KTB Links: Profile News Message Board | |
| Charts:- Daily , Weekly | |
| Add KTB to Watchlist: View: Get Complete KTB Trend Analysis ➞ | |
 | STEM Stem, Inc. |
| Sector: Technology | |
| SubSector: Software - Infrastructure | |
| MarketCap: 836 Millions | |
| Recent Price: 1.70 Smart Investing & Trading Score: 52 | |
| Day Percent Change: 4.94% Day Change: 0.08 | |
| Week Change: 9.68% Year-to-date Change: -55.7% | |
| STEM Links: Profile News Message Board | |
| Charts:- Daily , Weekly | |
| Add STEM to Watchlist: View: Get Complete STEM Trend Analysis ➞ | |
 | QSI Quantum-Si incorporated |
| Sector: Health Care | |
| SubSector: Biotechnology | |
| MarketCap: 256 Millions | |
| Recent Price: 1.70 Smart Investing & Trading Score: 63 | |
| Day Percent Change: 4.94% Day Change: 0.08 | |
| Week Change: 8.28% Year-to-date Change: -15.4% | |
| QSI Links: Profile News Message Board | |
| Charts:- Daily , Weekly | |
| Add QSI to Watchlist: View: Get Complete QSI Trend Analysis ➞ | |
 | PRCT PROCEPT BioRobotics Corporation |
| Sector: Health Care | |
| SubSector: Medical Devices | |
| MarketCap: 1600 Millions | |
| Recent Price: 53.72 Smart Investing & Trading Score: 85 | |
| Day Percent Change: 4.93% Day Change: 2.53 | |
| Week Change: 7.02% Year-to-date Change: 26.9% | |
| PRCT Links: Profile News Message Board | |
| Charts:- Daily , Weekly | |
| Add PRCT to Watchlist: View: Get Complete PRCT Trend Analysis ➞ | |
 | ADMA ADMA Biologics, Inc. |
| Sector: Health Care | |
| SubSector: Biotechnology | |
| MarketCap: 204.985 Millions | |
| Recent Price: 6.50 Smart Investing & Trading Score: 90 | |
| Day Percent Change: 4.92% Day Change: 0.30 | |
| Week Change: 3.75% Year-to-date Change: 43.9% | |
| ADMA Links: Profile News Message Board | |
| Charts:- Daily , Weekly | |
| Add ADMA to Watchlist: View: Get Complete ADMA Trend Analysis ➞ | |
 | PLAB Photronics, Inc. |
| Sector: Technology | |
| SubSector: Semiconductor Equipment & Materials | |
| MarketCap: 709.018 Millions | |
| Recent Price: 26.94 Smart Investing & Trading Score: 42 | |
| Day Percent Change: 4.91% Day Change: 1.26 | |
| Week Change: 6.4% Year-to-date Change: -14.1% | |
| PLAB Links: Profile News Message Board | |
| Charts:- Daily , Weekly | |
| Add PLAB to Watchlist: View: Get Complete PLAB Trend Analysis ➞ | |
| Too many stocks? View smallcap stocks filtered by marketcap & sector |
| Marketcap: All SmallCap Stocks (default-no microcap), Large, Mid-Range, Small & MicroCap |
| Sector: Tech, Finance, Energy, Staples, Retail, Industrial, Materials, Utilities & Medical |
|
Best Stocks Today 12Stocks.com |
© 2024 12Stocks.com Terms & Conditions Privacy Contact Us
All Information Provided Only For Education And Not To Be Used For Investing or Trading. See Terms & Conditions


One More Thing ... Get Best Stocks Delivered Daily!
Never Ever Miss A Move With Our Top Ten Stocks Lists
Find Best Stocks In Any Market - Bull or Bear Market
Take A Peek At Our Top Ten Stocks Lists: Daily, Weekly, Year-to-Date & Top Trends
Find Best Stocks In Any Market - Bull or Bear Market
Take A Peek At Our Top Ten Stocks Lists: Daily, Weekly, Year-to-Date & Top Trends
Smallcap Stocks With Best Up Trends [0-bearish to 100-bullish]: Hibbett Sports[100], AZZ [100], Day One[100], BioLife Solutions[100], Oscar Health[100], Mueller Industries[100], Gannett Co[100], Dillard s[100], Riot Blockchain[100], Agios [100], Brookdale Senior[100]
Best Smallcap Stocks Year-to-Date:
Janux [364.03%], Viking [258.89%], Alpine Immune[238.94%], Longboard [231.75%], Avidity Biosciences[177.88%], Arcutis Bio[170.43%], Super Micro[168.16%], Vera [154.91%], Hippo [134.14%], Y-mAbs [125.37%], Stoke [113.69%] Best Smallcap Stocks This Week:
Matterport [164.37%], Seres [36.26%], Riot Blockchain[29.74%], Cipher Mining[25%], ProKidney [24.75%], Braemar Hotels[21.3%], Akoustis [21.27%], Hibbett Sports[21.1%], Assertio [19.02%], Generation Bio[18.05%], BigBear.ai [17.93%] Best Smallcap Stocks Daily:
Virgin Galactic[22.38%], Seres [22.14%], Hibbett Sports[18.84%], Marathon Patent[18.12%], Generation Bio[16.37%], IGM Biosciences[14.52%], Braemar Hotels[12.96%], SES AI[12.17%], NuScale Power[11.16%], FuelCell Energy[10.86%], Cutera [10.82%]