
 Login Sign Up


| |||||
 |  | ||||

| 12Stocks.com Market Intelligence |
Best SmallCap Stocks
|
| In a hurry? Small Cap Stock Lists: Performance Trends Table, Stock Charts
Sort Small Cap stocks: Daily, Weekly, Year-to-Date, Market Cap & Trends. Filter Small Cap stocks list by sector: Show all, Tech, Finance, Energy, Staples, Retail, Industrial, Materials, Utilities and HealthCare Filter Small Cap stocks list by size: All Large Medium Small and MicroCap |
| 12Stocks.com Small Cap Stocks Performances & Trends Daily | |||||||||
|
|  The overall Smart Investing & Trading Score is 63 (0-bearish to 100-bullish) which puts Small Cap index in short term neutral to bullish trend. The Smart Investing & Trading Score from previous trading session is 58 and hence an improvement of trend.
| ||||||||
Here are the Smart Investing & Trading Scores of the most requested small cap stocks at 12Stocks.com (click stock name for detailed review):
|


| 12Stocks.com: Investing in Smallcap Index with Stocks | |
|
The following table helps investors and traders sort through current performance and trends (as measured by Smart Investing & Trading Score) of various
stocks in the Smallcap Index. Quick View: Move mouse or cursor over stock symbol (ticker) to view short-term technical chart and over stock name to view long term chart. Click on  to add stock symbol to your watchlist and to add stock symbol to your watchlist and  to view watchlist. Click on any ticker or stock name for detailed market intelligence report for that stock. to view watchlist. Click on any ticker or stock name for detailed market intelligence report for that stock. |
12Stocks.com Performance of Stocks in Smallcap Index
| Ticker | Stock Name | Watchlist | Category | Recent Price | Smart Investing & Trading Score | Change % | YTD Change% |
| MCS | Marcus |   | Services & Goods | 13.55 | 62 | 1.65% | -7.06% |
| EAT | Brinker | | Services & Goods | 48.00 | 100 | 3.87% | 11.16% |
| HSII | Heidrick & Struggles | | Services & Goods | 30.77 | 70 | 0.29% | 4.20% |
| DIN | Dine Brands | | Services & Goods | 45.15 | 74 | 2.10% | -9.06% |
| OMI | Owens & Minor | | Services & Goods | 25.57 | 68 | 5.53% | 32.69% |
| RSVR | Reservoir Media | | Services & Goods | 8.26 | 100 | 0.06% | 15.94% |
| GAMB | Gambling.com Group | | Services & Goods | 8.88 | 49 | 0.68% | -9.02% |
| DENN | Denny s | | Services & Goods | 8.35 | 42 | 1.83% | -23.25% |
| BOOT | Boot Barn | | Services & Goods | 106.71 | 100 | 3.42% | 39.02% |
| KRT | Karat Packaging | | Services & Goods | 27.19 | 51 | 3.23% | 9.15% |
| MCRI | Monarch Casino | | Services & Goods | 69.45 | 68 | 1.67% | 0.43% |
| CCRN | Cross Country | | Services & Goods | 17.77 | 67 | 4.41% | -21.51% |
| NSSC | Napco Security | | Services & Goods | 43.32 | 100 | 4.61% | 26.48% |
| CRMT | America s | | Services & Goods | 58.72 | 57 | 3.29% | -22.50% |
| IMXI | Money | | Services & Goods | 21.89 | 68 | 1.58% | -0.91% |
| CCO | Clear Channel | | Services & Goods | 1.50 | 42 | 2.04% | -17.58% |
| DJCO | Daily Journal | | Services & Goods | 356.90 | 75 | 1.97% | 4.72% |
| CATO | Cato | | Services & Goods | 5.01 | 42 | -1.76% | -29.83% |
| CSV | Carriage Services | | Services & Goods | 25.18 | 93 | 1.00% | 0.68% |
| PLCE | Children s | | Services & Goods | 7.16 | 10 | -5.04% | -69.16% |
| LOCO | El Pollo | | Services & Goods | 8.46 | 32 | 2.42% | -4.08% |
| CARS | Cars.com | | Services & Goods | 16.70 | 49 | 0.85% | -11.97% |
| PLAY | Dave & Buster s Entertainment | | Services & Goods | 56.13 | 63 | 2.84% | 4.23% |
| CURV | Torrid | | Services & Goods | 5.02 | 69 | 3.29% | -14.19% |
| EVRI | Everi | | Services & Goods | 8.70 | 10 | -2.68% | -22.80% |
| For chart view version of above stock list: Chart View ➞ 0 - 25 , 25 - 50 , 50 - 75 , 75 - 100 , 100 - 125 , 125 - 150 , 150 - 175 , 175 - 200 , 200 - 225 | ||
 | Click To Change The Sort Order: By Market Cap or Company Size Performance: Year-to-date, Week and Day |  |
| Too many stocks? View smallcap stocks filtered by marketcap & sector |
| Marketcap: All SmallCap Stocks (default-no microcap), Large, Mid-Range, Small |
| Smallcap Sector: Tech, Finance, Energy, Staples, Retail, Industrial, Materials, & Medical |
|
Get the most comprehensive stock market coverage daily at 12Stocks.com ➞ Best Stocks Today ➞ Best Stocks Weekly ➞ Best Stocks Year-to-Date ➞ Best Stocks Trends ➞  Best Stocks Today 12Stocks.com Best Nasdaq Stocks ➞ Best S&P 500 Stocks ➞ Best Tech Stocks ➞ Best Biotech Stocks ➞ |
| Detailed Overview of SmallCap Stocks |
| SmallCap Technical Overview, Leaders & Laggards, Top SmallCap ETF Funds & Detailed SmallCap Stocks List, Charts, Trends & More |
| Smallcap: Technical Analysis, Trends & YTD Performance | |
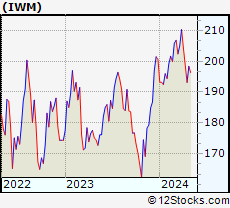
| SmallCap segment as represented by
IWM, an exchange-traded fund [ETF], holds basket of thousands of smallcap stocks from across all major sectors of the US stock market. The smallcap index (contains stocks like Riverbed & Sotheby's) is down by -1.07% and is currently underperforming the overall market by -6.71% year-to-date. Below is a quick view of technical charts and trends: | |
 IWM Weekly Chart |
|
| Long Term Trend: Good | |
| Medium Term Trend: Not Good | |
 IWM Daily Chart |
|
| Short Term Trend: Very Good | |
| Overall Trend Score: 63 | |
| YTD Performance: -1.07% | |
| **Trend Scores & Views Are Only For Educational Purposes And Not For Investing | |
| 12Stocks.com: Top Performing Small Cap Index Stocks | ||||||||||||||||||||||||||||||||||||||||||||||||
 The top performing Small Cap Index stocks year to date are
Now, more recently, over last week, the top performing Small Cap Index stocks on the move are


|
||||||||||||||||||||||||||||||||||||||||||||||||
| 12Stocks.com: Investing in Smallcap Index using Exchange Traded Funds | |
|
The following table shows list of key exchange traded funds (ETF) that
help investors track Smallcap index. The following list also includes leveraged ETF funds that track twice or thrice the daily returns of Smallcap indices. Short or inverse ETF funds move in the opposite direction to the index they track and are useful during market pullbacks or during bear markets. Quick View: Move mouse or cursor over ETF symbol (ticker) to view short-term technical chart and over ETF name to view long term chart. Click on ticker or stock name for detailed view. Click on to add stock symbol to your watchlist and to view watchlist. |
12Stocks.com List of ETFs that track Smallcap Index
| Ticker | ETF Name | Watchlist | Recent Price | Smart Investing & Trading Score | Change % | Week % | Year-to-date % |
| IWM | iShares Russell 2000 | | 198.57 | 63 | 1.67 | 2.81 | -1.07% |
| IJR | iShares Core S&P Small-Cap | | 105.96 | 85 | 2.41 | 2.65 | -2.12% |
| VTWO | Vanguard Russell 2000 ETF | | 80.29 | 70 | 1.74 | 2.83 | -1% |
| IWN | iShares Russell 2000 Value | | 151.74 | 75 | 1.49 | 2.68 | -2.31% |
| IJS | iShares S&P Small-Cap 600 Value | | 98.13 | 67 | 1.76 | 2.64 | -4.79% |
| IWO | iShares Russell 2000 Growth | | 252.37 | 58 | 1.79 | 2.89 | 0.06% |
| IJT | iShares S&P Small-Cap 600 Growth | | 125.72 | 70 | 1.91 | 2.87 | 0.46% |
| XSLV | PowerShares S&P SmallCap Low Volatil ETF | | 43.05 | 80 | 1.44 | 2.06 | -2.49% |
| SMLV | SPDR SSGA US Small Cap Low Volatil ETF | | 108.77 | 93 | 1.20 | 2.52 | -3.34% |
| SAA | ProShares Ultra SmallCap600 | | 23.15 | 80 | 3.49 | 6.19 | -7.21% |
| SBB | ProShares Short SmallCap600 | | 16.37 | 20 | -1.48 | -2.77 | 2.79% |
| SDD | ProShares UltraShort SmallCap600 | | 19.23 | 30 | -2.63 | -5.46 | 4.36% |
| 12Stocks.com: Charts, Trends, Fundamental Data and Performances of SmallCap Stocks | |
|
We now take in-depth look at all SmallCap stocks including charts, multi-period performances and overall trends (as measured by Smart Investing & Trading Score). One can sort SmallCap stocks (click link to choose) by Daily, Weekly and by Year-to-Date performances. Also, one can sort by size of the company or by market capitalization. |
| Select Your Default Chart Type: | |||||
| |||||
| Click on stock symbol or name for detailed view. Click on to add stock symbol to your watchlist and to view watchlist. Quick View: Move mouse or cursor over "Daily" to quickly view daily technical stock chart and over "Weekly" to view weekly technical stock chart. | |||||

 | MCS The Marcus Corporation |
| Sector: Services & Goods | |
| SubSector: Entertainment - Diversified | |
| MarketCap: 441.437 Millions | |
| Recent Price: 13.55 Smart Investing & Trading Score: 62 | |
| Day Percent Change: 1.65% Day Change: 0.22 | |
| Week Change: 2.57% Year-to-date Change: -7.1% | |
| MCS Links: Profile News Message Board | |
| Charts:- Daily , Weekly | |
| Add MCS to Watchlist: View: Get Complete MCS Trend Analysis ➞ | |
 | EAT Brinker International, Inc. |
| Sector: Services & Goods | |
| SubSector: Restaurants | |
| MarketCap: 435.97 Millions | |
| Recent Price: 48.00 Smart Investing & Trading Score: 100 | |
| Day Percent Change: 3.87% Day Change: 1.79 | |
| Week Change: 6.12% Year-to-date Change: 11.2% | |
| EAT Links: Profile News Message Board | |
| Charts:- Daily , Weekly | |
| Add EAT to Watchlist: View: Get Complete EAT Trend Analysis ➞ | |
 | HSII Heidrick & Struggles International, Inc. |
| Sector: Services & Goods | |
| SubSector: Staffing & Outsourcing Services | |
| MarketCap: 431.428 Millions | |
| Recent Price: 30.77 Smart Investing & Trading Score: 70 | |
| Day Percent Change: 0.29% Day Change: 0.09 | |
| Week Change: 0.89% Year-to-date Change: 4.2% | |
| HSII Links: Profile News Message Board | |
| Charts:- Daily , Weekly | |
| Add HSII to Watchlist: View: Get Complete HSII Trend Analysis ➞ | |
 | DIN Dine Brands Global, Inc. |
| Sector: Services & Goods | |
| SubSector: Restaurants | |
| MarketCap: 421.17 Millions | |
| Recent Price: 45.15 Smart Investing & Trading Score: 74 | |
| Day Percent Change: 2.10% Day Change: 0.93 | |
| Week Change: 4.15% Year-to-date Change: -9.1% | |
| DIN Links: Profile News Message Board | |
| Charts:- Daily , Weekly | |
| Add DIN to Watchlist: View: Get Complete DIN Trend Analysis ➞ | |
 | OMI Owens & Minor, Inc. |
| Sector: Services & Goods | |
| SubSector: Medical Equipment Wholesale | |
| MarketCap: 403.92 Millions | |
| Recent Price: 25.57 Smart Investing & Trading Score: 68 | |
| Day Percent Change: 5.53% Day Change: 1.34 | |
| Week Change: 3.15% Year-to-date Change: 32.7% | |
| OMI Links: Profile News Message Board | |
| Charts:- Daily , Weekly | |
| Add OMI to Watchlist: View: Get Complete OMI Trend Analysis ➞ | |
 | RSVR Reservoir Media, Inc. |
| Sector: Services & Goods | |
| SubSector: Entertainment | |
| MarketCap: 389 Millions | |
| Recent Price: 8.26 Smart Investing & Trading Score: 100 | |
| Day Percent Change: 0.06% Day Change: 0.01 | |
| Week Change: 3.19% Year-to-date Change: 15.9% | |
| RSVR Links: Profile News Message Board | |
| Charts:- Daily , Weekly | |
| Add RSVR to Watchlist: View: Get Complete RSVR Trend Analysis ➞ | |
 | GAMB Gambling.com Group Limited |
| Sector: Services & Goods | |
| SubSector: Gambling | |
| MarketCap: 376 Millions | |
| Recent Price: 8.88 Smart Investing & Trading Score: 49 | |
| Day Percent Change: 0.68% Day Change: 0.06 | |
| Week Change: 2.07% Year-to-date Change: -9.0% | |
| GAMB Links: Profile News Message Board | |
| Charts:- Daily , Weekly | |
| Add GAMB to Watchlist: View: Get Complete GAMB Trend Analysis ➞ | |
 | DENN Denny s Corporation |
| Sector: Services & Goods | |
| SubSector: Restaurants | |
| MarketCap: 367.47 Millions | |
| Recent Price: 8.35 Smart Investing & Trading Score: 42 | |
| Day Percent Change: 1.83% Day Change: 0.15 | |
| Week Change: 2.2% Year-to-date Change: -23.3% | |
| DENN Links: Profile News Message Board | |
| Charts:- Daily , Weekly | |
| Add DENN to Watchlist: View: Get Complete DENN Trend Analysis ➞ | |
 | BOOT Boot Barn Holdings, Inc. |
| Sector: Services & Goods | |
| SubSector: Apparel Stores | |
| MarketCap: 360.608 Millions | |
| Recent Price: 106.71 Smart Investing & Trading Score: 100 | |
| Day Percent Change: 3.42% Day Change: 3.53 | |
| Week Change: 7.12% Year-to-date Change: 39.0% | |
| BOOT Links: Profile News Message Board | |
| Charts:- Daily , Weekly | |
| Add BOOT to Watchlist: View: Get Complete BOOT Trend Analysis ➞ | |
 | KRT Karat Packaging Inc. |
| Sector: Services & Goods | |
| SubSector: Packaging & Containers | |
| MarketCap: 357 Millions | |
| Recent Price: 27.19 Smart Investing & Trading Score: 51 | |
| Day Percent Change: 3.23% Day Change: 0.85 | |
| Week Change: 1.34% Year-to-date Change: 9.2% | |
| KRT Links: Profile News Message Board | |
| Charts:- Daily , Weekly | |
| Add KRT to Watchlist: View: Get Complete KRT Trend Analysis ➞ | |
 | MCRI Monarch Casino & Resort, Inc. |
| Sector: Services & Goods | |
| SubSector: Resorts & Casinos | |
| MarketCap: 352.894 Millions | |
| Recent Price: 69.45 Smart Investing & Trading Score: 68 | |
| Day Percent Change: 1.67% Day Change: 1.14 | |
| Week Change: 3.13% Year-to-date Change: 0.4% | |
| MCRI Links: Profile News Message Board | |
| Charts:- Daily , Weekly | |
| Add MCRI to Watchlist: View: Get Complete MCRI Trend Analysis ➞ | |
 | CCRN Cross Country Healthcare, Inc. |
| Sector: Services & Goods | |
| SubSector: Staffing & Outsourcing Services | |
| MarketCap: 348.328 Millions | |
| Recent Price: 17.77 Smart Investing & Trading Score: 67 | |
| Day Percent Change: 4.41% Day Change: 0.75 | |
| Week Change: 1.54% Year-to-date Change: -21.5% | |
| CCRN Links: Profile News Message Board | |
| Charts:- Daily , Weekly | |
| Add CCRN to Watchlist: View: Get Complete CCRN Trend Analysis ➞ | |
 | NSSC Napco Security Technologies, Inc. |
| Sector: Services & Goods | |
| SubSector: Security & Protection Services | |
| MarketCap: 339.103 Millions | |
| Recent Price: 43.32 Smart Investing & Trading Score: 100 | |
| Day Percent Change: 4.61% Day Change: 1.91 | |
| Week Change: 8.25% Year-to-date Change: 26.5% | |
| NSSC Links: Profile News Message Board | |
| Charts:- Daily , Weekly | |
| Add NSSC to Watchlist: View: Get Complete NSSC Trend Analysis ➞ | |
 | CRMT America s Car-Mart, Inc. |
| Sector: Services & Goods | |
| SubSector: Auto Dealerships | |
| MarketCap: 329.921 Millions | |
| Recent Price: 58.72 Smart Investing & Trading Score: 57 | |
| Day Percent Change: 3.29% Day Change: 1.87 | |
| Week Change: 0.82% Year-to-date Change: -22.5% | |
| CRMT Links: Profile News Message Board | |
| Charts:- Daily , Weekly | |
| Add CRMT to Watchlist: View: Get Complete CRMT Trend Analysis ➞ | |
 | IMXI International Money Express, Inc. |
| Sector: Services & Goods | |
| SubSector: Business Services | |
| MarketCap: 326.582 Millions | |
| Recent Price: 21.89 Smart Investing & Trading Score: 68 | |
| Day Percent Change: 1.58% Day Change: 0.34 | |
| Week Change: 2.58% Year-to-date Change: -0.9% | |
| IMXI Links: Profile News Message Board | |
| Charts:- Daily , Weekly | |
| Add IMXI to Watchlist: View: Get Complete IMXI Trend Analysis ➞ | |
 | CCO Clear Channel Outdoor Holdings, Inc. |
| Sector: Services & Goods | |
| SubSector: Marketing Services | |
| MarketCap: 312.715 Millions | |
| Recent Price: 1.50 Smart Investing & Trading Score: 42 | |
| Day Percent Change: 2.04% Day Change: 0.03 | |
| Week Change: 0.67% Year-to-date Change: -17.6% | |
| CCO Links: Profile News Message Board | |
| Charts:- Daily , Weekly | |
| Add CCO to Watchlist: View: Get Complete CCO Trend Analysis ➞ | |
 | DJCO Daily Journal Corporation |
| Sector: Services & Goods | |
| SubSector: Publishing - Newspapers | |
| MarketCap: 306.822 Millions | |
| Recent Price: 356.90 Smart Investing & Trading Score: 75 | |
| Day Percent Change: 1.97% Day Change: 6.90 | |
| Week Change: 2.56% Year-to-date Change: 4.7% | |
| DJCO Links: Profile News Message Board | |
| Charts:- Daily , Weekly | |
| Add DJCO to Watchlist: View: Get Complete DJCO Trend Analysis ➞ | |
 | CATO The Cato Corporation |
| Sector: Services & Goods | |
| SubSector: Apparel Stores | |
| MarketCap: 305.208 Millions | |
| Recent Price: 5.01 Smart Investing & Trading Score: 42 | |
| Day Percent Change: -1.76% Day Change: -0.09 | |
| Week Change: -0.6% Year-to-date Change: -29.8% | |
| CATO Links: Profile News Message Board | |
| Charts:- Daily , Weekly | |
| Add CATO to Watchlist: View: Get Complete CATO Trend Analysis ➞ | |
 | CSV Carriage Services, Inc. |
| Sector: Services & Goods | |
| SubSector: Personal Services | |
| MarketCap: 304.725 Millions | |
| Recent Price: 25.18 Smart Investing & Trading Score: 93 | |
| Day Percent Change: 1.00% Day Change: 0.25 | |
| Week Change: 4.92% Year-to-date Change: 0.7% | |
| CSV Links: Profile News Message Board | |
| Charts:- Daily , Weekly | |
| Add CSV to Watchlist: View: Get Complete CSV Trend Analysis ➞ | |
 | PLCE The Children s Place, Inc. |
| Sector: Services & Goods | |
| SubSector: Apparel Stores | |
| MarketCap: 303.608 Millions | |
| Recent Price: 7.16 Smart Investing & Trading Score: 10 | |
| Day Percent Change: -5.04% Day Change: -0.38 | |
| Week Change: -13.21% Year-to-date Change: -69.2% | |
| PLCE Links: Profile News Message Board | |
| Charts:- Daily , Weekly | |
| Add PLCE to Watchlist: View: Get Complete PLCE Trend Analysis ➞ | |
 | LOCO El Pollo Loco Holdings, Inc. |
| Sector: Services & Goods | |
| SubSector: Restaurants | |
| MarketCap: 296.97 Millions | |
| Recent Price: 8.46 Smart Investing & Trading Score: 32 | |
| Day Percent Change: 2.42% Day Change: 0.20 | |
| Week Change: 1.68% Year-to-date Change: -4.1% | |
| LOCO Links: Profile News Message Board | |
| Charts:- Daily , Weekly | |
| Add LOCO to Watchlist: View: Get Complete LOCO Trend Analysis ➞ | |
 | CARS Cars.com Inc. |
| Sector: Services & Goods | |
| SubSector: Auto Dealerships | |
| MarketCap: 290.321 Millions | |
| Recent Price: 16.70 Smart Investing & Trading Score: 49 | |
| Day Percent Change: 0.85% Day Change: 0.14 | |
| Week Change: 1.58% Year-to-date Change: -12.0% | |
| CARS Links: Profile News Message Board | |
| Charts:- Daily , Weekly | |
| Add CARS to Watchlist: View: Get Complete CARS Trend Analysis ➞ | |
 | PLAY Dave & Buster s Entertainment, Inc. |
| Sector: Services & Goods | |
| SubSector: Restaurants | |
| MarketCap: 283.07 Millions | |
| Recent Price: 56.13 Smart Investing & Trading Score: 63 | |
| Day Percent Change: 2.84% Day Change: 1.55 | |
| Week Change: 4.53% Year-to-date Change: 4.2% | |
| PLAY Links: Profile News Message Board | |
| Charts:- Daily , Weekly | |
| Add PLAY to Watchlist: View: Get Complete PLAY Trend Analysis ➞ | |
 | CURV Torrid Holdings Inc. |
| Sector: Services & Goods | |
| SubSector: Apparel Retail | |
| MarketCap: 278 Millions | |
| Recent Price: 5.02 Smart Investing & Trading Score: 69 | |
| Day Percent Change: 3.29% Day Change: 0.16 | |
| Week Change: 3.93% Year-to-date Change: -14.2% | |
| CURV Links: Profile News Message Board | |
| Charts:- Daily , Weekly | |
| Add CURV to Watchlist: View: Get Complete CURV Trend Analysis ➞ | |
 | EVRI Everi Holdings Inc. |
| Sector: Services & Goods | |
| SubSector: Gaming Activities | |
| MarketCap: 273.389 Millions | |
| Recent Price: 8.70 Smart Investing & Trading Score: 10 | |
| Day Percent Change: -2.68% Day Change: -0.24 | |
| Week Change: -1.47% Year-to-date Change: -22.8% | |
| EVRI Links: Profile News Message Board | |
| Charts:- Daily , Weekly | |
| Add EVRI to Watchlist: View: Get Complete EVRI Trend Analysis ➞ | |
| For tabular summary view of above stock list: Summary View ➞ 0 - 25 , 25 - 50 , 50 - 75 , 75 - 100 , 100 - 125 , 125 - 150 , 150 - 175 , 175 - 200 , 200 - 225 | ||
| Click To Change The Sort Order: By Market Cap or Company Size Performance: Year-to-date, Week and Day | |
| Select Chart Type: | ||
| Too many stocks? View smallcap stocks filtered by marketcap & sector |
| Marketcap: All SmallCap Stocks (default-no microcap), Large, Mid-Range, Small & MicroCap |
| Sector: Tech, Finance, Energy, Staples, Retail, Industrial, Materials, Utilities & Medical |
|
Best Stocks Today 12Stocks.com |
© 2024 12Stocks.com Terms & Conditions Privacy Contact Us
All Information Provided Only For Education And Not To Be Used For Investing or Trading. See Terms & Conditions


One More Thing ... Get Best Stocks Delivered Daily!
Never Ever Miss A Move With Our Top Ten Stocks Lists
Find Best Stocks In Any Market - Bull or Bear Market
Take A Peek At Our Top Ten Stocks Lists: Daily, Weekly, Year-to-Date & Top Trends
Find Best Stocks In Any Market - Bull or Bear Market
Take A Peek At Our Top Ten Stocks Lists: Daily, Weekly, Year-to-Date & Top Trends
Smallcap Stocks With Best Up Trends [0-bearish to 100-bullish]: Hibbett Sports[100], Braemar Hotels[100], Akoustis [100], FTAI Infrastructure[100], Vertex Energy[100], AZZ [100], Day One[100], Oscar Health[100], Mueller Industries[100], ScanSource [100], Gannett Co[100]
Best Smallcap Stocks Year-to-Date:
Janux [364.03%], Viking [248.9%], Alpine Immune[239.02%], Longboard [231.75%], Avidity Biosciences[178.1%], Arcutis Bio[170.59%], Super Micro[168.02%], Vera [154.91%], Hippo [134.14%], Y-mAbs [124.93%], Stoke [113.88%] Best Smallcap Stocks This Week:
Matterport [164.37%], Seres [35.74%], Riot Blockchain[29.79%], Cipher Mining[25%], ProKidney [24.75%], Braemar Hotels[21.3%], Akoustis [21.29%], Hibbett Sports[21.1%], Assertio [19.28%], BigBear.ai [17.93%], Marathon Patent[17.82%] Best Smallcap Stocks Daily:
Virgin Galactic[22.38%], Seres [21.68%], Marathon Patent[20.04%], Hibbett Sports[18.84%], Generation Bio[16.01%], IGM Biosciences[14.07%], FuelCell Energy[13.07%], Braemar Hotels[12.96%], SES AI[12.17%], NuScale Power[11.16%], Cutera [10.82%]