
 Login Sign Up


| |||||
 |  | ||||

| 12Stocks.com Market Intelligence |
Best SmallCap Stocks
|
| In a hurry? Small Cap Stock Lists: Performance Trends Table, Stock Charts
Sort Small Cap stocks: Daily, Weekly, Year-to-Date, Market Cap & Trends. Filter Small Cap stocks list by sector: Show all, Tech, Finance, Energy, Staples, Retail, Industrial, Materials, Utilities and HealthCare Filter Small Cap stocks list by size: All Large Medium Small and MicroCap |
| 12Stocks.com Small Cap Stocks Performances & Trends Daily | |||||||||
|
|  The overall Smart Investing & Trading Score is 26 (0-bearish to 100-bullish) which puts Small Cap index in short term bearish to neutral trend. The Smart Investing & Trading Score from previous trading session is 31 and hence a deterioration of trend.
| ||||||||
Here are the Smart Investing & Trading Scores of the most requested small cap stocks at 12Stocks.com (click stock name for detailed review):
|


| 12Stocks.com: Investing in Smallcap Index with Stocks | |
|
The following table helps investors and traders sort through current performance and trends (as measured by Smart Investing & Trading Score) of various
stocks in the Smallcap Index. Quick View: Move mouse or cursor over stock symbol (ticker) to view short-term technical chart and over stock name to view long term chart. Click on  to add stock symbol to your watchlist and to add stock symbol to your watchlist and  to view watchlist. Click on any ticker or stock name for detailed market intelligence report for that stock. to view watchlist. Click on any ticker or stock name for detailed market intelligence report for that stock. |
12Stocks.com Performance of Stocks in Smallcap Index
| Ticker | Stock Name | Watchlist | Category | Recent Price | Smart Investing & Trading Score | Change % | YTD Change% |
| DGII | Digi |   | Technology | 30.40 | 36 | -1.65% | 16.92% |
| POWL | Powell Industries | | Industrials | 126.51 | 36 | 0.44% | 43.11% |
| BSRR | Sierra Bancorp | | Financials | 18.09 | 8 | 0.56% | -19.78% |
| RIGL | Rigel | | Health Care | 1.15 | 10 | -4.17% | -20.69% |
| QSI | Quantum-Si | | Health Care | 1.66 | 31 | -1.78% | -17.41% |
| CIVB | Civista Bancshares | | Financials | 14.56 | 45 | 1.53% | -21.04% |
| PAR | PAR | | Technology | 42.01 | 0 | -3.14% | -3.51% |
| BRY | Berry | | Energy | 8.29 | 51 | -1.78% | 17.92% |
| VALU | Value Line | | Services & Goods | 37.95 | 20 | -3.56% | -22.15% |
| GWRS | Global Water | | Utilities | 12.01 | 44 | -1.56% | -8.18% |
| FISI | Financial Institutions | | Financials | 16.67 | 7 | -1.24% | -21.74% |
| HVT | Haverty Furniture | | Services & Goods | 30.46 | 8 | -0.68% | -14.20% |
| EEX | Emerald Holding | | Services & Goods | 6.22 | 31 | 0.00% | 4.01% |
| LAND | Gladstone Land | | Financials | 12.63 | 10 | -2.02% | -12.60% |
| SCVL | Shoe Carnival | | Services & Goods | 32.17 | 31 | -1.59% | 6.49% |
| GNK | Genco Shipping | | Transports | 20.65 | 83 | 0.49% | 24.47% |
| LXRX | Lexicon | | Health Care | 1.87 | 36 | -5.08% | 22.22% |
| MNKD | MannKind | | Health Care | 4.12 | 26 | -0.72% | 13.19% |
| OB | Outbrain | | Services & Goods | 4.04 | 76 | -1.22% | -7.76% |
| OCUL | Ocular Therapeutix | | Health Care | 7.80 | 41 | -2.38% | 74.89% |
| ODC | Oil-Dri | | Materials | 69.00 | 36 | -0.04% | 2.86% |
| SPWH | Sportsman s | | Consumer Staples | 3.21 | 35 | -2.73% | -24.65% |
| PCYO | Pure Cycle | | Utilities | 9.53 | 35 | -0.94% | -8.98% |
| DOMO | Domo | | Technology | 7.92 | 5 | -4.46% | -23.03% |
| FEAM | 5E Advanced | | Materials | 1.21 | 10 | -3.97% | -14.18% |
| For chart view version of above stock list: Chart View ➞ 0 - 25 , 25 - 50 , 50 - 75 , 75 - 100 , 100 - 125 , 125 - 150 , 150 - 175 , 175 - 200 , 200 - 225 , 225 - 250 , 250 - 275 , 275 - 300 , 300 - 325 , 325 - 350 , 350 - 375 , 375 - 400 , 400 - 425 , 425 - 450 , 450 - 475 , 475 - 500 , 500 - 525 | ||
 | Click To Change The Sort Order: By Market Cap or Company Size Performance: Year-to-date, Week and Day |  |
| Too many stocks? View smallcap stocks filtered by marketcap & sector |
| Marketcap: All SmallCap Stocks (default-no microcap), Large, Mid-Range, Small |
| Smallcap Sector: Tech, Finance, Energy, Staples, Retail, Industrial, Materials, & Medical |
|
Get the most comprehensive stock market coverage daily at 12Stocks.com ➞ Best Stocks Today ➞ Best Stocks Weekly ➞ Best Stocks Year-to-Date ➞ Best Stocks Trends ➞  Best Stocks Today 12Stocks.com Best Nasdaq Stocks ➞ Best S&P 500 Stocks ➞ Best Tech Stocks ➞ Best Biotech Stocks ➞ |
| Detailed Overview of SmallCap Stocks |
| SmallCap Technical Overview, Leaders & Laggards, Top SmallCap ETF Funds & Detailed SmallCap Stocks List, Charts, Trends & More |
| Smallcap: Technical Analysis, Trends & YTD Performance | |
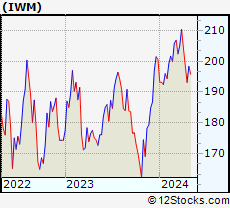
| SmallCap segment as represented by
IWM, an exchange-traded fund [ETF], holds basket of thousands of smallcap stocks from across all major sectors of the US stock market. The smallcap index (contains stocks like Riverbed & Sotheby's) is down by -2.46% and is currently underperforming the overall market by -7.8% year-to-date. Below is a quick view of technical charts and trends: | |
 IWM Weekly Chart |
|
| Long Term Trend: Good | |
| Medium Term Trend: Not Good | |
 IWM Daily Chart |
|
| Short Term Trend: Not Good | |
| Overall Trend Score: 26 | |
| YTD Performance: -2.46% | |
| **Trend Scores & Views Are Only For Educational Purposes And Not For Investing | |
| 12Stocks.com: Top Performing Small Cap Index Stocks | ||||||||||||||||||||||||||||||||||||||||||||||||
 The top performing Small Cap Index stocks year to date are
Now, more recently, over last week, the top performing Small Cap Index stocks on the move are


|
||||||||||||||||||||||||||||||||||||||||||||||||
| 12Stocks.com: Investing in Smallcap Index using Exchange Traded Funds | |
|
The following table shows list of key exchange traded funds (ETF) that
help investors track Smallcap index. The following list also includes leveraged ETF funds that track twice or thrice the daily returns of Smallcap indices. Short or inverse ETF funds move in the opposite direction to the index they track and are useful during market pullbacks or during bear markets. Quick View: Move mouse or cursor over ETF symbol (ticker) to view short-term technical chart and over ETF name to view long term chart. Click on ticker or stock name for detailed view. Click on to add stock symbol to your watchlist and to view watchlist. |
12Stocks.com List of ETFs that track Smallcap Index
| Ticker | ETF Name | Watchlist | Recent Price | Smart Investing & Trading Score | Change % | Week % | Year-to-date % |
| IWM | iShares Russell 2000 | | 195.78 | 26 | -1.46 | -1.46 | -2.46% |
| IJR | iShares Core S&P Small-Cap | | 103.54 | 18 | -0.93 | -0.93 | -4.35% |
| VTWO | Vanguard Russell 2000 ETF | | 79.23 | 31 | -1.36 | -1.36 | -2.31% |
| IWN | iShares Russell 2000 Value | | 148.60 | 31 | -1.18 | -1.18 | -4.33% |
| IWO | iShares Russell 2000 Growth | | 251.04 | 31 | -1.69 | -1.69 | -0.47% |
| IJS | iShares S&P Small-Cap 600 Value | | 95.20 | 0 | -1.01 | -1.01 | -7.64% |
| IJT | iShares S&P Small-Cap 600 Growth | | 123.52 | 39 | -1.01 | -1.01 | -1.29% |
| XSLV | PowerShares S&P SmallCap Low Volatil ETF | | 41.88 | 13 | -0.50 | -0.5 | -5.14% |
| SDD | ProShares UltraShort SmallCap600 | | 20.23 | 74 | 2.01 | 2.01 | 9.79% |
| SAA | ProShares Ultra SmallCap600 | | 22.43 | 0 | -0.58 | -0.58 | -10.1% |
| SBB | ProShares Short SmallCap600 | | 16.41 | 52 | -0.83 | -0.83 | 3.01% |
| SMLV | SPDR SSGA US Small Cap Low Volatil ETF | | 104.73 | 8 | -0.27 | -0.27 | -6.92% |
| 12Stocks.com: Charts, Trends, Fundamental Data and Performances of SmallCap Stocks | |
|
We now take in-depth look at all SmallCap stocks including charts, multi-period performances and overall trends (as measured by Smart Investing & Trading Score). One can sort SmallCap stocks (click link to choose) by Daily, Weekly and by Year-to-Date performances. Also, one can sort by size of the company or by market capitalization. |
| Select Your Default Chart Type: | |||||
| |||||
| Click on stock symbol or name for detailed view. Click on to add stock symbol to your watchlist and to view watchlist. Quick View: Move mouse or cursor over "Daily" to quickly view daily technical stock chart and over "Weekly" to view weekly technical stock chart. | |||||

 | DGII Digi International Inc. |
| Sector: Technology | |
| SubSector: Communication Equipment | |
| MarketCap: 257.339 Millions | |
| Recent Price: 30.40 Smart Investing & Trading Score: 36 | |
| Day Percent Change: -1.65% Day Change: -0.51 | |
| Week Change: -1.65% Year-to-date Change: 16.9% | |
| DGII Links: Profile News Message Board | |
| Charts:- Daily , Weekly | |
| Add DGII to Watchlist: View: Get Complete DGII Trend Analysis ➞ | |
 | POWL Powell Industries, Inc. |
| Sector: Industrials | |
| SubSector: Diversified Machinery | |
| MarketCap: 257.216 Millions | |
| Recent Price: 126.51 Smart Investing & Trading Score: 36 | |
| Day Percent Change: 0.44% Day Change: 0.56 | |
| Week Change: 0.44% Year-to-date Change: 43.1% | |
| POWL Links: Profile News Message Board | |
| Charts:- Daily , Weekly | |
| Add POWL to Watchlist: View: Get Complete POWL Trend Analysis ➞ | |
 | BSRR Sierra Bancorp |
| Sector: Financials | |
| SubSector: Regional - Pacific Banks | |
| MarketCap: 256.929 Millions | |
| Recent Price: 18.09 Smart Investing & Trading Score: 8 | |
| Day Percent Change: 0.56% Day Change: 0.10 | |
| Week Change: 0.56% Year-to-date Change: -19.8% | |
| BSRR Links: Profile News Message Board | |
| Charts:- Daily , Weekly | |
| Add BSRR to Watchlist: View: Get Complete BSRR Trend Analysis ➞ | |
 | RIGL Rigel Pharmaceuticals, Inc. |
| Sector: Health Care | |
| SubSector: Biotechnology | |
| MarketCap: 256.585 Millions | |
| Recent Price: 1.15 Smart Investing & Trading Score: 10 | |
| Day Percent Change: -4.17% Day Change: -0.05 | |
| Week Change: -4.17% Year-to-date Change: -20.7% | |
| RIGL Links: Profile News Message Board | |
| Charts:- Daily , Weekly | |
| Add RIGL to Watchlist: View: Get Complete RIGL Trend Analysis ➞ | |
 | QSI Quantum-Si incorporated |
| Sector: Health Care | |
| SubSector: Biotechnology | |
| MarketCap: 256 Millions | |
| Recent Price: 1.66 Smart Investing & Trading Score: 31 | |
| Day Percent Change: -1.78% Day Change: -0.03 | |
| Week Change: -1.78% Year-to-date Change: -17.4% | |
| QSI Links: Profile News Message Board | |
| Charts:- Daily , Weekly | |
| Add QSI to Watchlist: View: Get Complete QSI Trend Analysis ➞ | |
 | CIVB Civista Bancshares, Inc. |
| Sector: Financials | |
| SubSector: Regional - Pacific Banks | |
| MarketCap: 255.929 Millions | |
| Recent Price: 14.56 Smart Investing & Trading Score: 45 | |
| Day Percent Change: 1.53% Day Change: 0.22 | |
| Week Change: 1.53% Year-to-date Change: -21.0% | |
| CIVB Links: Profile News Message Board | |
| Charts:- Daily , Weekly | |
| Add CIVB to Watchlist: View: Get Complete CIVB Trend Analysis ➞ | |
 | PAR PAR Technology Corporation |
| Sector: Technology | |
| SubSector: Application Software | |
| MarketCap: 255.862 Millions | |
| Recent Price: 42.01 Smart Investing & Trading Score: 0 | |
| Day Percent Change: -3.14% Day Change: -1.36 | |
| Week Change: -3.14% Year-to-date Change: -3.5% | |
| PAR Links: Profile News Message Board | |
| Charts:- Daily , Weekly | |
| Add PAR to Watchlist: View: Get Complete PAR Trend Analysis ➞ | |
 | BRY Berry Corporation |
| Sector: Energy | |
| SubSector: Independent Oil & Gas | |
| MarketCap: 254.793 Millions | |
| Recent Price: 8.29 Smart Investing & Trading Score: 51 | |
| Day Percent Change: -1.78% Day Change: -0.15 | |
| Week Change: -1.78% Year-to-date Change: 17.9% | |
| BRY Links: Profile News Message Board | |
| Charts:- Daily , Weekly | |
| Add BRY to Watchlist: View: Get Complete BRY Trend Analysis ➞ | |
 | VALU Value Line, Inc. |
| Sector: Services & Goods | |
| SubSector: Publishing - Periodicals | |
| MarketCap: 254.3 Millions | |
| Recent Price: 37.95 Smart Investing & Trading Score: 20 | |
| Day Percent Change: -3.56% Day Change: -1.40 | |
| Week Change: -3.56% Year-to-date Change: -22.2% | |
| VALU Links: Profile News Message Board | |
| Charts:- Daily , Weekly | |
| Add VALU to Watchlist: View: Get Complete VALU Trend Analysis ➞ | |
 | GWRS Global Water Resources, Inc. |
| Sector: Utilities | |
| SubSector: Water Utilities | |
| MarketCap: 253.502 Millions | |
| Recent Price: 12.01 Smart Investing & Trading Score: 44 | |
| Day Percent Change: -1.56% Day Change: -0.19 | |
| Week Change: -1.56% Year-to-date Change: -8.2% | |
| GWRS Links: Profile News Message Board | |
| Charts:- Daily , Weekly | |
| Add GWRS to Watchlist: View: Get Complete GWRS Trend Analysis ➞ | |
 | FISI Financial Institutions, Inc. |
| Sector: Financials | |
| SubSector: Regional - Mid-Atlantic Banks | |
| MarketCap: 253.459 Millions | |
| Recent Price: 16.67 Smart Investing & Trading Score: 7 | |
| Day Percent Change: -1.24% Day Change: -0.21 | |
| Week Change: -1.24% Year-to-date Change: -21.7% | |
| FISI Links: Profile News Message Board | |
| Charts:- Daily , Weekly | |
| Add FISI to Watchlist: View: Get Complete FISI Trend Analysis ➞ | |
 | HVT Haverty Furniture Companies, Inc. |
| Sector: Services & Goods | |
| SubSector: Home Furnishing Stores | |
| MarketCap: 253.125 Millions | |
| Recent Price: 30.46 Smart Investing & Trading Score: 8 | |
| Day Percent Change: -0.68% Day Change: -0.21 | |
| Week Change: -0.68% Year-to-date Change: -14.2% | |
| HVT Links: Profile News Message Board | |
| Charts:- Daily , Weekly | |
| Add HVT to Watchlist: View: Get Complete HVT Trend Analysis ➞ | |
 | EEX Emerald Holding, Inc. |
| Sector: Services & Goods | |
| SubSector: Business Services | |
| MarketCap: 252.682 Millions | |
| Recent Price: 6.22 Smart Investing & Trading Score: 31 | |
| Day Percent Change: 0.00% Day Change: 0.00 | |
| Week Change: 0% Year-to-date Change: 4.0% | |
| EEX Links: Profile News Message Board | |
| Charts:- Daily , Weekly | |
| Add EEX to Watchlist: View: Get Complete EEX Trend Analysis ➞ | |
 | LAND Gladstone Land Corporation |
| Sector: Financials | |
| SubSector: REIT - Diversified | |
| MarketCap: 252.653 Millions | |
| Recent Price: 12.63 Smart Investing & Trading Score: 10 | |
| Day Percent Change: -2.02% Day Change: -0.26 | |
| Week Change: -2.02% Year-to-date Change: -12.6% | |
| LAND Links: Profile News Message Board | |
| Charts:- Daily , Weekly | |
| Add LAND to Watchlist: View: Get Complete LAND Trend Analysis ➞ | |
 | SCVL Shoe Carnival, Inc. |
| Sector: Services & Goods | |
| SubSector: Apparel Stores | |
| MarketCap: 252.508 Millions | |
| Recent Price: 32.17 Smart Investing & Trading Score: 31 | |
| Day Percent Change: -1.59% Day Change: -0.52 | |
| Week Change: -1.59% Year-to-date Change: 6.5% | |
| SCVL Links: Profile News Message Board | |
| Charts:- Daily , Weekly | |
| Add SCVL to Watchlist: View: Get Complete SCVL Trend Analysis ➞ | |
 | GNK Genco Shipping & Trading Limited |
| Sector: Transports | |
| SubSector: Shipping | |
| MarketCap: 251.614 Millions | |
| Recent Price: 20.65 Smart Investing & Trading Score: 83 | |
| Day Percent Change: 0.49% Day Change: 0.10 | |
| Week Change: 0.49% Year-to-date Change: 24.5% | |
| GNK Links: Profile News Message Board | |
| Charts:- Daily , Weekly | |
| Add GNK to Watchlist: View: Get Complete GNK Trend Analysis ➞ | |
 | LXRX Lexicon Pharmaceuticals, Inc. |
| Sector: Health Care | |
| SubSector: Biotechnology | |
| MarketCap: 251.185 Millions | |
| Recent Price: 1.87 Smart Investing & Trading Score: 36 | |
| Day Percent Change: -5.08% Day Change: -0.10 | |
| Week Change: -5.08% Year-to-date Change: 22.2% | |
| LXRX Links: Profile News Message Board | |
| Charts:- Daily , Weekly | |
| Add LXRX to Watchlist: View: Get Complete LXRX Trend Analysis ➞ | |
 | MNKD MannKind Corporation |
| Sector: Health Care | |
| SubSector: Biotechnology | |
| MarketCap: 250.885 Millions | |
| Recent Price: 4.12 Smart Investing & Trading Score: 26 | |
| Day Percent Change: -0.72% Day Change: -0.03 | |
| Week Change: -0.72% Year-to-date Change: 13.2% | |
| MNKD Links: Profile News Message Board | |
| Charts:- Daily , Weekly | |
| Add MNKD to Watchlist: View: Get Complete MNKD Trend Analysis ➞ | |
 | OB Outbrain Inc. |
| Sector: Services & Goods | |
| SubSector: Internet Content & Information | |
| MarketCap: 250 Millions | |
| Recent Price: 4.04 Smart Investing & Trading Score: 76 | |
| Day Percent Change: -1.22% Day Change: -0.05 | |
| Week Change: -1.22% Year-to-date Change: -7.8% | |
| OB Links: Profile News Message Board | |
| Charts:- Daily , Weekly | |
| Add OB to Watchlist: View: Get Complete OB Trend Analysis ➞ | |
 | OCUL Ocular Therapeutix, Inc. |
| Sector: Health Care | |
| SubSector: Biotechnology | |
| MarketCap: 249.985 Millions | |
| Recent Price: 7.80 Smart Investing & Trading Score: 41 | |
| Day Percent Change: -2.38% Day Change: -0.19 | |
| Week Change: -2.38% Year-to-date Change: 74.9% | |
| OCUL Links: Profile News Message Board | |
| Charts:- Daily , Weekly | |
| Add OCUL to Watchlist: View: Get Complete OCUL Trend Analysis ➞ | |
 | ODC Oil-Dri Corporation of America |
| Sector: Materials | |
| SubSector: Specialty Chemicals | |
| MarketCap: 249.857 Millions | |
| Recent Price: 69.00 Smart Investing & Trading Score: 36 | |
| Day Percent Change: -0.04% Day Change: -0.03 | |
| Week Change: -0.04% Year-to-date Change: 2.9% | |
| ODC Links: Profile News Message Board | |
| Charts:- Daily , Weekly | |
| Add ODC to Watchlist: View: Get Complete ODC Trend Analysis ➞ | |
 | SPWH Sportsman s Warehouse Holdings, Inc. |
| Sector: Consumer Staples | |
| SubSector: Sporting Goods | |
| MarketCap: 247.144 Millions | |
| Recent Price: 3.21 Smart Investing & Trading Score: 35 | |
| Day Percent Change: -2.73% Day Change: -0.09 | |
| Week Change: -2.73% Year-to-date Change: -24.7% | |
| SPWH Links: Profile News Message Board | |
| Charts:- Daily , Weekly | |
| Add SPWH to Watchlist: View: Get Complete SPWH Trend Analysis ➞ | |
 | PCYO Pure Cycle Corporation |
| Sector: Utilities | |
| SubSector: Water Utilities | |
| MarketCap: 247.102 Millions | |
| Recent Price: 9.53 Smart Investing & Trading Score: 35 | |
| Day Percent Change: -0.94% Day Change: -0.09 | |
| Week Change: -0.94% Year-to-date Change: -9.0% | |
| PCYO Links: Profile News Message Board | |
| Charts:- Daily , Weekly | |
| Add PCYO to Watchlist: View: Get Complete PCYO Trend Analysis ➞ | |
 | DOMO Domo, Inc. |
| Sector: Technology | |
| SubSector: Application Software | |
| MarketCap: 247.062 Millions | |
| Recent Price: 7.92 Smart Investing & Trading Score: 5 | |
| Day Percent Change: -4.46% Day Change: -0.37 | |
| Week Change: -4.46% Year-to-date Change: -23.0% | |
| DOMO Links: Profile News Message Board | |
| Charts:- Daily , Weekly | |
| Add DOMO to Watchlist: View: Get Complete DOMO Trend Analysis ➞ | |
 | FEAM 5E Advanced Materials Inc. |
| Sector: Materials | |
| SubSector: Specialty Chemicals | |
| MarketCap: 247 Millions | |
| Recent Price: 1.21 Smart Investing & Trading Score: 10 | |
| Day Percent Change: -3.97% Day Change: -0.05 | |
| Week Change: -3.97% Year-to-date Change: -14.2% | |
| FEAM Links: Profile News Message Board | |
| Charts:- Daily , Weekly | |
| Add FEAM to Watchlist: View: Get Complete FEAM Trend Analysis ➞ | |
| For tabular summary view of above stock list: Summary View ➞ 0 - 25 , 25 - 50 , 50 - 75 , 75 - 100 , 100 - 125 , 125 - 150 , 150 - 175 , 175 - 200 , 200 - 225 , 225 - 250 , 250 - 275 , 275 - 300 , 300 - 325 , 325 - 350 , 350 - 375 , 375 - 400 , 400 - 425 , 425 - 450 , 450 - 475 , 475 - 500 , 500 - 525 | ||
| Click To Change The Sort Order: By Market Cap or Company Size Performance: Year-to-date, Week and Day | |
| Select Chart Type: | ||
| Too many stocks? View smallcap stocks filtered by marketcap & sector |
| Marketcap: All SmallCap Stocks (default-no microcap), Large, Mid-Range, Small & MicroCap |
| Sector: Tech, Finance, Energy, Staples, Retail, Industrial, Materials, Utilities & Medical |
|
Best Stocks Today 12Stocks.com |
© 2024 12Stocks.com Terms & Conditions Privacy Contact Us
All Information Provided Only For Education And Not To Be Used For Investing or Trading. See Terms & Conditions


One More Thing ... Get Best Stocks Delivered Daily!
Never Ever Miss A Move With Our Top Ten Stocks Lists
Find Best Stocks In Any Market - Bull or Bear Market
Take A Peek At Our Top Ten Stocks Lists: Daily, Weekly, Year-to-Date & Top Trends
Find Best Stocks In Any Market - Bull or Bear Market
Take A Peek At Our Top Ten Stocks Lists: Daily, Weekly, Year-to-Date & Top Trends
Smallcap Stocks With Best Up Trends [0-bearish to 100-bullish]: Snap One[100], ProKidney [100], SES AI[100], Encore Wire[100], Century Aluminum[100], Core Molding[100], Theravance Biopharma[100], Acadia Realty[100], Prelude [100], Alpine Immune[100], Argan [100]
Best Smallcap Stocks Year-to-Date:
CareMax [570.1%], Janux [382.64%], Viking [259.81%], Alpine Immune[238.34%], Arcutis Bio[212.38%], Super Micro[210.54%], Vera [200.58%], Longboard [198.69%], Avidity Biosciences[164.49%], Veritone [151.1%], Stoke [132.13%] Best Smallcap Stocks This Week:
Snap One[29.48%], ProKidney [19.43%], Piedmont Lithium[15.77%], SES AI[15.44%], Eagle [13.29%], Encore Wire[11.59%], ESSA Bancorp[8.88%], Benson Hill[8.4%], Pulse Biosciences[8.31%], Century Aluminum[7.71%], Core Molding[7.45%] Best Smallcap Stocks Daily:
Snap One[29.48%], ProKidney [19.43%], Piedmont Lithium[15.77%], SES AI[15.44%], Eagle [13.29%], Encore Wire[11.59%], ESSA Bancorp[8.88%], Benson Hill[8.40%], Pulse Biosciences[8.31%], Century Aluminum[7.71%], Core Molding[7.45%]