
 Login Sign Up


| |||||
 |  | ||||

| 12Stocks.com Market Intelligence |
Best SmallCap Stocks
|
| In a hurry? Small Cap Stock Lists: Performance Trends Table, Stock Charts
Sort Small Cap stocks: Daily, Weekly, Year-to-Date, Market Cap & Trends. Filter Small Cap stocks list by sector: Show all, Tech, Finance, Energy, Staples, Retail, Industrial, Materials, Utilities and HealthCare Filter Small Cap stocks list by size: All Large Medium Small and MicroCap |
| 12Stocks.com Small Cap Stocks Performances & Trends Daily | |||||||||
|
|  The overall Smart Investing & Trading Score is 63 (0-bearish to 100-bullish) which puts Small Cap index in short term neutral to bullish trend. The Smart Investing & Trading Score from previous trading session is 58 and hence an improvement of trend.
| ||||||||
Here are the Smart Investing & Trading Scores of the most requested small cap stocks at 12Stocks.com (click stock name for detailed review):
|


| 12Stocks.com: Investing in Smallcap Index with Stocks | |
|
The following table helps investors and traders sort through current performance and trends (as measured by Smart Investing & Trading Score) of various
stocks in the Smallcap Index. Quick View: Move mouse or cursor over stock symbol (ticker) to view short-term technical chart and over stock name to view long term chart. Click on  to add stock symbol to your watchlist and to add stock symbol to your watchlist and  to view watchlist. Click on any ticker or stock name for detailed market intelligence report for that stock. to view watchlist. Click on any ticker or stock name for detailed market intelligence report for that stock. |
12Stocks.com Performance of Stocks in Smallcap Index
| Ticker | Stock Name | Watchlist | Category | Recent Price | Smart Investing & Trading Score | Change % | YTD Change% |
| EVBN | Evans Bancorp |   | Financials | 26.15 | 32 | 0.19% | -17.06% |
| FRBA | First Bank | | Financials | 12.60 | 49 | 0.92% | -14.29% |
| FCCO | First Community | | Financials | 16.89 | 67 | -0.71% | -21.55% |
| WLFC | Willis Lease | | Transports | 48.98 | 17 | -0.37% | 0.20% |
| ATLC | Atlanticus | | Financials | 24.26 | 17 | 2.15% | -37.26% |
| RRGB | Red Robin | | Services & Goods | 6.60 | 64 | -0.60% | -47.07% |
| ZEUS | Olympic Steel | | Materials | 68.93 | 65 | 1.95% | 3.34% |
| GRWG | GrowGeneration | | Materials | 2.46 | 80 | 8.85% | -1.99% |
| RYAM | Rayonier Advanced | | Materials | 4.06 | 10 | -3.33% | 0.25% |
| PRTH | Priority | | Industrials | 3.18 | 60 | -0.93% | -10.67% |
| SAMG | Silvercrest Asset | | Financials | 14.77 | 59 | -0.27% | -13.12% |
| CBAN | Colony Bankcorp | | Financials | 10.70 | 47 | -0.42% | -19.55% |
| NBN | Northeast Bank | | Financials | 53.46 | 49 | 1.23% | -3.13% |
| CLPR | Clipper Realty | | Financials | 4.20 | 59 | -1.87% | -22.22% |
| LOVE | Lovesac | | Consumer Staples | 22.04 | 59 | 0.55% | -13.74% |
| ACTG | Acacia Research | | Services & Goods | 4.97 | 75 | 0.20% | 26.79% |
| PNRG | PrimeEnergy Resources | | Energy | 99.79 | 58 | -0.21% | -6.17% |
| ABUS | Arbutus Biopharma | | Health Care | 2.69 | 43 | 1.70% | 7.60% |
| NR | Newpark Resources | | Energy | 7.33 | 56 | 0.41% | 10.39% |
| SB | Safe Bulkers | | Transports | 4.93 | 83 | 1.23% | 25.45% |
| UUUU | Energy Fuels | | Materials | 5.30 | 0 | 0.00% | -26.29% |
| OPRX | OptimizeRx | | Technology | 8.94 | 17 | -1.65% | -37.53% |
| TWI | Titan | | Industrials | 11.79 | 42 | 1.99% | -20.77% |
| HROW | Harrow Health | | Health Care | 10.32 | 46 | -2.64% | -7.86% |
| ASUR | Asure | | Technology | 7.13 | 42 | 3.18% | -25.11% |


| Too many stocks? View smallcap stocks filtered by marketcap & sector |
| Marketcap: All SmallCap Stocks (default-no microcap), Large, Mid-Range, Small |
| Smallcap Sector: Tech, Finance, Energy, Staples, Retail, Industrial, Materials, & Medical |
|
Get the most comprehensive stock market coverage daily at 12Stocks.com ➞ Best Stocks Today ➞ Best Stocks Weekly ➞ Best Stocks Year-to-Date ➞ Best Stocks Trends ➞  Best Stocks Today 12Stocks.com Best Nasdaq Stocks ➞ Best S&P 500 Stocks ➞ Best Tech Stocks ➞ Best Biotech Stocks ➞ |
| Detailed Overview of SmallCap Stocks |
| SmallCap Technical Overview, Leaders & Laggards, Top SmallCap ETF Funds & Detailed SmallCap Stocks List, Charts, Trends & More |
| Smallcap: Technical Analysis, Trends & YTD Performance | |
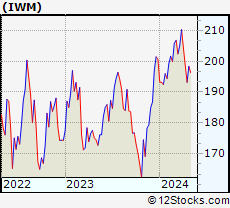
| SmallCap segment as represented by
IWM, an exchange-traded fund [ETF], holds basket of thousands of smallcap stocks from across all major sectors of the US stock market. The smallcap index (contains stocks like Riverbed & Sotheby's) is down by -1.07% and is currently underperforming the overall market by -6.71% year-to-date. Below is a quick view of technical charts and trends: | |
 IWM Weekly Chart |
|
| Long Term Trend: Good | |
| Medium Term Trend: Not Good | |
 IWM Daily Chart |
|
| Short Term Trend: Very Good | |
| Overall Trend Score: 63 | |
| YTD Performance: -1.07% | |
| **Trend Scores & Views Are Only For Educational Purposes And Not For Investing | |
| 12Stocks.com: Top Performing Small Cap Index Stocks | ||||||||||||||||||||||||||||||||||||||||||||||||
 The top performing Small Cap Index stocks year to date are
Now, more recently, over last week, the top performing Small Cap Index stocks on the move are


|
||||||||||||||||||||||||||||||||||||||||||||||||
| 12Stocks.com: Investing in Smallcap Index using Exchange Traded Funds | |
|
The following table shows list of key exchange traded funds (ETF) that
help investors track Smallcap index. The following list also includes leveraged ETF funds that track twice or thrice the daily returns of Smallcap indices. Short or inverse ETF funds move in the opposite direction to the index they track and are useful during market pullbacks or during bear markets. Quick View: Move mouse or cursor over ETF symbol (ticker) to view short-term technical chart and over ETF name to view long term chart. Click on ticker or stock name for detailed view. Click on to add stock symbol to your watchlist and to view watchlist. |
12Stocks.com List of ETFs that track Smallcap Index
| Ticker | ETF Name | Watchlist | Recent Price | Smart Investing & Trading Score | Change % | Week % | Year-to-date % |
| IWM | iShares Russell 2000 | | 198.57 | 63 | 1.67 | 2.81 | -1.07% |
| IJR | iShares Core S&P Small-Cap | | 105.96 | 75 | 2.41 | 2.65 | -2.12% |
| VTWO | Vanguard Russell 2000 ETF | | 80.29 | 70 | 1.74 | 2.83 | -1% |
| IWN | iShares Russell 2000 Value | | 151.74 | 75 | 1.49 | 2.68 | -2.31% |
| IJS | iShares S&P Small-Cap 600 Value | | 98.13 | 67 | 1.76 | 2.64 | -4.79% |
| IWO | iShares Russell 2000 Growth | | 252.37 | 58 | 1.79 | 2.89 | 0.06% |
| IJT | iShares S&P Small-Cap 600 Growth | | 125.72 | 70 | 1.91 | 2.87 | 0.46% |
| XSLV | PowerShares S&P SmallCap Low Volatil ETF | | 43.05 | 80 | 1.44 | 2.06 | -2.49% |
| SMLV | SPDR SSGA US Small Cap Low Volatil ETF | | 108.77 | 80 | 1.20 | 2.52 | -3.34% |
| SAA | ProShares Ultra SmallCap600 | | 23.15 | 80 | 3.49 | 6.19 | -7.21% |
| SBB | ProShares Short SmallCap600 | | 16.37 | 20 | -1.48 | -2.77 | 2.79% |
| SDD | ProShares UltraShort SmallCap600 | | 19.23 | 30 | -2.63 | -5.46 | 4.36% |
| 12Stocks.com: Charts, Trends, Fundamental Data and Performances of SmallCap Stocks | |
|
We now take in-depth look at all SmallCap stocks including charts, multi-period performances and overall trends (as measured by Smart Investing & Trading Score). One can sort SmallCap stocks (click link to choose) by Daily, Weekly and by Year-to-Date performances. Also, one can sort by size of the company or by market capitalization. |
| Select Your Default Chart Type: | |||||
| |||||
| Click on stock symbol or name for detailed view. Click on to add stock symbol to your watchlist and to view watchlist. Quick View: Move mouse or cursor over "Daily" to quickly view daily technical stock chart and over "Weekly" to view weekly technical stock chart. | |||||

 | EVBN Evans Bancorp, Inc. |
| Sector: Financials | |
| SubSector: Regional - Northeast Banks | |
| MarketCap: 124.899 Millions | |
| Recent Price: 26.15 Smart Investing & Trading Score: 32 | |
| Day Percent Change: 0.19% Day Change: 0.05 | |
| Week Change: -0.15% Year-to-date Change: -17.1% | |
| EVBN Links: Profile News Message Board | |
| Charts:- Daily , Weekly | |
| Add EVBN to Watchlist: View: Get Complete EVBN Trend Analysis ➞ | |
 | FRBA First Bank |
| Sector: Financials | |
| SubSector: Regional - Mid-Atlantic Banks | |
| MarketCap: 124.859 Millions | |
| Recent Price: 12.60 Smart Investing & Trading Score: 49 | |
| Day Percent Change: 0.92% Day Change: 0.12 | |
| Week Change: -0.94% Year-to-date Change: -14.3% | |
| FRBA Links: Profile News Message Board | |
| Charts:- Daily , Weekly | |
| Add FRBA to Watchlist: View: Get Complete FRBA Trend Analysis ➞ | |
 | FCCO First Community Corporation |
| Sector: Financials | |
| SubSector: Regional - Southwest Banks | |
| MarketCap: 123.865 Millions | |
| Recent Price: 16.89 Smart Investing & Trading Score: 67 | |
| Day Percent Change: -0.71% Day Change: -0.12 | |
| Week Change: 5.56% Year-to-date Change: -21.6% | |
| FCCO Links: Profile News Message Board | |
| Charts:- Daily , Weekly | |
| Add FCCO to Watchlist: View: Get Complete FCCO Trend Analysis ➞ | |
 | WLFC Willis Lease Finance Corporation |
| Sector: Transports | |
| SubSector: Rental & Leasing Services | |
| MarketCap: 122.044 Millions | |
| Recent Price: 48.98 Smart Investing & Trading Score: 17 | |
| Day Percent Change: -0.37% Day Change: -0.18 | |
| Week Change: -1.82% Year-to-date Change: 0.2% | |
| WLFC Links: Profile News Message Board | |
| Charts:- Daily , Weekly | |
| Add WLFC to Watchlist: View: Get Complete WLFC Trend Analysis ➞ | |
 | ATLC Atlanticus Holdings Corporation |
| Sector: Financials | |
| SubSector: Credit Services | |
| MarketCap: 122.008 Millions | |
| Recent Price: 24.26 Smart Investing & Trading Score: 17 | |
| Day Percent Change: 2.15% Day Change: 0.51 | |
| Week Change: -0.33% Year-to-date Change: -37.3% | |
| ATLC Links: Profile News Message Board | |
| Charts:- Daily , Weekly | |
| Add ATLC to Watchlist: View: Get Complete ATLC Trend Analysis ➞ | |
 | RRGB Red Robin Gourmet Burgers, Inc. |
| Sector: Services & Goods | |
| SubSector: Restaurants | |
| MarketCap: 121.57 Millions | |
| Recent Price: 6.60 Smart Investing & Trading Score: 64 | |
| Day Percent Change: -0.60% Day Change: -0.04 | |
| Week Change: 3.13% Year-to-date Change: -47.1% | |
| RRGB Links: Profile News Message Board | |
| Charts:- Daily , Weekly | |
| Add RRGB to Watchlist: View: Get Complete RRGB Trend Analysis ➞ | |
 | ZEUS Olympic Steel, Inc. |
| Sector: Materials | |
| SubSector: Steel & Iron | |
| MarketCap: 118.888 Millions | |
| Recent Price: 68.93 Smart Investing & Trading Score: 65 | |
| Day Percent Change: 1.95% Day Change: 1.32 | |
| Week Change: 1.56% Year-to-date Change: 3.3% | |
| ZEUS Links: Profile News Message Board | |
| Charts:- Daily , Weekly | |
| Add ZEUS to Watchlist: View: Get Complete ZEUS Trend Analysis ➞ | |
 | GRWG GrowGeneration Corp. |
| Sector: Materials | |
| SubSector: Agricultural Chemicals | |
| MarketCap: 118.429 Millions | |
| Recent Price: 2.46 Smart Investing & Trading Score: 80 | |
| Day Percent Change: 8.85% Day Change: 0.20 | |
| Week Change: 16.86% Year-to-date Change: -2.0% | |
| GRWG Links: Profile News Message Board | |
| Charts:- Daily , Weekly | |
| Add GRWG to Watchlist: View: Get Complete GRWG Trend Analysis ➞ | |
 | RYAM Rayonier Advanced Materials Inc. |
| Sector: Materials | |
| SubSector: Chemicals - Major Diversified | |
| MarketCap: 116.736 Millions | |
| Recent Price: 4.06 Smart Investing & Trading Score: 10 | |
| Day Percent Change: -3.33% Day Change: -0.14 | |
| Week Change: -5.58% Year-to-date Change: 0.3% | |
| RYAM Links: Profile News Message Board | |
| Charts:- Daily , Weekly | |
| Add RYAM to Watchlist: View: Get Complete RYAM Trend Analysis ➞ | |
 | PRTH Priority Technology Holdings, Inc. |
| Sector: Industrials | |
| SubSector: Conglomerates | |
| MarketCap: 116.548 Millions | |
| Recent Price: 3.18 Smart Investing & Trading Score: 60 | |
| Day Percent Change: -0.93% Day Change: -0.03 | |
| Week Change: -0.47% Year-to-date Change: -10.7% | |
| PRTH Links: Profile News Message Board | |
| Charts:- Daily , Weekly | |
| Add PRTH to Watchlist: View: Get Complete PRTH Trend Analysis ➞ | |
 | SAMG Silvercrest Asset Management Group Inc. |
| Sector: Financials | |
| SubSector: Asset Management | |
| MarketCap: 116.303 Millions | |
| Recent Price: 14.77 Smart Investing & Trading Score: 59 | |
| Day Percent Change: -0.27% Day Change: -0.04 | |
| Week Change: 1.03% Year-to-date Change: -13.1% | |
| SAMG Links: Profile News Message Board | |
| Charts:- Daily , Weekly | |
| Add SAMG to Watchlist: View: Get Complete SAMG Trend Analysis ➞ | |
 | CBAN Colony Bankcorp, Inc. |
| Sector: Financials | |
| SubSector: Regional - Mid-Atlantic Banks | |
| MarketCap: 115.559 Millions | |
| Recent Price: 10.70 Smart Investing & Trading Score: 47 | |
| Day Percent Change: -0.42% Day Change: -0.04 | |
| Week Change: 0.66% Year-to-date Change: -19.6% | |
| CBAN Links: Profile News Message Board | |
| Charts:- Daily , Weekly | |
| Add CBAN to Watchlist: View: Get Complete CBAN Trend Analysis ➞ | |
 | NBN Northeast Bank |
| Sector: Financials | |
| SubSector: Regional - Northeast Banks | |
| MarketCap: 114.199 Millions | |
| Recent Price: 53.46 Smart Investing & Trading Score: 49 | |
| Day Percent Change: 1.23% Day Change: 0.65 | |
| Week Change: 1.19% Year-to-date Change: -3.1% | |
| NBN Links: Profile News Message Board | |
| Charts:- Daily , Weekly | |
| Add NBN to Watchlist: View: Get Complete NBN Trend Analysis ➞ | |
 | CLPR Clipper Realty Inc. |
| Sector: Financials | |
| SubSector: REIT - Diversified | |
| MarketCap: 113.253 Millions | |
| Recent Price: 4.20 Smart Investing & Trading Score: 59 | |
| Day Percent Change: -1.87% Day Change: -0.08 | |
| Week Change: 3.96% Year-to-date Change: -22.2% | |
| CLPR Links: Profile News Message Board | |
| Charts:- Daily , Weekly | |
| Add CLPR to Watchlist: View: Get Complete CLPR Trend Analysis ➞ | |
 | LOVE The Lovesac Company |
| Sector: Consumer Staples | |
| SubSector: Home Furnishings & Fixtures | |
| MarketCap: 112.835 Millions | |
| Recent Price: 22.04 Smart Investing & Trading Score: 59 | |
| Day Percent Change: 0.55% Day Change: 0.12 | |
| Week Change: 5.96% Year-to-date Change: -13.7% | |
| LOVE Links: Profile News Message Board | |
| Charts:- Daily , Weekly | |
| Add LOVE to Watchlist: View: Get Complete LOVE Trend Analysis ➞ | |
 | ACTG Acacia Research Corporation |
| Sector: Services & Goods | |
| SubSector: Business Services | |
| MarketCap: 112.782 Millions | |
| Recent Price: 4.97 Smart Investing & Trading Score: 75 | |
| Day Percent Change: 0.20% Day Change: 0.01 | |
| Week Change: 1.84% Year-to-date Change: 26.8% | |
| ACTG Links: Profile News Message Board | |
| Charts:- Daily , Weekly | |
| Add ACTG to Watchlist: View: Get Complete ACTG Trend Analysis ➞ | |
 | PNRG PrimeEnergy Resources Corporation |
| Sector: Energy | |
| SubSector: Independent Oil & Gas | |
| MarketCap: 112.593 Millions | |
| Recent Price: 99.79 Smart Investing & Trading Score: 58 | |
| Day Percent Change: -0.21% Day Change: -0.21 | |
| Week Change: -1.24% Year-to-date Change: -6.2% | |
| PNRG Links: Profile News Message Board | |
| Charts:- Daily , Weekly | |
| Add PNRG to Watchlist: View: Get Complete PNRG Trend Analysis ➞ | |
 | ABUS Arbutus Biopharma Corporation |
| Sector: Health Care | |
| SubSector: Biotechnology | |
| MarketCap: 110.885 Millions | |
| Recent Price: 2.69 Smart Investing & Trading Score: 43 | |
| Day Percent Change: 1.70% Day Change: 0.04 | |
| Week Change: -1.1% Year-to-date Change: 7.6% | |
| ABUS Links: Profile News Message Board | |
| Charts:- Daily , Weekly | |
| Add ABUS to Watchlist: View: Get Complete ABUS Trend Analysis ➞ | |
 | NR Newpark Resources, Inc. |
| Sector: Energy | |
| SubSector: Oil & Gas Equipment & Services | |
| MarketCap: 109.261 Millions | |
| Recent Price: 7.33 Smart Investing & Trading Score: 56 | |
| Day Percent Change: 0.41% Day Change: 0.03 | |
| Week Change: -0.81% Year-to-date Change: 10.4% | |
| NR Links: Profile News Message Board | |
| Charts:- Daily , Weekly | |
| Add NR to Watchlist: View: Get Complete NR Trend Analysis ➞ | |
 | SB Safe Bulkers, Inc. |
| Sector: Transports | |
| SubSector: Shipping | |
| MarketCap: 108.114 Millions | |
| Recent Price: 4.93 Smart Investing & Trading Score: 83 | |
| Day Percent Change: 1.23% Day Change: 0.06 | |
| Week Change: 2.49% Year-to-date Change: 25.5% | |
| SB Links: Profile News Message Board | |
| Charts:- Daily , Weekly | |
| Add SB to Watchlist: View: Get Complete SB Trend Analysis ➞ | |
 | UUUU Energy Fuels Inc. |
| Sector: Materials | |
| SubSector: Industrial Metals & Minerals | |
| MarketCap: 107.61 Millions | |
| Recent Price: 5.30 Smart Investing & Trading Score: 0 | |
| Day Percent Change: 0.00% Day Change: 0.00 | |
| Week Change: -9.25% Year-to-date Change: -26.3% | |
| UUUU Links: Profile News Message Board | |
| Charts:- Daily , Weekly | |
| Add UUUU to Watchlist: View: Get Complete UUUU Trend Analysis ➞ | |
 | OPRX OptimizeRx Corporation |
| Sector: Technology | |
| SubSector: Healthcare Information Services | |
| MarketCap: 107.155 Millions | |
| Recent Price: 8.94 Smart Investing & Trading Score: 17 | |
| Day Percent Change: -1.65% Day Change: -0.15 | |
| Week Change: -3.87% Year-to-date Change: -37.5% | |
| OPRX Links: Profile News Message Board | |
| Charts:- Daily , Weekly | |
| Add OPRX to Watchlist: View: Get Complete OPRX Trend Analysis ➞ | |
 | TWI Titan International, Inc. |
| Sector: Industrials | |
| SubSector: Farm & Construction Machinery | |
| MarketCap: 104.607 Millions | |
| Recent Price: 11.79 Smart Investing & Trading Score: 42 | |
| Day Percent Change: 1.99% Day Change: 0.23 | |
| Week Change: 2.25% Year-to-date Change: -20.8% | |
| TWI Links: Profile News Message Board | |
| Charts:- Daily , Weekly | |
| Add TWI to Watchlist: View: Get Complete TWI Trend Analysis ➞ | |
 | HROW Harrow Health, Inc. |
| Sector: Health Care | |
| SubSector: Drug Manufacturers - Other | |
| MarketCap: 104.033 Millions | |
| Recent Price: 10.32 Smart Investing & Trading Score: 46 | |
| Day Percent Change: -2.64% Day Change: -0.28 | |
| Week Change: -1.05% Year-to-date Change: -7.9% | |
| HROW Links: Profile News Message Board | |
| Charts:- Daily , Weekly | |
| Add HROW to Watchlist: View: Get Complete HROW Trend Analysis ➞ | |
 | ASUR Asure Software, Inc. |
| Sector: Technology | |
| SubSector: Business Software & Services | |
| MarketCap: 103.758 Millions | |
| Recent Price: 7.13 Smart Investing & Trading Score: 42 | |
| Day Percent Change: 3.18% Day Change: 0.22 | |
| Week Change: 2% Year-to-date Change: -25.1% | |
| ASUR Links: Profile News Message Board | |
| Charts:- Daily , Weekly | |
| Add ASUR to Watchlist: View: Get Complete ASUR Trend Analysis ➞ | |
| Too many stocks? View smallcap stocks filtered by marketcap & sector |
| Marketcap: All SmallCap Stocks (default-no microcap), Large, Mid-Range, Small & MicroCap |
| Sector: Tech, Finance, Energy, Staples, Retail, Industrial, Materials, Utilities & Medical |
|
Best Stocks Today 12Stocks.com |
© 2024 12Stocks.com Terms & Conditions Privacy Contact Us
All Information Provided Only For Education And Not To Be Used For Investing or Trading. See Terms & Conditions


One More Thing ... Get Best Stocks Delivered Daily!
Never Ever Miss A Move With Our Top Ten Stocks Lists
Find Best Stocks In Any Market - Bull or Bear Market
Take A Peek At Our Top Ten Stocks Lists: Daily, Weekly, Year-to-Date & Top Trends
Find Best Stocks In Any Market - Bull or Bear Market
Take A Peek At Our Top Ten Stocks Lists: Daily, Weekly, Year-to-Date & Top Trends
Smallcap Stocks With Best Up Trends [0-bearish to 100-bullish]: Hibbett Sports[100], Braemar Hotels[100], Akoustis [100], FTAI Infrastructure[100], Vertex Energy[100], AZZ [100], Day One[100], Oscar Health[100], Mueller Industries[100], ScanSource [100], Gannett Co[100]
Best Smallcap Stocks Year-to-Date:
Janux [364.03%], Viking [248.9%], Alpine Immune[239.02%], Longboard [231.75%], Avidity Biosciences[178.1%], Arcutis Bio[170.59%], Super Micro[168.02%], Vera [154.91%], Hippo [134.14%], Y-mAbs [124.93%], Stoke [113.88%] Best Smallcap Stocks This Week:
Matterport [164.37%], Seres [35.74%], Riot Blockchain[29.79%], Cipher Mining[25%], ProKidney [24.75%], Braemar Hotels[21.3%], Akoustis [21.29%], Hibbett Sports[21.1%], Assertio [19.28%], BigBear.ai [17.93%], Marathon Patent[17.82%] Best Smallcap Stocks Daily:
Virgin Galactic[22.38%], Seres [21.68%], Marathon Patent[20.04%], Hibbett Sports[18.84%], Generation Bio[16.01%], IGM Biosciences[14.07%], Braemar Hotels[12.96%], SES AI[12.17%], NuScale Power[11.16%], FuelCell Energy[10.86%], Cutera [10.82%]