
 Login Sign Up


| |||||
 |  | ||||

| 12Stocks.com Market Intelligence |
Best SmallCap Stocks
|
| In a hurry? Small Cap Stock Lists: Performance Trends Table, Stock Charts
Sort Small Cap stocks: Daily, Weekly, Year-to-Date, Market Cap & Trends. Filter Small Cap stocks list by sector: Show all, Tech, Finance, Energy, Staples, Retail, Industrial, Materials, Utilities and HealthCare Filter Small Cap stocks list by size: All Large Medium Small and MicroCap |
| 12Stocks.com Small Cap Stocks Performances & Trends Daily | |||||||||
|
|  The overall Smart Investing & Trading Score is 26 (0-bearish to 100-bullish) which puts Small Cap index in short term bearish to neutral trend. The Smart Investing & Trading Score from previous trading session is 31 and a deterioration of trend continues.
| ||||||||
Here are the Smart Investing & Trading Scores of the most requested small cap stocks at 12Stocks.com (click stock name for detailed review):
|


| 12Stocks.com: Investing in Smallcap Index with Stocks | |
|
The following table helps investors and traders sort through current performance and trends (as measured by Smart Investing & Trading Score) of various
stocks in the Smallcap Index. Quick View: Move mouse or cursor over stock symbol (ticker) to view short-term technical chart and over stock name to view long term chart. Click on  to add stock symbol to your watchlist and to add stock symbol to your watchlist and  to view watchlist. Click on any ticker or stock name for detailed market intelligence report for that stock. to view watchlist. Click on any ticker or stock name for detailed market intelligence report for that stock. |
12Stocks.com Performance of Stocks in Smallcap Index
| Ticker | Stock Name | Watchlist | Category | Recent Price | Smart Investing & Trading Score | Change % | YTD Change% |
| MIR | Mirion |   | Industrials | 10.45 | 41 | -0.19% | 1.85% |
| ATMU | Atmus Filtration | | Industrials | 32.15 | 54 | 0.09% | 37.57% |
| ZIP | ZipRecruiter | | Industrials | 10.30 | 5 | -2.28% | -26.51% |
| HLMN | Hillman Solutions | | Industrials | 9.68 | 41 | 0.47% | 4.65% |
| FSS | Federal Signal | | Industrials | 82.78 | 31 | -0.81% | 7.87% |
| ACA | Arcosa | | Industrials | 79.73 | 26 | -0.70% | -3.52% |
| PCT | PureCycle | | Industrials | 5.34 | 36 | 0.85% | 31.81% |
| MDC | M.D.C | | Industrials | 62.90 | 43 | 0.02% | 13.84% |
| AIN | Albany | | Industrials | 88.68 | 23 | -0.89% | -9.71% |
| SMR | NuScale Power | | Industrials | 5.00 | 46 | 2.99% | 54.88% |
| AVAV | AeroVironment | | Industrials | 148.00 | 46 | 1.29% | 17.42% |
| BDC | Belden | | Industrials | 84.58 | 36 | -0.26% | 9.49% |
| KMT | Kennametal | | Industrials | 23.79 | 10 | -0.34% | -7.75% |
| HLIO | Helios | | Industrials | 45.67 | 63 | -0.71% | 0.72% |
| FIX | Comfort Systems | | Industrials | 304.56 | 41 | 0.19% | 48.08% |
| MTH | Meritage Homes | | Industrials | 152.92 | 0 | -1.44% | -12.22% |
| SPXC | SPX | | Industrials | 119.07 | 31 | -0.09% | 17.88% |
| HI | Hillenbrand | | Industrials | 47.04 | 46 | -0.57% | -1.69% |
| CVCO | Cavco Industries | | Industrials | 360.56 | 31 | -2.67% | 4.02% |
| LNZA | LanzaTech Global | | Industrials | 3.10 | 10 | 4.03% | -37.31% |
| TMHC | Taylor Morrison | | Industrials | 54.47 | 26 | -2.15% | 2.09% |
| MWA | Mueller Water | | Industrials | 15.42 | 56 | 1.78% | 7.08% |
| IBP | Installed Building | | Industrials | 225.79 | 26 | -4.83% | 23.50% |
| MLI | Mueller Industries | | Industrials | 52.19 | 36 | 0.85% | 10.69% |
| KBH | KB Home | | Industrials | 61.92 | 26 | -1.93% | -0.86% |
| For chart view version of above stock list: Chart View ➞ 0 - 25 , 25 - 50 , 50 - 75 , 75 - 100 , 100 - 125 , 125 - 150 , 150 - 175 | ||
 | Click To Change The Sort Order: By Market Cap or Company Size Performance: Year-to-date, Week and Day |  |
| Too many stocks? View smallcap stocks filtered by marketcap & sector |
| Marketcap: All SmallCap Stocks (default-no microcap), Large, Mid-Range, Small |
| Smallcap Sector: Tech, Finance, Energy, Staples, Retail, Industrial, Materials, & Medical |
|
Get the most comprehensive stock market coverage daily at 12Stocks.com ➞ Best Stocks Today ➞ Best Stocks Weekly ➞ Best Stocks Year-to-Date ➞ Best Stocks Trends ➞  Best Stocks Today 12Stocks.com Best Nasdaq Stocks ➞ Best S&P 500 Stocks ➞ Best Tech Stocks ➞ Best Biotech Stocks ➞ |
| Detailed Overview of SmallCap Stocks |
| SmallCap Technical Overview, Leaders & Laggards, Top SmallCap ETF Funds & Detailed SmallCap Stocks List, Charts, Trends & More |
| Smallcap: Technical Analysis, Trends & YTD Performance | |
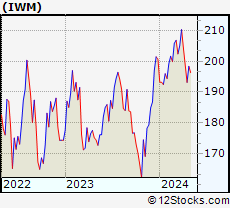
| SmallCap segment as represented by
IWM, an exchange-traded fund [ETF], holds basket of thousands of smallcap stocks from across all major sectors of the US stock market. The smallcap index (contains stocks like Riverbed & Sotheby's) is down by -2.84% and is currently underperforming the overall market by -7.97% year-to-date. Below is a quick view of technical charts and trends: | |
 IWM Weekly Chart |
|
| Long Term Trend: Good | |
| Medium Term Trend: Not Good | |
 IWM Daily Chart |
|
| Short Term Trend: Not Good | |
| Overall Trend Score: 26 | |
| YTD Performance: -2.84% | |
| **Trend Scores & Views Are Only For Educational Purposes And Not For Investing | |
| 12Stocks.com: Top Performing Small Cap Index Stocks | ||||||||||||||||||||||||||||||||||||||||||||||||
 The top performing Small Cap Index stocks year to date are
Now, more recently, over last week, the top performing Small Cap Index stocks on the move are


|
||||||||||||||||||||||||||||||||||||||||||||||||
| 12Stocks.com: Investing in Smallcap Index using Exchange Traded Funds | |
|
The following table shows list of key exchange traded funds (ETF) that
help investors track Smallcap index. The following list also includes leveraged ETF funds that track twice or thrice the daily returns of Smallcap indices. Short or inverse ETF funds move in the opposite direction to the index they track and are useful during market pullbacks or during bear markets. Quick View: Move mouse or cursor over ETF symbol (ticker) to view short-term technical chart and over ETF name to view long term chart. Click on ticker or stock name for detailed view. Click on to add stock symbol to your watchlist and to view watchlist. |
12Stocks.com List of ETFs that track Smallcap Index
| Ticker | ETF Name | Watchlist | Recent Price | Smart Investing & Trading Score | Change % | Week % | Year-to-date % |
| IWM | iShares Russell 2000 | | 195.01 | 26 | -0.40 | -1.85 | -2.84% |
| IJR | iShares Core S&P Small-Cap | | 102.72 | 0 | -0.79 | -1.71 | -5.1% |
| VTWO | Vanguard Russell 2000 ETF | | 78.70 | 26 | -0.67 | -2.02 | -2.96% |
| IWN | iShares Russell 2000 Value | | 147.16 | 13 | -0.97 | -2.14 | -5.26% |
| IWO | iShares Russell 2000 Growth | | 250.26 | 26 | -0.31 | -2 | -0.78% |
| IJS | iShares S&P Small-Cap 600 Value | | 94.41 | 0 | -0.83 | -1.83 | -8.4% |
| IJT | iShares S&P Small-Cap 600 Growth | | 122.23 | 13 | -1.04 | -2.04 | -2.33% |
| SBB | ProShares Short SmallCap600 | | 16.84 | 100 | 2.62 | 1.77 | 5.71% |
| SDD | ProShares UltraShort SmallCap600 | | 20.23 | 100 | 0.00 | 2.01 | 9.79% |
| SAA | ProShares Ultra SmallCap600 | | 21.81 | 0 | -2.76 | -3.33 | -12.59% |
| SMLV | SPDR SSGA US Small Cap Low Volatil ETF | | 103.84 | 0 | -0.85 | -1.12 | -7.71% |
| XSLV | PowerShares S&P SmallCap Low Volatil ETF | | 41.62 | 0 | -0.63 | -1.13 | -5.74% |
| 12Stocks.com: Charts, Trends, Fundamental Data and Performances of SmallCap Stocks | |
|
We now take in-depth look at all SmallCap stocks including charts, multi-period performances and overall trends (as measured by Smart Investing & Trading Score). One can sort SmallCap stocks (click link to choose) by Daily, Weekly and by Year-to-Date performances. Also, one can sort by size of the company or by market capitalization. |
| Select Your Default Chart Type: | |||||
| |||||
| Click on stock symbol or name for detailed view. Click on to add stock symbol to your watchlist and to view watchlist. Quick View: Move mouse or cursor over "Daily" to quickly view daily technical stock chart and over "Weekly" to view weekly technical stock chart. | |||||

 | MIR Mirion Technologies, Inc. |
| Sector: Industrials | |
| SubSector: Specialty Industrial Machinery | |
| MarketCap: 1920 Millions | |
| Recent Price: 10.45 Smart Investing & Trading Score: 41 | |
| Day Percent Change: -0.19% Day Change: -0.02 | |
| Week Change: -2.34% Year-to-date Change: 1.9% | |
| MIR Links: Profile News Message Board | |
| Charts:- Daily , Weekly | |
| Add MIR to Watchlist: View: Get Complete MIR Trend Analysis ➞ | |
 | ATMU Atmus Filtration Technologies Inc. |
| Sector: Industrials | |
| SubSector: Pollution & Treatment Controls | |
| MarketCap: 1830 Millions | |
| Recent Price: 32.15 Smart Investing & Trading Score: 54 | |
| Day Percent Change: 0.09% Day Change: 0.03 | |
| Week Change: 0.56% Year-to-date Change: 37.6% | |
| ATMU Links: Profile News Message Board | |
| Charts:- Daily , Weekly | |
| Add ATMU to Watchlist: View: Get Complete ATMU Trend Analysis ➞ | |
 | ZIP ZipRecruiter, Inc. |
| Sector: Industrials | |
| SubSector: Staffing & Employment Services | |
| MarketCap: 1730 Millions | |
| Recent Price: 10.30 Smart Investing & Trading Score: 5 | |
| Day Percent Change: -2.28% Day Change: -0.24 | |
| Week Change: -7.95% Year-to-date Change: -26.5% | |
| ZIP Links: Profile News Message Board | |
| Charts:- Daily , Weekly | |
| Add ZIP to Watchlist: View: Get Complete ZIP Trend Analysis ➞ | |
 | HLMN Hillman Solutions Corp. |
| Sector: Industrials | |
| SubSector: Tools & Accessories | |
| MarketCap: 1720 Millions | |
| Recent Price: 9.68 Smart Investing & Trading Score: 41 | |
| Day Percent Change: 0.47% Day Change: 0.04 | |
| Week Change: -1.68% Year-to-date Change: 4.7% | |
| HLMN Links: Profile News Message Board | |
| Charts:- Daily , Weekly | |
| Add HLMN to Watchlist: View: Get Complete HLMN Trend Analysis ➞ | |
 | FSS Federal Signal Corporation |
| Sector: Industrials | |
| SubSector: Pollution & Treatment Controls | |
| MarketCap: 1694.05 Millions | |
| Recent Price: 82.78 Smart Investing & Trading Score: 31 | |
| Day Percent Change: -0.81% Day Change: -0.68 | |
| Week Change: -0.92% Year-to-date Change: 7.9% | |
| FSS Links: Profile News Message Board | |
| Charts:- Daily , Weekly | |
| Add FSS to Watchlist: View: Get Complete FSS Trend Analysis ➞ | |
 | ACA Arcosa, Inc. |
| Sector: Industrials | |
| SubSector: Farm & Construction Machinery | |
| MarketCap: 1692.57 Millions | |
| Recent Price: 79.73 Smart Investing & Trading Score: 26 | |
| Day Percent Change: -0.70% Day Change: -0.56 | |
| Week Change: -1.05% Year-to-date Change: -3.5% | |
| ACA Links: Profile News Message Board | |
| Charts:- Daily , Weekly | |
| Add ACA to Watchlist: View: Get Complete ACA Trend Analysis ➞ | |
 | PCT PureCycle Technologies, Inc. |
| Sector: Industrials | |
| SubSector: Pollution & Treatment Controls | |
| MarketCap: 1610 Millions | |
| Recent Price: 5.34 Smart Investing & Trading Score: 36 | |
| Day Percent Change: 0.85% Day Change: 0.04 | |
| Week Change: -5.73% Year-to-date Change: 31.8% | |
| PCT Links: Profile News Message Board | |
| Charts:- Daily , Weekly | |
| Add PCT to Watchlist: View: Get Complete PCT Trend Analysis ➞ | |
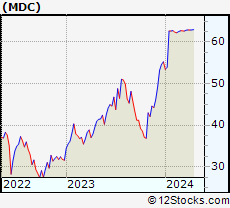 | MDC M.D.C. Holdings, Inc. |
| Sector: Industrials | |
| SubSector: Residential Construction | |
| MarketCap: 1606.26 Millions | |
| Recent Price: 62.90 Smart Investing & Trading Score: 43 | |
| Day Percent Change: 0.02% Day Change: 0.02 | |
| Week Change: -0.02% Year-to-date Change: 13.8% | |
| MDC Links: Profile News Message Board | |
| Charts:- Daily , Weekly | |
| Add MDC to Watchlist: View: Get Complete MDC Trend Analysis ➞ | |
 | AIN Albany International Corp. |
| Sector: Industrials | |
| SubSector: Textile Industrial | |
| MarketCap: 1538.4 Millions | |
| Recent Price: 88.68 Smart Investing & Trading Score: 23 | |
| Day Percent Change: -0.89% Day Change: -0.80 | |
| Week Change: -0.96% Year-to-date Change: -9.7% | |
| AIN Links: Profile News Message Board | |
| Charts:- Daily , Weekly | |
| Add AIN to Watchlist: View: Get Complete AIN Trend Analysis ➞ | |
 | SMR NuScale Power Corporation |
| Sector: Industrials | |
| SubSector: Specialty Industrial Machinery | |
| MarketCap: 1510 Millions | |
| Recent Price: 5.00 Smart Investing & Trading Score: 46 | |
| Day Percent Change: 2.99% Day Change: 0.15 | |
| Week Change: -5.22% Year-to-date Change: 54.9% | |
| SMR Links: Profile News Message Board | |
| Charts:- Daily , Weekly | |
| Add SMR to Watchlist: View: Get Complete SMR Trend Analysis ➞ | |
 | AVAV AeroVironment, Inc. |
| Sector: Industrials | |
| SubSector: Aerospace/Defense Products & Services | |
| MarketCap: 1502.41 Millions | |
| Recent Price: 148.00 Smart Investing & Trading Score: 46 | |
| Day Percent Change: 1.29% Day Change: 1.88 | |
| Week Change: 0.6% Year-to-date Change: 17.4% | |
| AVAV Links: Profile News Message Board | |
| Charts:- Daily , Weekly | |
| Add AVAV to Watchlist: View: Get Complete AVAV Trend Analysis ➞ | |
 | BDC Belden Inc. |
| Sector: Industrials | |
| SubSector: Industrial Electrical Equipment | |
| MarketCap: 1490.59 Millions | |
| Recent Price: 84.58 Smart Investing & Trading Score: 36 | |
| Day Percent Change: -0.26% Day Change: -0.22 | |
| Week Change: -0.8% Year-to-date Change: 9.5% | |
| BDC Links: Profile News Message Board | |
| Charts:- Daily , Weekly | |
| Add BDC to Watchlist: View: Get Complete BDC Trend Analysis ➞ | |
 | KMT Kennametal Inc. |
| Sector: Industrials | |
| SubSector: Machine Tools & Accessories | |
| MarketCap: 1486.48 Millions | |
| Recent Price: 23.79 Smart Investing & Trading Score: 10 | |
| Day Percent Change: -0.34% Day Change: -0.08 | |
| Week Change: 1.23% Year-to-date Change: -7.8% | |
| KMT Links: Profile News Message Board | |
| Charts:- Daily , Weekly | |
| Add KMT to Watchlist: View: Get Complete KMT Trend Analysis ➞ | |
 | HLIO Helios Technologies, Inc. |
| Sector: Industrials | |
| SubSector: Diversified Machinery | |
| MarketCap: 1455.66 Millions | |
| Recent Price: 45.67 Smart Investing & Trading Score: 63 | |
| Day Percent Change: -0.71% Day Change: -0.33 | |
| Week Change: -0.99% Year-to-date Change: 0.7% | |
| HLIO Links: Profile News Message Board | |
| Charts:- Daily , Weekly | |
| Add HLIO to Watchlist: View: Get Complete HLIO Trend Analysis ➞ | |
 | FIX Comfort Systems USA, Inc. |
| Sector: Industrials | |
| SubSector: General Contractors | |
| MarketCap: 1440.63 Millions | |
| Recent Price: 304.56 Smart Investing & Trading Score: 41 | |
| Day Percent Change: 0.19% Day Change: 0.56 | |
| Week Change: -0.98% Year-to-date Change: 48.1% | |
| FIX Links: Profile News Message Board | |
| Charts:- Daily , Weekly | |
| Add FIX to Watchlist: View: Get Complete FIX Trend Analysis ➞ | |
 | MTH Meritage Homes Corporation |
| Sector: Industrials | |
| SubSector: Residential Construction | |
| MarketCap: 1440.36 Millions | |
| Recent Price: 152.92 Smart Investing & Trading Score: 0 | |
| Day Percent Change: -1.44% Day Change: -2.24 | |
| Week Change: -3.9% Year-to-date Change: -12.2% | |
| MTH Links: Profile News Message Board | |
| Charts:- Daily , Weekly | |
| Add MTH to Watchlist: View: Get Complete MTH Trend Analysis ➞ | |
 | SPXC SPX Corporation |
| Sector: Industrials | |
| SubSector: Diversified Machinery | |
| MarketCap: 1415.56 Millions | |
| Recent Price: 119.07 Smart Investing & Trading Score: 31 | |
| Day Percent Change: -0.09% Day Change: -0.11 | |
| Week Change: -1.4% Year-to-date Change: 17.9% | |
| SPXC Links: Profile News Message Board | |
| Charts:- Daily , Weekly | |
| Add SPXC to Watchlist: View: Get Complete SPXC Trend Analysis ➞ | |
 | HI Hillenbrand, Inc. |
| Sector: Industrials | |
| SubSector: Diversified Machinery | |
| MarketCap: 1389.86 Millions | |
| Recent Price: 47.04 Smart Investing & Trading Score: 46 | |
| Day Percent Change: -0.57% Day Change: -0.27 | |
| Week Change: 0.43% Year-to-date Change: -1.7% | |
| HI Links: Profile News Message Board | |
| Charts:- Daily , Weekly | |
| Add HI to Watchlist: View: Get Complete HI Trend Analysis ➞ | |
 | CVCO Cavco Industries, Inc. |
| Sector: Industrials | |
| SubSector: Residential Construction | |
| MarketCap: 1375.86 Millions | |
| Recent Price: 360.56 Smart Investing & Trading Score: 31 | |
| Day Percent Change: -2.67% Day Change: -9.88 | |
| Week Change: -4.17% Year-to-date Change: 4.0% | |
| CVCO Links: Profile News Message Board | |
| Charts:- Daily , Weekly | |
| Add CVCO to Watchlist: View: Get Complete CVCO Trend Analysis ➞ | |
 | LNZA LanzaTech Global, Inc. |
| Sector: Industrials | |
| SubSector: Waste Management | |
| MarketCap: 1340 Millions | |
| Recent Price: 3.10 Smart Investing & Trading Score: 10 | |
| Day Percent Change: 4.03% Day Change: 0.12 | |
| Week Change: 0% Year-to-date Change: -37.3% | |
| LNZA Links: Profile News Message Board | |
| Charts:- Daily , Weekly | |
| Add LNZA to Watchlist: View: Get Complete LNZA Trend Analysis ➞ | |
 | TMHC Taylor Morrison Home Corporation |
| Sector: Industrials | |
| SubSector: Residential Construction | |
| MarketCap: 1336.76 Millions | |
| Recent Price: 54.47 Smart Investing & Trading Score: 26 | |
| Day Percent Change: -2.15% Day Change: -1.19 | |
| Week Change: -4.09% Year-to-date Change: 2.1% | |
| TMHC Links: Profile News Message Board | |
| Charts:- Daily , Weekly | |
| Add TMHC to Watchlist: View: Get Complete TMHC Trend Analysis ➞ | |
 | MWA Mueller Water Products, Inc. |
| Sector: Industrials | |
| SubSector: Industrial Equipment & Components | |
| MarketCap: 1321.09 Millions | |
| Recent Price: 15.42 Smart Investing & Trading Score: 56 | |
| Day Percent Change: 1.78% Day Change: 0.27 | |
| Week Change: 1.65% Year-to-date Change: 7.1% | |
| MWA Links: Profile News Message Board | |
| Charts:- Daily , Weekly | |
| Add MWA to Watchlist: View: Get Complete MWA Trend Analysis ➞ | |
 | IBP Installed Building Products, Inc. |
| Sector: Industrials | |
| SubSector: General Building Materials | |
| MarketCap: 1284.23 Millions | |
| Recent Price: 225.79 Smart Investing & Trading Score: 26 | |
| Day Percent Change: -4.83% Day Change: -11.46 | |
| Week Change: -6.22% Year-to-date Change: 23.5% | |
| IBP Links: Profile News Message Board | |
| Charts:- Daily , Weekly | |
| Add IBP to Watchlist: View: Get Complete IBP Trend Analysis ➞ | |
 | MLI Mueller Industries, Inc. |
| Sector: Industrials | |
| SubSector: Metal Fabrication | |
| MarketCap: 1259.5 Millions | |
| Recent Price: 52.19 Smart Investing & Trading Score: 36 | |
| Day Percent Change: 0.85% Day Change: 0.44 | |
| Week Change: 0.91% Year-to-date Change: 10.7% | |
| MLI Links: Profile News Message Board | |
| Charts:- Daily , Weekly | |
| Add MLI to Watchlist: View: Get Complete MLI Trend Analysis ➞ | |
 | KBH KB Home |
| Sector: Industrials | |
| SubSector: Residential Construction | |
| MarketCap: 1249.66 Millions | |
| Recent Price: 61.92 Smart Investing & Trading Score: 26 | |
| Day Percent Change: -1.93% Day Change: -1.22 | |
| Week Change: -3.4% Year-to-date Change: -0.9% | |
| KBH Links: Profile News Message Board | |
| Charts:- Daily , Weekly | |
| Add KBH to Watchlist: View: Get Complete KBH Trend Analysis ➞ | |
| For tabular summary view of above stock list: Summary View ➞ 0 - 25 , 25 - 50 , 50 - 75 , 75 - 100 , 100 - 125 , 125 - 150 , 150 - 175 | ||
| Click To Change The Sort Order: By Market Cap or Company Size Performance: Year-to-date, Week and Day | |
| Select Chart Type: | ||
| Too many stocks? View smallcap stocks filtered by marketcap & sector |
| Marketcap: All SmallCap Stocks (default-no microcap), Large, Mid-Range, Small & MicroCap |
| Sector: Tech, Finance, Energy, Staples, Retail, Industrial, Materials, Utilities & Medical |
|
Best Stocks Today 12Stocks.com |
© 2024 12Stocks.com Terms & Conditions Privacy Contact Us
All Information Provided Only For Education And Not To Be Used For Investing or Trading. See Terms & Conditions


One More Thing ... Get Best Stocks Delivered Daily!
Never Ever Miss A Move With Our Top Ten Stocks Lists
Find Best Stocks In Any Market - Bull or Bear Market
Take A Peek At Our Top Ten Stocks Lists: Daily, Weekly, Year-to-Date & Top Trends
Find Best Stocks In Any Market - Bull or Bear Market
Take A Peek At Our Top Ten Stocks Lists: Daily, Weekly, Year-to-Date & Top Trends
Smallcap Stocks With Best Up Trends [0-bearish to 100-bullish]: Macatawa Bank[100], Intra-Cellular Therapies[100], ProKidney [100], Warrior Met[100], IMAX [100], Argan [100], Boot Barn[100], Encore Wire[100], Core Molding[100], Oscar Health[95], Mercury General[95]
Best Smallcap Stocks Year-to-Date:
CareMax [510.31%], Janux [374.64%], Viking [259.22%], Alpine Immune[238.39%], Super Micro[230.09%], Arcutis Bio[210.99%], Longboard [199.1%], Vera [179.91%], Avidity Biosciences[164.6%], Veritone [153.02%], Stoke [140.02%] Best Smallcap Stocks This Week:
Macatawa Bank[43.01%], ProKidney [41.71%], Snap One[29.3%], Intra-Cellular Therapies[21.25%], Encore Wire[11.1%], Piedmont Lithium[8.12%], Envestnet [8.12%], Warrior Met[7.61%], United Homes[7.32%], NextNav [7.22%], Avid Bioservices[6.97%] Best Smallcap Stocks Daily:
Macatawa Bank[38.12%], Intra-Cellular Therapies[23.35%], System1 [20.59%], ProKidney [18.66%], NextNav [12.62%], Envestnet [9.57%], Allbirds [9.40%], Nuvectis Pharma[8.11%], ALX Oncology[7.68%], Big Lots[7.14%], Warrior Met[7.08%]