
 Login Sign Up


| |||||
 |  | ||||

| 12Stocks.com Market Intelligence |
Best SmallCap Stocks
|
| In a hurry? Small Cap Stock Lists: Performance Trends Table, Stock Charts
Sort Small Cap stocks: Daily, Weekly, Year-to-Date, Market Cap & Trends. Filter Small Cap stocks list by sector: Show all, Tech, Finance, Energy, Staples, Retail, Industrial, Materials, Utilities and HealthCare Filter Small Cap stocks list by size: All Large Medium Small and MicroCap |
| 12Stocks.com Small Cap Stocks Performances & Trends Daily | |||||||||
|
|  The overall Smart Investing & Trading Score is 23 (0-bearish to 100-bullish) which puts Small Cap index in short term bearish to neutral trend. The Smart Investing & Trading Score from previous trading session is 13 and hence an improvement of trend.
| ||||||||
Here are the Smart Investing & Trading Scores of the most requested small cap stocks at 12Stocks.com (click stock name for detailed review):
|


| 12Stocks.com: Investing in Smallcap Index with Stocks | |
|
The following table helps investors and traders sort through current performance and trends (as measured by Smart Investing & Trading Score) of various
stocks in the Smallcap Index. Quick View: Move mouse or cursor over stock symbol (ticker) to view short-term technical chart and over stock name to view long term chart. Click on  to add stock symbol to your watchlist and to add stock symbol to your watchlist and  to view watchlist. Click on any ticker or stock name for detailed market intelligence report for that stock. to view watchlist. Click on any ticker or stock name for detailed market intelligence report for that stock. |
12Stocks.com Performance of Stocks in Smallcap Index
| Ticker | Stock Name | Watchlist | Category | Recent Price | Smart Investing & Trading Score | Change % | YTD Change% |
| TGI | Triumph Group |   | Industrials | 12.94 | 0 | -0.54% | -21.95% |
| FCEL | FuelCell Energy | | Industrials | 0.95 | 10 | -5.19% | -40.74% |
| WTTR | Select Energy | | Industrials | 9.05 | 53 | 0.78% | 19.24% |
| NX | Quanex Building | | Industrials | 34.24 | 36 | -0.75% | 12.01% |
| LEGH | Legacy Housing | | Industrials | 19.61 | 0 | -0.86% | -22.24% |
| ATRO | Astronics | | Industrials | 16.00 | 10 | -0.74% | -8.15% |
| BBCP | Concrete Pumping | | Industrials | 6.60 | 10 | -3.79% | -19.51% |
| DCO | Ducommun | | Industrials | 51.85 | 51 | 0.72% | -0.40% |
| POWL | Powell Industries | | Industrials | 128.16 | 58 | 3.82% | 44.98% |
| HAYN | Haynes | | Industrials | 60.36 | 58 | -0.12% | 5.80% |
| GWH | ESS Tech | | Industrials | 0.66 | 47 | -0.12% | -41.98% |
| STRL | Sterling Construction | | Industrials | 98.35 | 44 | -1.76% | 11.85% |
| PLPC | Preformed Line | | Industrials | 121.11 | 0 | -1.15% | -9.52% |
| TH | Target Hospitality | | Industrials | 10.88 | 58 | 2.26% | 11.82% |
| LLAP | Terran Orbital | | Industrials | 1.35 | 71 | -6.90% | 17.90% |
| RYI | Ryerson Holding | | Industrials | 31.85 | 10 | -0.31% | -8.16% |
| RYI | Ryerson Holding | | Industrials | 9.45 | 10 | 0.64% | -8.16% |
| BZH | Beazer Homes | | Industrials | 25.79 | 17 | -1.04% | -23.68% |
| HSHP | Himalaya Shipping | | Industrials | 7.70 | 76 | -1.41% | 14.07% |
| RDW | Redwire | | Industrials | 3.57 | 63 | 4.69% | 25.26% |
| ASPN | Aspen Aerogels | | Industrials | 14.88 | 49 | -1.26% | -5.70% |
| GENC | Gencor Industries | | Industrials | 16.78 | 51 | -0.12% | 3.97% |
| MEC | Mayville Engineering | | Industrials | 13.55 | 54 | 1.19% | -6.03% |
| PRTH | Priority | | Industrials | 3.18 | 27 | 0.63% | -10.67% |
| TWI | Titan | | Industrials | 11.42 | 20 | -0.26% | -23.25% |
| For chart view version of above stock list: Chart View ➞ 0 - 25 , 25 - 50 , 50 - 75 , 75 - 100 , 100 - 125 , 125 - 150 , 150 - 175 | ||
 | Click To Change The Sort Order: By Market Cap or Company Size Performance: Year-to-date, Week and Day |  |
| Too many stocks? View smallcap stocks filtered by marketcap & sector |
| Marketcap: All SmallCap Stocks (default-no microcap), Large, Mid-Range, Small |
| Smallcap Sector: Tech, Finance, Energy, Staples, Retail, Industrial, Materials, & Medical |
|
Get the most comprehensive stock market coverage daily at 12Stocks.com ➞ Best Stocks Today ➞ Best Stocks Weekly ➞ Best Stocks Year-to-Date ➞ Best Stocks Trends ➞  Best Stocks Today 12Stocks.com Best Nasdaq Stocks ➞ Best S&P 500 Stocks ➞ Best Tech Stocks ➞ Best Biotech Stocks ➞ |
| Detailed Overview of SmallCap Stocks |
| SmallCap Technical Overview, Leaders & Laggards, Top SmallCap ETF Funds & Detailed SmallCap Stocks List, Charts, Trends & More |
| Smallcap: Technical Analysis, Trends & YTD Performance | |
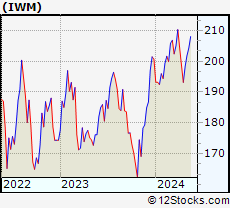
| SmallCap segment as represented by
IWM, an exchange-traded fund [ETF], holds basket of thousands of smallcap stocks from across all major sectors of the US stock market. The smallcap index (contains stocks like Riverbed & Sotheby's) is down by -3.92% and is currently underperforming the overall market by -8.11% year-to-date. Below is a quick view of technical charts and trends: | |
 IWM Weekly Chart |
|
| Long Term Trend: Not Good | |
| Medium Term Trend: Not Good | |
 IWM Daily Chart |
|
| Short Term Trend: Not Good | |
| Overall Trend Score: 23 | |
| YTD Performance: -3.92% | |
| **Trend Scores & Views Are Only For Educational Purposes And Not For Investing | |
| 12Stocks.com: Top Performing Small Cap Index Stocks | ||||||||||||||||||||||||||||||||||||||||||||||||
 The top performing Small Cap Index stocks year to date are
Now, more recently, over last week, the top performing Small Cap Index stocks on the move are


|
||||||||||||||||||||||||||||||||||||||||||||||||
| 12Stocks.com: Investing in Smallcap Index using Exchange Traded Funds | |
|
The following table shows list of key exchange traded funds (ETF) that
help investors track Smallcap index. The following list also includes leveraged ETF funds that track twice or thrice the daily returns of Smallcap indices. Short or inverse ETF funds move in the opposite direction to the index they track and are useful during market pullbacks or during bear markets. Quick View: Move mouse or cursor over ETF symbol (ticker) to view short-term technical chart and over ETF name to view long term chart. Click on ticker or stock name for detailed view. Click on to add stock symbol to your watchlist and to view watchlist. |
12Stocks.com List of ETFs that track Smallcap Index
| Ticker | ETF Name | Watchlist | Recent Price | Smart Investing & Trading Score | Change % | Week % | Year-to-date % |
| IWM | iShares Russell 2000 | | 192.84 | 23 | -0.08 | -2.94 | -3.92% |
| IJR | iShares Core S&P Small-Cap | | 102.34 | 31 | 0.21 | -2.08 | -5.46% |
| VTWO | Vanguard Russell 2000 ETF | | 77.94 | 23 | -0.14 | -2.96 | -3.9% |
| IWN | iShares Russell 2000 Value | | 146.33 | 10 | 0.21 | -2.69 | -5.79% |
| IJS | iShares S&P Small-Cap 600 Value | | 94.51 | 10 | 0.41 | -1.73 | -8.31% |
| IWO | iShares Russell 2000 Growth | | 246.94 | 36 | -0.44 | -3.3 | -2.09% |
| IJT | iShares S&P Small-Cap 600 Growth | | 121.59 | 23 | -0.21 | -2.56 | -2.84% |
| XSLV | PowerShares S&P SmallCap Low Volatil ETF | | 41.65 | 25 | 0.56 | -1.05 | -5.66% |
| SAA | ProShares Ultra SmallCap600 | | 21.62 | 10 | -0.18 | -4.17 | -13.35% |
| SMLV | SPDR SSGA US Small Cap Low Volatil ETF | | 103.83 | 18 | 0.16 | -1.13 | -7.72% |
| SBB | ProShares Short SmallCap600 | | 16.77 | 80 | -0.50 | 1.32 | 5.24% |
| SDD | ProShares UltraShort SmallCap600 | | 20.16 | 73 | -2.14 | 1.66 | 9.41% |
| 12Stocks.com: Charts, Trends, Fundamental Data and Performances of SmallCap Stocks | |
|
We now take in-depth look at all SmallCap stocks including charts, multi-period performances and overall trends (as measured by Smart Investing & Trading Score). One can sort SmallCap stocks (click link to choose) by Daily, Weekly and by Year-to-Date performances. Also, one can sort by size of the company or by market capitalization. |
| Select Your Default Chart Type: | |||||
| |||||
| Click on stock symbol or name for detailed view. Click on to add stock symbol to your watchlist and to view watchlist. Quick View: Move mouse or cursor over "Daily" to quickly view daily technical stock chart and over "Weekly" to view weekly technical stock chart. | |||||

 | TGI Triumph Group, Inc. |
| Sector: Industrials | |
| SubSector: Aerospace/Defense Products & Services | |
| MarketCap: 358.901 Millions | |
| Recent Price: 12.94 Smart Investing & Trading Score: 0 | |
| Day Percent Change: -0.54% Day Change: -0.07 | |
| Week Change: -4.71% Year-to-date Change: -22.0% | |
| TGI Links: Profile News Message Board | |
| Charts:- Daily , Weekly | |
| Add TGI to Watchlist: View: Get Complete TGI Trend Analysis ➞ | |
 | FCEL FuelCell Energy, Inc. |
| Sector: Industrials | |
| SubSector: Industrial Electrical Equipment | |
| MarketCap: 347.079 Millions | |
| Recent Price: 0.95 Smart Investing & Trading Score: 10 | |
| Day Percent Change: -5.19% Day Change: -0.05 | |
| Week Change: -13.81% Year-to-date Change: -40.7% | |
| FCEL Links: Profile News Message Board | |
| Charts:- Daily , Weekly | |
| Add FCEL to Watchlist: View: Get Complete FCEL Trend Analysis ➞ | |
 | WTTR Select Energy Services, Inc. |
| Sector: Industrials | |
| SubSector: Pollution & Treatment Controls | |
| MarketCap: 347.075 Millions | |
| Recent Price: 9.05 Smart Investing & Trading Score: 53 | |
| Day Percent Change: 0.78% Day Change: 0.07 | |
| Week Change: -1.63% Year-to-date Change: 19.2% | |
| WTTR Links: Profile News Message Board | |
| Charts:- Daily , Weekly | |
| Add WTTR to Watchlist: View: Get Complete WTTR Trend Analysis ➞ | |
 | NX Quanex Building Products Corporation |
| Sector: Industrials | |
| SubSector: General Building Materials | |
| MarketCap: 315.453 Millions | |
| Recent Price: 34.24 Smart Investing & Trading Score: 36 | |
| Day Percent Change: -0.75% Day Change: -0.26 | |
| Week Change: -4.54% Year-to-date Change: 12.0% | |
| NX Links: Profile News Message Board | |
| Charts:- Daily , Weekly | |
| Add NX to Watchlist: View: Get Complete NX Trend Analysis ➞ | |
 | LEGH Legacy Housing Corporation |
| Sector: Industrials | |
| SubSector: Residential Construction | |
| MarketCap: 298.006 Millions | |
| Recent Price: 19.61 Smart Investing & Trading Score: 0 | |
| Day Percent Change: -0.86% Day Change: -0.17 | |
| Week Change: -3.54% Year-to-date Change: -22.2% | |
| LEGH Links: Profile News Message Board | |
| Charts:- Daily , Weekly | |
| Add LEGH to Watchlist: View: Get Complete LEGH Trend Analysis ➞ | |
 | ATRO Astronics Corporation |
| Sector: Industrials | |
| SubSector: Aerospace/Defense Products & Services | |
| MarketCap: 287.201 Millions | |
| Recent Price: 16.00 Smart Investing & Trading Score: 10 | |
| Day Percent Change: -0.74% Day Change: -0.12 | |
| Week Change: -5.94% Year-to-date Change: -8.2% | |
| ATRO Links: Profile News Message Board | |
| Charts:- Daily , Weekly | |
| Add ATRO to Watchlist: View: Get Complete ATRO Trend Analysis ➞ | |
 | BBCP Concrete Pumping Holdings, Inc. |
| Sector: Industrials | |
| SubSector: General Building Materials | |
| MarketCap: 263.653 Millions | |
| Recent Price: 6.60 Smart Investing & Trading Score: 10 | |
| Day Percent Change: -3.79% Day Change: -0.26 | |
| Week Change: -9.22% Year-to-date Change: -19.5% | |
| BBCP Links: Profile News Message Board | |
| Charts:- Daily , Weekly | |
| Add BBCP to Watchlist: View: Get Complete BBCP Trend Analysis ➞ | |
 | DCO Ducommun Incorporated |
| Sector: Industrials | |
| SubSector: Aerospace/Defense Products & Services | |
| MarketCap: 261.101 Millions | |
| Recent Price: 51.85 Smart Investing & Trading Score: 51 | |
| Day Percent Change: 0.72% Day Change: 0.37 | |
| Week Change: -5.45% Year-to-date Change: -0.4% | |
| DCO Links: Profile News Message Board | |
| Charts:- Daily , Weekly | |
| Add DCO to Watchlist: View: Get Complete DCO Trend Analysis ➞ | |
 | POWL Powell Industries, Inc. |
| Sector: Industrials | |
| SubSector: Diversified Machinery | |
| MarketCap: 257.216 Millions | |
| Recent Price: 128.16 Smart Investing & Trading Score: 58 | |
| Day Percent Change: 3.82% Day Change: 4.72 | |
| Week Change: 1.75% Year-to-date Change: 45.0% | |
| POWL Links: Profile News Message Board | |
| Charts:- Daily , Weekly | |
| Add POWL to Watchlist: View: Get Complete POWL Trend Analysis ➞ | |
 | HAYN Haynes International, Inc. |
| Sector: Industrials | |
| SubSector: Metal Fabrication | |
| MarketCap: 245.75 Millions | |
| Recent Price: 60.36 Smart Investing & Trading Score: 58 | |
| Day Percent Change: -0.12% Day Change: -0.07 | |
| Week Change: -0.49% Year-to-date Change: 5.8% | |
| HAYN Links: Profile News Message Board | |
| Charts:- Daily , Weekly | |
| Add HAYN to Watchlist: View: Get Complete HAYN Trend Analysis ➞ | |
 | GWH ESS Tech, Inc. |
| Sector: Industrials | |
| SubSector: Electrical Equipment & Parts | |
| MarketCap: 239 Millions | |
| Recent Price: 0.66 Smart Investing & Trading Score: 47 | |
| Day Percent Change: -0.12% Day Change: 0.00 | |
| Week Change: -1.37% Year-to-date Change: -42.0% | |
| GWH Links: Profile News Message Board | |
| Charts:- Daily , Weekly | |
| Add GWH to Watchlist: View: Get Complete GWH Trend Analysis ➞ | |
 | STRL Sterling Construction Company, Inc. |
| Sector: Industrials | |
| SubSector: Heavy Construction | |
| MarketCap: 237.395 Millions | |
| Recent Price: 98.35 Smart Investing & Trading Score: 44 | |
| Day Percent Change: -1.76% Day Change: -1.76 | |
| Week Change: -6.24% Year-to-date Change: 11.9% | |
| STRL Links: Profile News Message Board | |
| Charts:- Daily , Weekly | |
| Add STRL to Watchlist: View: Get Complete STRL Trend Analysis ➞ | |
 | PLPC Preformed Line Products Company |
| Sector: Industrials | |
| SubSector: Industrial Electrical Equipment | |
| MarketCap: 221.779 Millions | |
| Recent Price: 121.11 Smart Investing & Trading Score: 0 | |
| Day Percent Change: -1.15% Day Change: -1.41 | |
| Week Change: -2.15% Year-to-date Change: -9.5% | |
| PLPC Links: Profile News Message Board | |
| Charts:- Daily , Weekly | |
| Add PLPC to Watchlist: View: Get Complete PLPC Trend Analysis ➞ | |
 | TH Target Hospitality Corp. |
| Sector: Industrials | |
| SubSector: Conglomerates | |
| MarketCap: 218.048 Millions | |
| Recent Price: 10.88 Smart Investing & Trading Score: 58 | |
| Day Percent Change: 2.26% Day Change: 0.24 | |
| Week Change: 1.59% Year-to-date Change: 11.8% | |
| TH Links: Profile News Message Board | |
| Charts:- Daily , Weekly | |
| Add TH to Watchlist: View: Get Complete TH Trend Analysis ➞ | |
 | LLAP Terran Orbital Corporation |
| Sector: Industrials | |
| SubSector: Aerospace & Defense | |
| MarketCap: 206 Millions | |
| Recent Price: 1.35 Smart Investing & Trading Score: 71 | |
| Day Percent Change: -6.90% Day Change: -0.10 | |
| Week Change: -8.16% Year-to-date Change: 17.9% | |
| LLAP Links: Profile News Message Board | |
| Charts:- Daily , Weekly | |
| Add LLAP to Watchlist: View: Get Complete LLAP Trend Analysis ➞ | |
 | RYI Ryerson Holding Corporation |
| Sector: Industrials | |
| SubSector: Metal Fabrication | |
| MarketCap: 202.55 Millions | |
| Recent Price: 31.85 Smart Investing & Trading Score: 10 | |
| Day Percent Change: -0.31% Day Change: -0.10 | |
| Week Change: -2.39% Year-to-date Change: -8.2% | |
| RYI Links: Profile News Message Board | |
| Charts:- Daily , Weekly | |
| Add RYI to Watchlist: View: Get Complete RYI Trend Analysis ➞ | |
| RYI Ryerson Holding Corporation |
| Sector: Industrials | |
| SubSector: Metal Fabrication | |
| MarketCap: 202.55 Millions | |
| Recent Price: 9.45 Smart Investing & Trading Score: 10 | |
| Day Percent Change: 0.64% Day Change: 0.06 | |
| Week Change: -2.39% Year-to-date Change: -8.2% | |
| RYI Links: Profile News Message Board | |
| Charts:- Daily , Weekly | |
| Add RYI to Watchlist: View: Get Complete RYI Trend Analysis ➞ | |
 | BZH Beazer Homes USA, Inc. |
| Sector: Industrials | |
| SubSector: Residential Construction | |
| MarketCap: 180.106 Millions | |
| Recent Price: 25.79 Smart Investing & Trading Score: 17 | |
| Day Percent Change: -1.04% Day Change: -0.27 | |
| Week Change: -8.61% Year-to-date Change: -23.7% | |
| BZH Links: Profile News Message Board | |
| Charts:- Daily , Weekly | |
| Add BZH to Watchlist: View: Get Complete BZH Trend Analysis ➞ | |
 | HSHP Himalaya Shipping Ltd. |
| Sector: Industrials | |
| SubSector: Marine Shipping | |
| MarketCap: 179 Millions | |
| Recent Price: 7.70 Smart Investing & Trading Score: 76 | |
| Day Percent Change: -1.41% Day Change: -0.11 | |
| Week Change: -0.65% Year-to-date Change: 14.1% | |
| HSHP Links: Profile News Message Board | |
| Charts:- Daily , Weekly | |
| Add HSHP to Watchlist: View: Get Complete HSHP Trend Analysis ➞ | |
 | RDW Redwire Corporation |
| Sector: Industrials | |
| SubSector: Aerospace & Defense | |
| MarketCap: 160 Millions | |
| Recent Price: 3.57 Smart Investing & Trading Score: 63 | |
| Day Percent Change: 4.69% Day Change: 0.16 | |
| Week Change: -7.51% Year-to-date Change: 25.3% | |
| RDW Links: Profile News Message Board | |
| Charts:- Daily , Weekly | |
| Add RDW to Watchlist: View: Get Complete RDW Trend Analysis ➞ | |
 | ASPN Aspen Aerogels, Inc. |
| Sector: Industrials | |
| SubSector: General Building Materials | |
| MarketCap: 150.153 Millions | |
| Recent Price: 14.88 Smart Investing & Trading Score: 49 | |
| Day Percent Change: -1.26% Day Change: -0.19 | |
| Week Change: -6.53% Year-to-date Change: -5.7% | |
| ASPN Links: Profile News Message Board | |
| Charts:- Daily , Weekly | |
| Add ASPN to Watchlist: View: Get Complete ASPN Trend Analysis ➞ | |
 | GENC Gencor Industries, Inc. |
| Sector: Industrials | |
| SubSector: Farm & Construction Machinery | |
| MarketCap: 147.607 Millions | |
| Recent Price: 16.78 Smart Investing & Trading Score: 51 | |
| Day Percent Change: -0.12% Day Change: -0.02 | |
| Week Change: -1.53% Year-to-date Change: 4.0% | |
| GENC Links: Profile News Message Board | |
| Charts:- Daily , Weekly | |
| Add GENC to Watchlist: View: Get Complete GENC Trend Analysis ➞ | |
 | MEC Mayville Engineering Company, Inc. |
| Sector: Industrials | |
| SubSector: Metal Fabrication | |
| MarketCap: 143.55 Millions | |
| Recent Price: 13.55 Smart Investing & Trading Score: 54 | |
| Day Percent Change: 1.19% Day Change: 0.16 | |
| Week Change: -0.15% Year-to-date Change: -6.0% | |
| MEC Links: Profile News Message Board | |
| Charts:- Daily , Weekly | |
| Add MEC to Watchlist: View: Get Complete MEC Trend Analysis ➞ | |
 | PRTH Priority Technology Holdings, Inc. |
| Sector: Industrials | |
| SubSector: Conglomerates | |
| MarketCap: 116.548 Millions | |
| Recent Price: 3.18 Smart Investing & Trading Score: 27 | |
| Day Percent Change: 0.63% Day Change: 0.02 | |
| Week Change: 0.95% Year-to-date Change: -10.7% | |
| PRTH Links: Profile News Message Board | |
| Charts:- Daily , Weekly | |
| Add PRTH to Watchlist: View: Get Complete PRTH Trend Analysis ➞ | |
 | TWI Titan International, Inc. |
| Sector: Industrials | |
| SubSector: Farm & Construction Machinery | |
| MarketCap: 104.607 Millions | |
| Recent Price: 11.42 Smart Investing & Trading Score: 20 | |
| Day Percent Change: -0.26% Day Change: -0.03 | |
| Week Change: -4.36% Year-to-date Change: -23.3% | |
| TWI Links: Profile News Message Board | |
| Charts:- Daily , Weekly | |
| Add TWI to Watchlist: View: Get Complete TWI Trend Analysis ➞ | |
| For tabular summary view of above stock list: Summary View ➞ 0 - 25 , 25 - 50 , 50 - 75 , 75 - 100 , 100 - 125 , 125 - 150 , 150 - 175 | ||
| Click To Change The Sort Order: By Market Cap or Company Size Performance: Year-to-date, Week and Day | |
| Select Chart Type: | ||
| Too many stocks? View smallcap stocks filtered by marketcap & sector |
| Marketcap: All SmallCap Stocks (default-no microcap), Large, Mid-Range, Small & MicroCap |
| Sector: Tech, Finance, Energy, Staples, Retail, Industrial, Materials, Utilities & Medical |
|
Best Stocks Today 12Stocks.com |
© 2024 12Stocks.com Terms & Conditions Privacy Contact Us
All Information Provided Only For Education And Not To Be Used For Investing or Trading. See Terms & Conditions


One More Thing ... Get Best Stocks Delivered Daily!
Never Ever Miss A Move With Our Top Ten Stocks Lists
Find Best Stocks In Any Market - Bull or Bear Market
Take A Peek At Our Top Ten Stocks Lists: Daily, Weekly, Year-to-Date & Top Trends
Find Best Stocks In Any Market - Bull or Bear Market
Take A Peek At Our Top Ten Stocks Lists: Daily, Weekly, Year-to-Date & Top Trends
Smallcap Stocks With Best Up Trends [0-bearish to 100-bullish]: Badger Meter[100], Cullinan Oncology[100], Oscar Health[100], NextNav [100], Richardson Electronics[100], Seneca Foods[100], Lantheus [100], Macatawa Bank[100], Geron [100], IMAX [100], Regional Management[100]
Best Smallcap Stocks Year-to-Date:
Agenus [500.31%], CareMax [417.53%], Janux [348.12%], Viking [248.9%], Alpine Immune[238.5%], Super Micro[226.74%], Longboard [194.76%], Arcutis Bio[192.57%], Vera [161.3%], Avidity Biosciences[154.87%], Hippo [128.32%] Best Smallcap Stocks This Week:
Macatawa Bank[44.53%], 23andMe Holding[33.3%], ProKidney [32%], Snap One[29.73%], Vertex Energy[23.08%], ALX Oncology[20.64%], Vanda [20.63%], Expensify [18.37%], Badger Meter[16.72%], ContextLogic [15%], Cullinan Oncology[13.89%] Best Smallcap Stocks Daily:
23andMe Holding[65.91%], Vertex Energy[30.72%], Zura Bio[17.20%], Badger Meter[16.65%], ContextLogic [15.81%], Expensify [15.23%], Montrose Environmental[12.84%], Vaxxinity [10.05%], Vuzix [9.87%], Cipher Mining[8.65%], FiscalNote [8.61%]