
 Login Sign Up


| |||||
 |  | ||||

| 12Stocks.com Market Intelligence |
Best SmallCap Stocks
|
| In a hurry? Small Cap Stock Lists: Performance Trends Table, Stock Charts
Sort Small Cap stocks: Daily, Weekly, Year-to-Date, Market Cap & Trends. Filter Small Cap stocks list by sector: Show all, Tech, Finance, Energy, Staples, Retail, Industrial, Materials, Utilities and HealthCare Filter Small Cap stocks list by size: All Large Medium Small and MicroCap |
| 12Stocks.com Small Cap Stocks Performances & Trends Daily | |||||||||
|
|  The overall Smart Investing & Trading Score is 63 (0-bearish to 100-bullish) which puts Small Cap index in short term neutral to bullish trend. The Smart Investing & Trading Score from previous trading session is 58 and an improvement of trend continues.
| ||||||||
Here are the Smart Investing & Trading Scores of the most requested small cap stocks at 12Stocks.com (click stock name for detailed review):
|


| 12Stocks.com: Investing in Smallcap Index with Stocks | |
|
The following table helps investors and traders sort through current performance and trends (as measured by Smart Investing & Trading Score) of various
stocks in the Smallcap Index. Quick View: Move mouse or cursor over stock symbol (ticker) to view short-term technical chart and over stock name to view long term chart. Click on  to add stock symbol to your watchlist and to add stock symbol to your watchlist and  to view watchlist. Click on any ticker or stock name for detailed market intelligence report for that stock. to view watchlist. Click on any ticker or stock name for detailed market intelligence report for that stock. |
12Stocks.com Performance of Stocks in Smallcap Index
| Ticker | Stock Name | Watchlist | Category | Recent Price | Smart Investing & Trading Score | Change % | YTD Change% |
| SLDP | Solid Power |   | Industrials | 1.71 | 75 | 0.29% | 20.00% |
| BWMN | Bowman Consulting | | Industrials | 31.46 | 52 | 0.43% | -10.65% |
| MHO | M/I Homes | | Industrials | 123.70 | 49 | 3.54% | -10.19% |
| ERII | Energy Recovery | | Industrials | 13.86 | 42 | -0.22% | -26.43% |
| USLM | United States | | Industrials | 304.28 | 83 | 0.00% | 32.09% |
| LXFR | Luxfer | | Industrials | 9.71 | 46 | -0.87% | 8.56% |
| MYRG | MYR Group | | Industrials | 166.74 | 68 | 1.44% | 15.29% |
| SWIM | Latham Group | | Industrials | 3.23 | 53 | 1.25% | 22.35% |
| TPC | Tutor Perini | | Industrials | 13.88 | 68 | -0.72% | 52.53% |
| IESC | IES | | Industrials | 129.91 | 75 | 1.77% | 63.99% |
| REX | REX American | | Industrials | 56.50 | 61 | -0.55% | 19.45% |
| MTW | Manitowoc | | Industrials | 13.00 | 42 | -0.15% | -22.11% |
| FIP | FTAI Infrastructure | | Industrials | 7.62 | 93 | -1.81% | 95.76% |
| BOOM | DMC Global | | Industrials | 16.79 | 37 | 0.30% | -10.79% |
| TGI | Triumph Group | | Industrials | 13.35 | 42 | 0.23% | -19.48% |
| FCEL | FuelCell Energy | | Industrials | 0.86 | 27 | -6.74% | -46.45% |
| NX | Quanex Building | | Industrials | 34.32 | 58 | -1.24% | 12.27% |
| ATRO | Astronics | | Industrials | 16.81 | 45 | 0.09% | -3.53% |
| DCO | Ducommun | | Industrials | 53.85 | 93 | -0.37% | 3.44% |
| POWL | Powell Industries | | Industrials | 156.46 | 90 | 9.12% | 76.99% |
| HAYN | Haynes | | Industrials | 60.33 | 68 | -0.24% | 5.74% |
| GWH | ESS Tech | | Industrials | 0.71 | 49 | 1.25% | -38.23% |
| STRL | Sterling Construction | | Industrials | 103.43 | 58 | 1.85% | 17.63% |
| PLPC | Preformed Line | | Industrials | 123.94 | 58 | 0.54% | -7.41% |
| LLAP | Terran Orbital | | Industrials | 1.38 | 68 | 2.61% | 20.09% |
| For chart view version of above stock list: Chart View ➞ 0 - 25 , 25 - 50 , 50 - 75 , 75 - 100 , 100 - 125 , 125 - 150 | ||
 | Click To Change The Sort Order: By Market Cap or Company Size Performance: Year-to-date, Week and Day |  |
| Too many stocks? View smallcap stocks filtered by marketcap & sector |
| Marketcap: All SmallCap Stocks (default-no microcap), Large, Mid-Range, Small |
| Smallcap Sector: Tech, Finance, Energy, Staples, Retail, Industrial, Materials, & Medical |
|
Get the most comprehensive stock market coverage daily at 12Stocks.com ➞ Best Stocks Today ➞ Best Stocks Weekly ➞ Best Stocks Year-to-Date ➞ Best Stocks Trends ➞  Best Stocks Today 12Stocks.com Best Nasdaq Stocks ➞ Best S&P 500 Stocks ➞ Best Tech Stocks ➞ Best Biotech Stocks ➞ |
| Detailed Overview of SmallCap Stocks |
| SmallCap Technical Overview, Leaders & Laggards, Top SmallCap ETF Funds & Detailed SmallCap Stocks List, Charts, Trends & More |
| Smallcap: Technical Analysis, Trends & YTD Performance | |
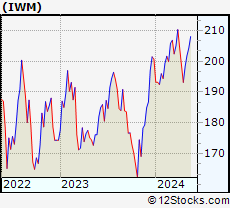
| SmallCap segment as represented by
IWM, an exchange-traded fund [ETF], holds basket of thousands of smallcap stocks from across all major sectors of the US stock market. The smallcap index (contains stocks like Riverbed & Sotheby's) is down by -1.22% and is currently underperforming the overall market by -7% year-to-date. Below is a quick view of technical charts and trends: | |
 IWM Weekly Chart |
|
| Long Term Trend: Good | |
| Medium Term Trend: Not Good | |
 IWM Daily Chart |
|
| Short Term Trend: Very Good | |
| Overall Trend Score: 63 | |
| YTD Performance: -1.22% | |
| **Trend Scores & Views Are Only For Educational Purposes And Not For Investing | |
| 12Stocks.com: Top Performing Small Cap Index Stocks | ||||||||||||||||||||||||||||||||||||||||||||||||
 The top performing Small Cap Index stocks year to date are
Now, more recently, over last week, the top performing Small Cap Index stocks on the move are


|
||||||||||||||||||||||||||||||||||||||||||||||||
| 12Stocks.com: Investing in Smallcap Index using Exchange Traded Funds | |
|
The following table shows list of key exchange traded funds (ETF) that
help investors track Smallcap index. The following list also includes leveraged ETF funds that track twice or thrice the daily returns of Smallcap indices. Short or inverse ETF funds move in the opposite direction to the index they track and are useful during market pullbacks or during bear markets. Quick View: Move mouse or cursor over ETF symbol (ticker) to view short-term technical chart and over ETF name to view long term chart. Click on ticker or stock name for detailed view. Click on to add stock symbol to your watchlist and to view watchlist. |
12Stocks.com List of ETFs that track Smallcap Index
| Ticker | ETF Name | Watchlist | Recent Price | Smart Investing & Trading Score | Change % | Week % | Year-to-date % |
| IWM | iShares Russell 2000 | | 198.27 | 63 | -0.15 | 2.66 | -1.22% |
| IJR | iShares Core S&P Small-Cap | | 105.72 | 85 | -0.23 | 2.42 | -2.34% |
| IWN | iShares Russell 2000 Value | | 151.29 | 75 | -0.30 | 2.38 | -2.6% |
| IWO | iShares Russell 2000 Growth | | 252.75 | 58 | 0.15 | 3.04 | 0.21% |
| 12Stocks.com: Charts, Trends, Fundamental Data and Performances of SmallCap Stocks | |
|
We now take in-depth look at all SmallCap stocks including charts, multi-period performances and overall trends (as measured by Smart Investing & Trading Score). One can sort SmallCap stocks (click link to choose) by Daily, Weekly and by Year-to-Date performances. Also, one can sort by size of the company or by market capitalization. |
| Select Your Default Chart Type: | |||||
| |||||
| Click on stock symbol or name for detailed view. Click on to add stock symbol to your watchlist and to view watchlist. Quick View: Move mouse or cursor over "Daily" to quickly view daily technical stock chart and over "Weekly" to view weekly technical stock chart. | |||||

 | SLDP Solid Power, Inc. |
| Sector: Industrials | |
| SubSector: Electrical Equipment & Parts | |
| MarketCap: 445 Millions | |
| Recent Price: 1.71 Smart Investing & Trading Score: 75 | |
| Day Percent Change: 0.29% Day Change: 0.00 | |
| Week Change: 4.27% Year-to-date Change: 20.0% | |
| SLDP Links: Profile News Message Board | |
| Charts:- Daily , Weekly | |
| Add SLDP to Watchlist: View: Get Complete SLDP Trend Analysis ➞ | |
 | BWMN Bowman Consulting Group Ltd. |
| Sector: Industrials | |
| SubSector: Engineering & Construction | |
| MarketCap: 443 Millions | |
| Recent Price: 31.46 Smart Investing & Trading Score: 52 | |
| Day Percent Change: 0.43% Day Change: 0.14 | |
| Week Change: 4% Year-to-date Change: -10.7% | |
| BWMN Links: Profile News Message Board | |
| Charts:- Daily , Weekly | |
| Add BWMN to Watchlist: View: Get Complete BWMN Trend Analysis ➞ | |
 | MHO M/I Homes, Inc. |
| Sector: Industrials | |
| SubSector: Residential Construction | |
| MarketCap: 437.106 Millions | |
| Recent Price: 123.70 Smart Investing & Trading Score: 49 | |
| Day Percent Change: 3.54% Day Change: 4.23 | |
| Week Change: 11.35% Year-to-date Change: -10.2% | |
| MHO Links: Profile News Message Board | |
| Charts:- Daily , Weekly | |
| Add MHO to Watchlist: View: Get Complete MHO Trend Analysis ➞ | |
 | ERII Energy Recovery, Inc. |
| Sector: Industrials | |
| SubSector: Pollution & Treatment Controls | |
| MarketCap: 429.375 Millions | |
| Recent Price: 13.86 Smart Investing & Trading Score: 42 | |
| Day Percent Change: -0.22% Day Change: -0.03 | |
| Week Change: 1.09% Year-to-date Change: -26.4% | |
| ERII Links: Profile News Message Board | |
| Charts:- Daily , Weekly | |
| Add ERII to Watchlist: View: Get Complete ERII Trend Analysis ➞ | |
 | USLM United States Lime & Minerals, Inc. |
| Sector: Industrials | |
| SubSector: General Building Materials | |
| MarketCap: 427.653 Millions | |
| Recent Price: 304.28 Smart Investing & Trading Score: 83 | |
| Day Percent Change: 0.00% Day Change: 0.00 | |
| Week Change: 2.53% Year-to-date Change: 32.1% | |
| USLM Links: Profile News Message Board | |
| Charts:- Daily , Weekly | |
| Add USLM to Watchlist: View: Get Complete USLM Trend Analysis ➞ | |
 | LXFR Luxfer Holdings PLC |
| Sector: Industrials | |
| SubSector: Diversified Machinery | |
| MarketCap: 406.716 Millions | |
| Recent Price: 9.71 Smart Investing & Trading Score: 46 | |
| Day Percent Change: -0.87% Day Change: -0.08 | |
| Week Change: -0.77% Year-to-date Change: 8.6% | |
| LXFR Links: Profile News Message Board | |
| Charts:- Daily , Weekly | |
| Add LXFR to Watchlist: View: Get Complete LXFR Trend Analysis ➞ | |
 | MYRG MYR Group Inc. |
| Sector: Industrials | |
| SubSector: General Contractors | |
| MarketCap: 405.363 Millions | |
| Recent Price: 166.74 Smart Investing & Trading Score: 68 | |
| Day Percent Change: 1.44% Day Change: 2.36 | |
| Week Change: 5.06% Year-to-date Change: 15.3% | |
| MYRG Links: Profile News Message Board | |
| Charts:- Daily , Weekly | |
| Add MYRG to Watchlist: View: Get Complete MYRG Trend Analysis ➞ | |
 | SWIM Latham Group, Inc. |
| Sector: Industrials | |
| SubSector: Building Products & Equipment | |
| MarketCap: 388 Millions | |
| Recent Price: 3.23 Smart Investing & Trading Score: 53 | |
| Day Percent Change: 1.25% Day Change: 0.04 | |
| Week Change: 5.21% Year-to-date Change: 22.4% | |
| SWIM Links: Profile News Message Board | |
| Charts:- Daily , Weekly | |
| Add SWIM to Watchlist: View: Get Complete SWIM Trend Analysis ➞ | |
 | TPC Tutor Perini Corporation |
| Sector: Industrials | |
| SubSector: Heavy Construction | |
| MarketCap: 382.595 Millions | |
| Recent Price: 13.88 Smart Investing & Trading Score: 68 | |
| Day Percent Change: -0.72% Day Change: -0.10 | |
| Week Change: 4.52% Year-to-date Change: 52.5% | |
| TPC Links: Profile News Message Board | |
| Charts:- Daily , Weekly | |
| Add TPC to Watchlist: View: Get Complete TPC Trend Analysis ➞ | |
 | IESC IES Holdings, Inc. |
| Sector: Industrials | |
| SubSector: General Contractors | |
| MarketCap: 380.963 Millions | |
| Recent Price: 129.91 Smart Investing & Trading Score: 75 | |
| Day Percent Change: 1.77% Day Change: 2.26 | |
| Week Change: 12.47% Year-to-date Change: 64.0% | |
| IESC Links: Profile News Message Board | |
| Charts:- Daily , Weekly | |
| Add IESC to Watchlist: View: Get Complete IESC Trend Analysis ➞ | |
 | REX REX American Resources Corporation |
| Sector: Industrials | |
| SubSector: Conglomerates | |
| MarketCap: 373.748 Millions | |
| Recent Price: 56.50 Smart Investing & Trading Score: 61 | |
| Day Percent Change: -0.55% Day Change: -0.31 | |
| Week Change: 0.46% Year-to-date Change: 19.5% | |
| REX Links: Profile News Message Board | |
| Charts:- Daily , Weekly | |
| Add REX to Watchlist: View: Get Complete REX Trend Analysis ➞ | |
 | MTW The Manitowoc Company, Inc. |
| Sector: Industrials | |
| SubSector: Farm & Construction Machinery | |
| MarketCap: 373.707 Millions | |
| Recent Price: 13.00 Smart Investing & Trading Score: 42 | |
| Day Percent Change: -0.15% Day Change: -0.02 | |
| Week Change: 0.93% Year-to-date Change: -22.1% | |
| MTW Links: Profile News Message Board | |
| Charts:- Daily , Weekly | |
| Add MTW to Watchlist: View: Get Complete MTW Trend Analysis ➞ | |
 | FIP FTAI Infrastructure Inc. |
| Sector: Industrials | |
| SubSector: Industrials | |
| MarketCap: 368 Millions | |
| Recent Price: 7.62 Smart Investing & Trading Score: 93 | |
| Day Percent Change: -1.81% Day Change: -0.14 | |
| Week Change: 14.17% Year-to-date Change: 95.8% | |
| FIP Links: Profile News Message Board | |
| Charts:- Daily , Weekly | |
| Add FIP to Watchlist: View: Get Complete FIP Trend Analysis ➞ | |
 | BOOM DMC Global Inc. |
| Sector: Industrials | |
| SubSector: Metal Fabrication | |
| MarketCap: 359.15 Millions | |
| Recent Price: 16.79 Smart Investing & Trading Score: 37 | |
| Day Percent Change: 0.30% Day Change: 0.05 | |
| Week Change: -1.35% Year-to-date Change: -10.8% | |
| BOOM Links: Profile News Message Board | |
| Charts:- Daily , Weekly | |
| Add BOOM to Watchlist: View: Get Complete BOOM Trend Analysis ➞ | |
 | TGI Triumph Group, Inc. |
| Sector: Industrials | |
| SubSector: Aerospace/Defense Products & Services | |
| MarketCap: 358.901 Millions | |
| Recent Price: 13.35 Smart Investing & Trading Score: 42 | |
| Day Percent Change: 0.23% Day Change: 0.03 | |
| Week Change: 4.13% Year-to-date Change: -19.5% | |
| TGI Links: Profile News Message Board | |
| Charts:- Daily , Weekly | |
| Add TGI to Watchlist: View: Get Complete TGI Trend Analysis ➞ | |
 | FCEL FuelCell Energy, Inc. |
| Sector: Industrials | |
| SubSector: Industrial Electrical Equipment | |
| MarketCap: 347.079 Millions | |
| Recent Price: 0.86 Smart Investing & Trading Score: 27 | |
| Day Percent Change: -6.74% Day Change: -0.06 | |
| Week Change: -3.09% Year-to-date Change: -46.5% | |
| FCEL Links: Profile News Message Board | |
| Charts:- Daily , Weekly | |
| Add FCEL to Watchlist: View: Get Complete FCEL Trend Analysis ➞ | |
 | NX Quanex Building Products Corporation |
| Sector: Industrials | |
| SubSector: General Building Materials | |
| MarketCap: 315.453 Millions | |
| Recent Price: 34.32 Smart Investing & Trading Score: 58 | |
| Day Percent Change: -1.24% Day Change: -0.43 | |
| Week Change: -0.92% Year-to-date Change: 12.3% | |
| NX Links: Profile News Message Board | |
| Charts:- Daily , Weekly | |
| Add NX to Watchlist: View: Get Complete NX Trend Analysis ➞ | |
 | ATRO Astronics Corporation |
| Sector: Industrials | |
| SubSector: Aerospace/Defense Products & Services | |
| MarketCap: 287.201 Millions | |
| Recent Price: 16.81 Smart Investing & Trading Score: 45 | |
| Day Percent Change: 0.09% Day Change: 0.02 | |
| Week Change: 4.9% Year-to-date Change: -3.5% | |
| ATRO Links: Profile News Message Board | |
| Charts:- Daily , Weekly | |
| Add ATRO to Watchlist: View: Get Complete ATRO Trend Analysis ➞ | |
 | DCO Ducommun Incorporated |
| Sector: Industrials | |
| SubSector: Aerospace/Defense Products & Services | |
| MarketCap: 261.101 Millions | |
| Recent Price: 53.85 Smart Investing & Trading Score: 93 | |
| Day Percent Change: -0.37% Day Change: -0.20 | |
| Week Change: 3.52% Year-to-date Change: 3.4% | |
| DCO Links: Profile News Message Board | |
| Charts:- Daily , Weekly | |
| Add DCO to Watchlist: View: Get Complete DCO Trend Analysis ➞ | |
 | POWL Powell Industries, Inc. |
| Sector: Industrials | |
| SubSector: Diversified Machinery | |
| MarketCap: 257.216 Millions | |
| Recent Price: 156.46 Smart Investing & Trading Score: 90 | |
| Day Percent Change: 9.12% Day Change: 13.07 | |
| Week Change: 20.04% Year-to-date Change: 77.0% | |
| POWL Links: Profile News Message Board | |
| Charts:- Daily , Weekly | |
| Add POWL to Watchlist: View: Get Complete POWL Trend Analysis ➞ | |
 | HAYN Haynes International, Inc. |
| Sector: Industrials | |
| SubSector: Metal Fabrication | |
| MarketCap: 245.75 Millions | |
| Recent Price: 60.33 Smart Investing & Trading Score: 68 | |
| Day Percent Change: -0.24% Day Change: -0.14 | |
| Week Change: 0.12% Year-to-date Change: 5.7% | |
| HAYN Links: Profile News Message Board | |
| Charts:- Daily , Weekly | |
| Add HAYN to Watchlist: View: Get Complete HAYN Trend Analysis ➞ | |
 | GWH ESS Tech, Inc. |
| Sector: Industrials | |
| SubSector: Electrical Equipment & Parts | |
| MarketCap: 239 Millions | |
| Recent Price: 0.71 Smart Investing & Trading Score: 49 | |
| Day Percent Change: 1.25% Day Change: 0.01 | |
| Week Change: 2.34% Year-to-date Change: -38.2% | |
| GWH Links: Profile News Message Board | |
| Charts:- Daily , Weekly | |
| Add GWH to Watchlist: View: Get Complete GWH Trend Analysis ➞ | |
 | STRL Sterling Construction Company, Inc. |
| Sector: Industrials | |
| SubSector: Heavy Construction | |
| MarketCap: 237.395 Millions | |
| Recent Price: 103.43 Smart Investing & Trading Score: 58 | |
| Day Percent Change: 1.85% Day Change: 1.88 | |
| Week Change: 7.11% Year-to-date Change: 17.6% | |
| STRL Links: Profile News Message Board | |
| Charts:- Daily , Weekly | |
| Add STRL to Watchlist: View: Get Complete STRL Trend Analysis ➞ | |
 | PLPC Preformed Line Products Company |
| Sector: Industrials | |
| SubSector: Industrial Electrical Equipment | |
| MarketCap: 221.779 Millions | |
| Recent Price: 123.94 Smart Investing & Trading Score: 58 | |
| Day Percent Change: 0.54% Day Change: 0.67 | |
| Week Change: -0.58% Year-to-date Change: -7.4% | |
| PLPC Links: Profile News Message Board | |
| Charts:- Daily , Weekly | |
| Add PLPC to Watchlist: View: Get Complete PLPC Trend Analysis ➞ | |
 | LLAP Terran Orbital Corporation |
| Sector: Industrials | |
| SubSector: Aerospace & Defense | |
| MarketCap: 206 Millions | |
| Recent Price: 1.38 Smart Investing & Trading Score: 68 | |
| Day Percent Change: 2.61% Day Change: 0.03 | |
| Week Change: 5.77% Year-to-date Change: 20.1% | |
| LLAP Links: Profile News Message Board | |
| Charts:- Daily , Weekly | |
| Add LLAP to Watchlist: View: Get Complete LLAP Trend Analysis ➞ | |
| For tabular summary view of above stock list: Summary View ➞ 0 - 25 , 25 - 50 , 50 - 75 , 75 - 100 , 100 - 125 , 125 - 150 | ||
| Click To Change The Sort Order: By Market Cap or Company Size Performance: Year-to-date, Week and Day | |
| Select Chart Type: | ||
| Too many stocks? View smallcap stocks filtered by marketcap & sector |
| Marketcap: All SmallCap Stocks (default-no microcap), Large, Mid-Range, Small & MicroCap |
| Sector: Tech, Finance, Energy, Staples, Retail, Industrial, Materials, Utilities & Medical |
|
Best Stocks Today 12Stocks.com |
© 2024 12Stocks.com Terms & Conditions Privacy Contact Us
All Information Provided Only For Education And Not To Be Used For Investing or Trading. See Terms & Conditions


One More Thing ... Get Best Stocks Delivered Daily!
Never Ever Miss A Move With Our Top Ten Stocks Lists
Find Best Stocks In Any Market - Bull or Bear Market
Take A Peek At Our Top Ten Stocks Lists: Daily, Weekly, Year-to-Date & Top Trends
Find Best Stocks In Any Market - Bull or Bear Market
Take A Peek At Our Top Ten Stocks Lists: Daily, Weekly, Year-to-Date & Top Trends
Smallcap Stocks With Best Up Trends [0-bearish to 100-bullish]: Trustmark [100], Riot Blockchain[100], Uniti Group[100], Napco Security[100], Mueller Industries[100], Sanmina [100], AeroVironment [100], NextNav [100], Oscar Health[100], Glaukos [100], Jackson Financial[100]
Best Smallcap Stocks Year-to-Date:
Janux [362.73%], Viking [259.7%], Alpine Immune[239.34%], Longboard [234.29%], Avidity Biosciences[182.02%], Super Micro[174.8%], Vera [149.48%], Hippo [133.81%], Trevi [119.4%], Veritone [113.74%], MicroStrategy [110.11%] Best Smallcap Stocks This Week:
Matterport [162.93%], B. Riley[46.37%], Riot Blockchain[36.04%], Seres [35.61%], Cipher Mining[27.6%], SoundHound AI[24.51%], ProKidney [23.28%], Hibbett Sports[20.97%], BigBear.ai [20.34%], Marathon Patent[20.06%], Powell Industries[20.04%] Best Smallcap Stocks Daily:
B. Riley[34.71%], Babcock & Wilcox Enterprises[16.66%], Powell Industries[9.12%], Navitas Semiconductor[9.09%], Sage [8.88%], K12 [8.04%], Maxeon Solar[6.63%], Recursion [6.57%], Trustmark [6.28%], Group 1[6.16%], Innodata [6.10%]