
 Login Sign Up


| |||||
 |  | ||||

| 12Stocks.com Market Intelligence |
Best SmallCap Stocks
|
| In a hurry? Small Cap Stock Lists: Performance Trends Table, Stock Charts
Sort Small Cap stocks: Daily, Weekly, Year-to-Date, Market Cap & Trends. Filter Small Cap stocks list by sector: Show all, Tech, Finance, Energy, Staples, Retail, Industrial, Materials, Utilities and HealthCare Filter Small Cap stocks list by size: All Large Medium Small and MicroCap |
| 12Stocks.com Small Cap Stocks Performances & Trends Daily | |||||||||
|
|  The overall Smart Investing & Trading Score is 58 (0-bearish to 100-bullish) which puts Small Cap index in short term neutral trend. The Smart Investing & Trading Score from previous trading session is 63 and hence a deterioration of trend.
| ||||||||
Here are the Smart Investing & Trading Scores of the most requested small cap stocks at 12Stocks.com (click stock name for detailed review):
|


| 12Stocks.com: Investing in Smallcap Index with Stocks | |
|
The following table helps investors and traders sort through current performance and trends (as measured by Smart Investing & Trading Score) of various
stocks in the Smallcap Index. Quick View: Move mouse or cursor over stock symbol (ticker) to view short-term technical chart and over stock name to view long term chart. Click on  to add stock symbol to your watchlist and to add stock symbol to your watchlist and  to view watchlist. Click on any ticker or stock name for detailed market intelligence report for that stock. to view watchlist. Click on any ticker or stock name for detailed market intelligence report for that stock. |
12Stocks.com Performance of Stocks in Smallcap Index
| Ticker | Stock Name | Watchlist | Category | Recent Price | Smart Investing & Trading Score | Change % | YTD Change% |
| TCBK | TriCo Bancshares |   | Financials | 34.65 | 67 | -0.67% | -19.37% |
| OCFC | OceanFirst Financial | | Financials | 15.35 | 44 | -0.58% | -11.58% |
| UFCS | United Fire | | Financials | 22.68 | 81 | -0.48% | 12.72% |
| LC | LendingClub | | Financials | 8.16 | 49 | -0.49% | -6.64% |
| TRUP | Trupanion | | Financials | 23.77 | 49 | 4.48% | -22.09% |
| CASH | Meta Financial | | Financials | 50.94 | 55 | 0.37% | -3.76% |
| NXRT | NexPoint Residential | | Financials | 33.68 | 80 | 2.00% | -2.18% |
| PFS | Provident Financial | | Financials | 15.52 | 67 | 0.00% | -13.92% |
| NMIH | NMI | | Financials | 30.77 | 42 | -0.06% | 3.67% |
| DHC | Diversified Healthcare | | Financials | 2.38 | 10 | -1.04% | -36.23% |
| RMR | RMR Group | | Financials | 22.86 | 18 | 0.15% | -19.00% |
| SRCE | 1st Source | | Financials | 50.65 | 54 | -0.24% | -7.83% |
| KRNY | Kearny Financial | | Financials | 5.96 | 52 | 1.71% | -33.56% |
| EFSC | Enterprise Financial | | Financials | 38.82 | 17 | -0.97% | -13.06% |
| NMRK | Newmark Group | | Financials | 9.67 | 10 | -1.12% | -11.77% |
| EVER | EverQuote | | Financials | 19.57 | 68 | 5.81% | 59.93% |
| NBHC | National Bank | | Financials | 34.49 | 59 | -0.89% | -7.26% |
| SASR | Sandy Spring | | Financials | 21.36 | 74 | -2.51% | -21.59% |
| PIPR | Piper Sandler | | Financials | 195.28 | 60 | -0.16% | 11.67% |
| NRDS | NerdWallet | | Financials | 13.73 | 35 | -0.72% | -8.10% |
| CADE | Cadence Ban | | Financials | 29.27 | 75 | 1.33% | -1.06% |
| HFWA | Heritage Financial | | Financials | 18.49 | 74 | -0.75% | -13.56% |
| ALEX | Alexander & Baldwin | | Financials | 16.06 | 47 | -1.50% | -15.59% |
| BRP | BRP Group | | Financials | 27.39 | 54 | -2.18% | 14.03% |
| GABC | German American | | Financials | 32.98 | 17 | -0.74% | 1.74% |
| For chart view version of above stock list: Chart View ➞ 0 - 25 , 25 - 50 , 50 - 75 , 75 - 100 , 100 - 125 , 125 - 150 , 150 - 175 , 175 - 200 , 200 - 225 , 225 - 250 , 250 - 275 , 275 - 300 , 300 - 325 , 325 - 350 , 350 - 375 , 375 - 400 | ||
 | Click To Change The Sort Order: By Market Cap or Company Size Performance: Year-to-date, Week and Day |  |
| Too many stocks? View smallcap stocks filtered by marketcap & sector |
| Marketcap: All SmallCap Stocks (default-no microcap), Large, Mid-Range, Small |
| Smallcap Sector: Tech, Finance, Energy, Staples, Retail, Industrial, Materials, & Medical |
|
Get the most comprehensive stock market coverage daily at 12Stocks.com ➞ Best Stocks Today ➞ Best Stocks Weekly ➞ Best Stocks Year-to-Date ➞ Best Stocks Trends ➞  Best Stocks Today 12Stocks.com Best Nasdaq Stocks ➞ Best S&P 500 Stocks ➞ Best Tech Stocks ➞ Best Biotech Stocks ➞ |
| Detailed Overview of SmallCap Stocks |
| SmallCap Technical Overview, Leaders & Laggards, Top SmallCap ETF Funds & Detailed SmallCap Stocks List, Charts, Trends & More |
| Smallcap: Technical Analysis, Trends & YTD Performance | |
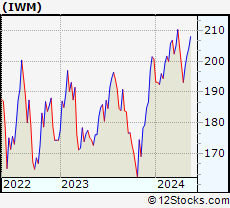
| SmallCap segment as represented by
IWM, an exchange-traded fund [ETF], holds basket of thousands of smallcap stocks from across all major sectors of the US stock market. The smallcap index (contains stocks like Riverbed & Sotheby's) is down by -1.66% and is currently underperforming the overall market by -7.15% year-to-date. Below is a quick view of technical charts and trends: | |
 IWM Weekly Chart |
|
| Long Term Trend: Good | |
| Medium Term Trend: Not Good | |
 IWM Daily Chart |
|
| Short Term Trend: Very Good | |
| Overall Trend Score: 58 | |
| YTD Performance: -1.66% | |
| **Trend Scores & Views Are Only For Educational Purposes And Not For Investing | |
| 12Stocks.com: Top Performing Small Cap Index Stocks | ||||||||||||||||||||||||||||||||||||||||||||||||
 The top performing Small Cap Index stocks year to date are
Now, more recently, over last week, the top performing Small Cap Index stocks on the move are


|
||||||||||||||||||||||||||||||||||||||||||||||||
| 12Stocks.com: Investing in Smallcap Index using Exchange Traded Funds | |
|
The following table shows list of key exchange traded funds (ETF) that
help investors track Smallcap index. The following list also includes leveraged ETF funds that track twice or thrice the daily returns of Smallcap indices. Short or inverse ETF funds move in the opposite direction to the index they track and are useful during market pullbacks or during bear markets. Quick View: Move mouse or cursor over ETF symbol (ticker) to view short-term technical chart and over ETF name to view long term chart. Click on ticker or stock name for detailed view. Click on to add stock symbol to your watchlist and to view watchlist. |
12Stocks.com List of ETFs that track Smallcap Index
| Ticker | ETF Name | Watchlist | Recent Price | Smart Investing & Trading Score | Change % | Week % | Year-to-date % |
| IWM | iShares Russell 2000 | | 197.38 | 58 | -0.60 | 2.2 | -1.66% |
| IJR | iShares Core S&P Small-Cap | | 105.53 | 85 | -0.41 | 2.24 | -2.51% |
| VTWO | Vanguard Russell 2000 ETF | | 79.82 | 48 | -0.59 | 2.23 | -1.58% |
| IWN | iShares Russell 2000 Value | | 150.97 | 75 | -0.51 | 2.16 | -2.81% |
| IWO | iShares Russell 2000 Growth | | 250.95 | 58 | -0.56 | 2.31 | -0.5% |
| IJS | iShares S&P Small-Cap 600 Value | | 97.43 | 45 | -0.71 | 1.9 | -5.47% |
| IJT | iShares S&P Small-Cap 600 Growth | | 125.18 | 48 | -0.43 | 2.43 | 0.03% |
| XSLV | PowerShares S&P SmallCap Low Volatil ETF | | 42.93 | 48 | -0.28 | 1.78 | -2.76% |
| SBB | ProShares Short SmallCap600 | | 16.43 | 33 | 0.34 | -2.43 | 3.14% |
| SMLV | SPDR SSGA US Small Cap Low Volatil ETF | | 108.04 | 73 | -0.66 | 1.84 | -3.98% |
| SDD | ProShares UltraShort SmallCap600 | | 19.49 | 42 | 1.35 | -4.18 | 5.77% |
| SAA | ProShares Ultra SmallCap600 | | 22.85 | 58 | -1.30 | 4.82 | -8.42% |
| 12Stocks.com: Charts, Trends, Fundamental Data and Performances of SmallCap Stocks | |
|
We now take in-depth look at all SmallCap stocks including charts, multi-period performances and overall trends (as measured by Smart Investing & Trading Score). One can sort SmallCap stocks (click link to choose) by Daily, Weekly and by Year-to-Date performances. Also, one can sort by size of the company or by market capitalization. |
| Select Your Default Chart Type: | |||||
| |||||
| Click on stock symbol or name for detailed view. Click on to add stock symbol to your watchlist and to view watchlist. Quick View: Move mouse or cursor over "Daily" to quickly view daily technical stock chart and over "Weekly" to view weekly technical stock chart. | |||||

 | TCBK TriCo Bancshares |
| Sector: Financials | |
| SubSector: Regional - Pacific Banks | |
| MarketCap: 875.129 Millions | |
| Recent Price: 34.65 Smart Investing & Trading Score: 67 | |
| Day Percent Change: -0.67% Day Change: -0.23 | |
| Week Change: 3.17% Year-to-date Change: -19.4% | |
| TCBK Links: Profile News Message Board | |
| Charts:- Daily , Weekly | |
| Add TCBK to Watchlist: View: Get Complete TCBK Trend Analysis ➞ | |
 | OCFC OceanFirst Financial Corp. |
| Sector: Financials | |
| SubSector: Savings & Loans | |
| MarketCap: 867.43 Millions | |
| Recent Price: 15.35 Smart Investing & Trading Score: 44 | |
| Day Percent Change: -0.58% Day Change: -0.09 | |
| Week Change: 1.12% Year-to-date Change: -11.6% | |
| OCFC Links: Profile News Message Board | |
| Charts:- Daily , Weekly | |
| Add OCFC to Watchlist: View: Get Complete OCFC Trend Analysis ➞ | |
 | UFCS United Fire Group, Inc. |
| Sector: Financials | |
| SubSector: Property & Casualty Insurance | |
| MarketCap: 862.812 Millions | |
| Recent Price: 22.68 Smart Investing & Trading Score: 81 | |
| Day Percent Change: -0.48% Day Change: -0.11 | |
| Week Change: -0.53% Year-to-date Change: 12.7% | |
| UFCS Links: Profile News Message Board | |
| Charts:- Daily , Weekly | |
| Add UFCS to Watchlist: View: Get Complete UFCS Trend Analysis ➞ | |
 | LC LendingClub Corporation |
| Sector: Financials | |
| SubSector: Credit Services | |
| MarketCap: 852.308 Millions | |
| Recent Price: 8.16 Smart Investing & Trading Score: 49 | |
| Day Percent Change: -0.49% Day Change: -0.04 | |
| Week Change: 3.29% Year-to-date Change: -6.6% | |
| LC Links: Profile News Message Board | |
| Charts:- Daily , Weekly | |
| Add LC to Watchlist: View: Get Complete LC Trend Analysis ➞ | |
 | TRUP Trupanion, Inc. |
| Sector: Financials | |
| SubSector: Accident & Health Insurance | |
| MarketCap: 852.06 Millions | |
| Recent Price: 23.77 Smart Investing & Trading Score: 49 | |
| Day Percent Change: 4.48% Day Change: 1.02 | |
| Week Change: 5.88% Year-to-date Change: -22.1% | |
| TRUP Links: Profile News Message Board | |
| Charts:- Daily , Weekly | |
| Add TRUP to Watchlist: View: Get Complete TRUP Trend Analysis ➞ | |
 | CASH Meta Financial Group, Inc. |
| Sector: Financials | |
| SubSector: Savings & Loans | |
| MarketCap: 849.33 Millions | |
| Recent Price: 50.94 Smart Investing & Trading Score: 55 | |
| Day Percent Change: 0.37% Day Change: 0.19 | |
| Week Change: 1.09% Year-to-date Change: -3.8% | |
| CASH Links: Profile News Message Board | |
| Charts:- Daily , Weekly | |
| Add CASH to Watchlist: View: Get Complete CASH Trend Analysis ➞ | |
 | NXRT NexPoint Residential Trust, Inc. |
| Sector: Financials | |
| SubSector: REIT - Residential | |
| MarketCap: 839.161 Millions | |
| Recent Price: 33.68 Smart Investing & Trading Score: 80 | |
| Day Percent Change: 2.00% Day Change: 0.66 | |
| Week Change: 4.89% Year-to-date Change: -2.2% | |
| NXRT Links: Profile News Message Board | |
| Charts:- Daily , Weekly | |
| Add NXRT to Watchlist: View: Get Complete NXRT Trend Analysis ➞ | |
 | PFS Provident Financial Services, Inc. |
| Sector: Financials | |
| SubSector: Savings & Loans | |
| MarketCap: 829.73 Millions | |
| Recent Price: 15.52 Smart Investing & Trading Score: 67 | |
| Day Percent Change: 0.00% Day Change: 0.00 | |
| Week Change: 7.33% Year-to-date Change: -13.9% | |
| PFS Links: Profile News Message Board | |
| Charts:- Daily , Weekly | |
| Add PFS to Watchlist: View: Get Complete PFS Trend Analysis ➞ | |
 | NMIH NMI Holdings, Inc. |
| Sector: Financials | |
| SubSector: Surety & Title Insurance | |
| MarketCap: 816.018 Millions | |
| Recent Price: 30.77 Smart Investing & Trading Score: 42 | |
| Day Percent Change: -0.06% Day Change: -0.02 | |
| Week Change: 2.46% Year-to-date Change: 3.7% | |
| NMIH Links: Profile News Message Board | |
| Charts:- Daily , Weekly | |
| Add NMIH to Watchlist: View: Get Complete NMIH Trend Analysis ➞ | |
 | DHC Diversified Healthcare Trust |
| Sector: Financials | |
| SubSector: REIT - Healthcare Facilities | |
| MarketCap: 814.114 Millions | |
| Recent Price: 2.38 Smart Investing & Trading Score: 10 | |
| Day Percent Change: -1.04% Day Change: -0.03 | |
| Week Change: -1.24% Year-to-date Change: -36.2% | |
| DHC Links: Profile News Message Board | |
| Charts:- Daily , Weekly | |
| Add DHC to Watchlist: View: Get Complete DHC Trend Analysis ➞ | |
 | RMR The RMR Group Inc. |
| Sector: Financials | |
| SubSector: Real Estate Development | |
| MarketCap: 797.419 Millions | |
| Recent Price: 22.86 Smart Investing & Trading Score: 18 | |
| Day Percent Change: 0.15% Day Change: 0.04 | |
| Week Change: 1.31% Year-to-date Change: -19.0% | |
| RMR Links: Profile News Message Board | |
| Charts:- Daily , Weekly | |
| Add RMR to Watchlist: View: Get Complete RMR Trend Analysis ➞ | |
 | SRCE 1st Source Corporation |
| Sector: Financials | |
| SubSector: Regional - Midwest Banks | |
| MarketCap: 784.77 Millions | |
| Recent Price: 50.65 Smart Investing & Trading Score: 54 | |
| Day Percent Change: -0.24% Day Change: -0.12 | |
| Week Change: 1.28% Year-to-date Change: -7.8% | |
| SRCE Links: Profile News Message Board | |
| Charts:- Daily , Weekly | |
| Add SRCE to Watchlist: View: Get Complete SRCE Trend Analysis ➞ | |
 | KRNY Kearny Financial Corp. |
| Sector: Financials | |
| SubSector: Savings & Loans | |
| MarketCap: 781.73 Millions | |
| Recent Price: 5.96 Smart Investing & Trading Score: 52 | |
| Day Percent Change: 1.71% Day Change: 0.10 | |
| Week Change: 2.05% Year-to-date Change: -33.6% | |
| KRNY Links: Profile News Message Board | |
| Charts:- Daily , Weekly | |
| Add KRNY to Watchlist: View: Get Complete KRNY Trend Analysis ➞ | |
 | EFSC Enterprise Financial Services Corp |
| Sector: Financials | |
| SubSector: Regional - Southwest Banks | |
| MarketCap: 770.165 Millions | |
| Recent Price: 38.82 Smart Investing & Trading Score: 17 | |
| Day Percent Change: -0.97% Day Change: -0.38 | |
| Week Change: -2.17% Year-to-date Change: -13.1% | |
| EFSC Links: Profile News Message Board | |
| Charts:- Daily , Weekly | |
| Add EFSC to Watchlist: View: Get Complete EFSC Trend Analysis ➞ | |
 | NMRK Newmark Group, Inc. |
| Sector: Financials | |
| SubSector: Property Management | |
| MarketCap: 767.542 Millions | |
| Recent Price: 9.67 Smart Investing & Trading Score: 10 | |
| Day Percent Change: -1.12% Day Change: -0.11 | |
| Week Change: 0.83% Year-to-date Change: -11.8% | |
| NMRK Links: Profile News Message Board | |
| Charts:- Daily , Weekly | |
| Add NMRK to Watchlist: View: Get Complete NMRK Trend Analysis ➞ | |
 | EVER EverQuote, Inc. |
| Sector: Financials | |
| SubSector: Regional - Southeast Banks | |
| MarketCap: 767.135 Millions | |
| Recent Price: 19.57 Smart Investing & Trading Score: 68 | |
| Day Percent Change: 5.81% Day Change: 1.07 | |
| Week Change: 6.44% Year-to-date Change: 59.9% | |
| EVER Links: Profile News Message Board | |
| Charts:- Daily , Weekly | |
| Add EVER to Watchlist: View: Get Complete EVER Trend Analysis ➞ | |
 | NBHC National Bank Holdings Corporation |
| Sector: Financials | |
| SubSector: Regional - Midwest Banks | |
| MarketCap: 766.87 Millions | |
| Recent Price: 34.49 Smart Investing & Trading Score: 59 | |
| Day Percent Change: -0.89% Day Change: -0.31 | |
| Week Change: 1.47% Year-to-date Change: -7.3% | |
| NBHC Links: Profile News Message Board | |
| Charts:- Daily , Weekly | |
| Add NBHC to Watchlist: View: Get Complete NBHC Trend Analysis ➞ | |
 | SASR Sandy Spring Bancorp, Inc. |
| Sector: Financials | |
| SubSector: Regional - Mid-Atlantic Banks | |
| MarketCap: 764.659 Millions | |
| Recent Price: 21.36 Smart Investing & Trading Score: 74 | |
| Day Percent Change: -2.51% Day Change: -0.55 | |
| Week Change: 2.89% Year-to-date Change: -21.6% | |
| SASR Links: Profile News Message Board | |
| Charts:- Daily , Weekly | |
| Add SASR to Watchlist: View: Get Complete SASR Trend Analysis ➞ | |
 | PIPR Piper Sandler Companies |
| Sector: Financials | |
| SubSector: Asset Management | |
| MarketCap: 759.603 Millions | |
| Recent Price: 195.28 Smart Investing & Trading Score: 60 | |
| Day Percent Change: -0.16% Day Change: -0.32 | |
| Week Change: 5.12% Year-to-date Change: 11.7% | |
| PIPR Links: Profile News Message Board | |
| Charts:- Daily , Weekly | |
| Add PIPR to Watchlist: View: Get Complete PIPR Trend Analysis ➞ | |
 | NRDS NerdWallet, Inc. |
| Sector: Financials | |
| SubSector: Credit Services | |
| MarketCap: 759 Millions | |
| Recent Price: 13.73 Smart Investing & Trading Score: 35 | |
| Day Percent Change: -0.72% Day Change: -0.10 | |
| Week Change: 3.16% Year-to-date Change: -8.1% | |
| NRDS Links: Profile News Message Board | |
| Charts:- Daily , Weekly | |
| Add NRDS to Watchlist: View: Get Complete NRDS Trend Analysis ➞ | |
 | CADE Cadence Bancorporation |
| Sector: Financials | |
| SubSector: Regional - Southeast Banks | |
| MarketCap: 756.335 Millions | |
| Recent Price: 29.27 Smart Investing & Trading Score: 75 | |
| Day Percent Change: 1.33% Day Change: 0.38 | |
| Week Change: 7.75% Year-to-date Change: -1.1% | |
| CADE Links: Profile News Message Board | |
| Charts:- Daily , Weekly | |
| Add CADE to Watchlist: View: Get Complete CADE Trend Analysis ➞ | |
 | HFWA Heritage Financial Corporation |
| Sector: Financials | |
| SubSector: Regional - Pacific Banks | |
| MarketCap: 752.829 Millions | |
| Recent Price: 18.49 Smart Investing & Trading Score: 74 | |
| Day Percent Change: -0.75% Day Change: -0.14 | |
| Week Change: 1.76% Year-to-date Change: -13.6% | |
| HFWA Links: Profile News Message Board | |
| Charts:- Daily , Weekly | |
| Add HFWA to Watchlist: View: Get Complete HFWA Trend Analysis ➞ | |
 | ALEX Alexander & Baldwin, Inc. |
| Sector: Financials | |
| SubSector: Real Estate Development | |
| MarketCap: 751.419 Millions | |
| Recent Price: 16.06 Smart Investing & Trading Score: 47 | |
| Day Percent Change: -1.50% Day Change: -0.25 | |
| Week Change: -0.22% Year-to-date Change: -15.6% | |
| ALEX Links: Profile News Message Board | |
| Charts:- Daily , Weekly | |
| Add ALEX to Watchlist: View: Get Complete ALEX Trend Analysis ➞ | |
 | BRP BRP Group, Inc. |
| Sector: Financials | |
| SubSector: Real Estate Development | |
| MarketCap: 741.219 Millions | |
| Recent Price: 27.39 Smart Investing & Trading Score: 54 | |
| Day Percent Change: -2.18% Day Change: -0.61 | |
| Week Change: -0.69% Year-to-date Change: 14.0% | |
| BRP Links: Profile News Message Board | |
| Charts:- Daily , Weekly | |
| Add BRP to Watchlist: View: Get Complete BRP Trend Analysis ➞ | |
 | GABC German American Bancorp, Inc. |
| Sector: Financials | |
| SubSector: Regional - Midwest Banks | |
| MarketCap: 731.47 Millions | |
| Recent Price: 32.98 Smart Investing & Trading Score: 17 | |
| Day Percent Change: -0.74% Day Change: -0.24 | |
| Week Change: -0.56% Year-to-date Change: 1.7% | |
| GABC Links: Profile News Message Board | |
| Charts:- Daily , Weekly | |
| Add GABC to Watchlist: View: Get Complete GABC Trend Analysis ➞ | |
| For tabular summary view of above stock list: Summary View ➞ 0 - 25 , 25 - 50 , 50 - 75 , 75 - 100 , 100 - 125 , 125 - 150 , 150 - 175 , 175 - 200 , 200 - 225 , 225 - 250 , 250 - 275 , 275 - 300 , 300 - 325 , 325 - 350 , 350 - 375 , 375 - 400 | ||
| Click To Change The Sort Order: By Market Cap or Company Size Performance: Year-to-date, Week and Day | |
| Select Chart Type: | ||
| Too many stocks? View smallcap stocks filtered by marketcap & sector |
| Marketcap: All SmallCap Stocks (default-no microcap), Large, Mid-Range, Small & MicroCap |
| Sector: Tech, Finance, Energy, Staples, Retail, Industrial, Materials, Utilities & Medical |
|
Best Stocks Today 12Stocks.com |
© 2024 12Stocks.com Terms & Conditions Privacy Contact Us
All Information Provided Only For Education And Not To Be Used For Investing or Trading. See Terms & Conditions


One More Thing ... Get Best Stocks Delivered Daily!
Never Ever Miss A Move With Our Top Ten Stocks Lists
Find Best Stocks In Any Market - Bull or Bear Market
Take A Peek At Our Top Ten Stocks Lists: Daily, Weekly, Year-to-Date & Top Trends
Find Best Stocks In Any Market - Bull or Bear Market
Take A Peek At Our Top Ten Stocks Lists: Daily, Weekly, Year-to-Date & Top Trends
Smallcap Stocks With Best Up Trends [0-bearish to 100-bullish]: B. Riley[100], Ribbon [100], Group 1[100], Trustmark [100], Integer [100], MBIA [100], Uniti Group[100], Vishay Inter[100], EchoStar [100], Mueller Industries[100], Comstock Resources[100]
Best Smallcap Stocks Year-to-Date:
Janux [352.07%], Viking [250.51%], Alpine Immune[239.18%], Longboard [230.61%], Avidity Biosciences[176.77%], Arcutis Bio[176.63%], Super Micro[162.11%], Vera [149.61%], Hippo [131.72%], Stoke [123.1%], Y-mAbs [122.43%] Best Smallcap Stocks This Week:
Matterport [166.09%], B. Riley[50.78%], Riot Blockchain[31.11%], Seres [29.45%], Ribbon [27.71%], ProKidney [23.28%], SoundHound AI[22.54%], Cipher Mining[22.14%], Hibbett Sports[21.02%], Braemar Hotels[17.39%], BigBear.ai [17.24%] Best Smallcap Stocks Daily:
B. Riley[38.77%], Ribbon [28.21%], Babcock & Wilcox Enterprises[12.30%], Amneal [11.67%], Innodata [9.76%], Navitas Semiconductor[8.83%], Gritstone Oncology[8.54%], K12 [8.31%], Sage [8.19%], Cullinan Oncology[8.11%], Vigil Neuroscience[7.92%]