
 Login Sign Up


| |||||
 |  | ||||

| 12Stocks.com Market Intelligence |
Best SmallCap Stocks
|
| In a hurry? Small Cap Stock Lists: Performance Trends Table, Stock Charts
Sort Small Cap stocks: Daily, Weekly, Year-to-Date, Market Cap & Trends. Filter Small Cap stocks list by sector: Show all, Tech, Finance, Energy, Staples, Retail, Industrial, Materials, Utilities and HealthCare Filter Small Cap stocks list by size: All Large Medium Small and MicroCap |
| 12Stocks.com Small Cap Stocks Performances & Trends Daily | |||||||||
|
|  The overall Smart Investing & Trading Score is 23 (0-bearish to 100-bullish) which puts Small Cap index in short term bearish to neutral trend. The Smart Investing & Trading Score from previous trading session is 13 and an improvement of trend continues.
| ||||||||
Here are the Smart Investing & Trading Scores of the most requested small cap stocks at 12Stocks.com (click stock name for detailed review):
|


| 12Stocks.com: Investing in Smallcap Index with Stocks | |
|
The following table helps investors and traders sort through current performance and trends (as measured by Smart Investing & Trading Score) of various
stocks in the Smallcap Index. Quick View: Move mouse or cursor over stock symbol (ticker) to view short-term technical chart and over stock name to view long term chart. Click on  to add stock symbol to your watchlist and to add stock symbol to your watchlist and  to view watchlist. Click on any ticker or stock name for detailed market intelligence report for that stock. to view watchlist. Click on any ticker or stock name for detailed market intelligence report for that stock. |
12Stocks.com Performance of Stocks in Smallcap Index
| Ticker | Stock Name | Watchlist | Category | Recent Price | Smart Investing & Trading Score | Change % | YTD Change% |
| FFIC | Flushing Financial |   | Financials | 11.56 | 42 | 1.99% | -29.88% |
| MLR | Miller Industries | | Consumer Staples | 48.88 | 31 | -0.22% | 15.58% |
| BKKT | Bakkt | | Technology | 0.40 | 17 | -1.82% | -81.91% |
| RMAX | RE/MAX | | Financials | 7.21 | 42 | 0.91% | -45.95% |
| HCKT | Hackett Group | | Technology | 22.43 | 18 | -0.16% | -1.47% |
| TMDX | TransMedics Group | | Health Care | 87.08 | 61 | -0.19% | 10.32% |
| CRMT | America s | | Services & Goods | 57.31 | 32 | 2.05% | -24.36% |
| WOW | WideOpenWest | | Technology | 3.46 | 33 | 0.14% | -14.69% |
| SGRY | Surgery Partners | | Health Care | 23.97 | 10 | 2.35% | -25.07% |
| DX | Dynex Capital | | Financials | 11.62 | 32 | 1.18% | -7.23% |
| CVRX | CVRx | | Health Care | 14.72 | 0 | -7.01% | -53.21% |
| IMXI | Money | | Services & Goods | 21.52 | 61 | 0.80% | -2.58% |
| SENEA | Seneca Foods | | Consumer Staples | 57.21 | 85 | 0.76% | 9.10% |
| LMNR | Limoneira | | Consumer Staples | 19.37 | 58 | 0.26% | -6.11% |
| OII | Oceaneering | | Energy | 22.52 | 36 | 1.05% | 5.80% |
| AMAL | Amalgamated Bank | | Financials | 22.04 | 42 | 2.25% | -18.21% |
| VYGR | Voyager | | Health Care | 7.30 | 36 | -3.25% | -13.45% |
| VAXX | Vaxxinity | | Health Care | 0.45 | 25 | -1.59% | -46.11% |
| HAFC | Hanmi Financial | | Financials | 15.01 | 52 | 2.81% | -22.63% |
| CNSL | Consolidated | | Technology | 4.26 | 23 | 0.35% | -1.95% |
| GDYN | Grid Dynamics | | Technology | 10.37 | 10 | 1.37% | -22.21% |
| DHIL | Diamond Hill | | Financials | 150.38 | 45 | 1.33% | -9.19% |
| WSR | Whitestone REIT | | Financials | 11.14 | 32 | 1.78% | -9.40% |
| MPX | Marine Products | | Consumer Staples | 10.85 | 54 | -0.28% | -4.82% |
| NX | Quanex Building | | Industrials | 34.10 | 36 | -0.41% | 11.55% |


| Too many stocks? View smallcap stocks filtered by marketcap & sector |
| Marketcap: All SmallCap Stocks (default-no microcap), Large, Mid-Range, Small |
| Smallcap Sector: Tech, Finance, Energy, Staples, Retail, Industrial, Materials, & Medical |
|
Get the most comprehensive stock market coverage daily at 12Stocks.com ➞ Best Stocks Today ➞ Best Stocks Weekly ➞ Best Stocks Year-to-Date ➞ Best Stocks Trends ➞  Best Stocks Today 12Stocks.com Best Nasdaq Stocks ➞ Best S&P 500 Stocks ➞ Best Tech Stocks ➞ Best Biotech Stocks ➞ |
| Detailed Overview of SmallCap Stocks |
| SmallCap Technical Overview, Leaders & Laggards, Top SmallCap ETF Funds & Detailed SmallCap Stocks List, Charts, Trends & More |
| Smallcap: Technical Analysis, Trends & YTD Performance | |
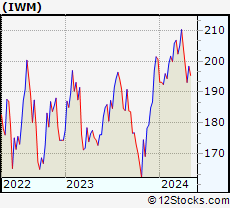
| SmallCap segment as represented by
IWM, an exchange-traded fund [ETF], holds basket of thousands of smallcap stocks from across all major sectors of the US stock market. The smallcap index (contains stocks like Riverbed & Sotheby's) is down by -4.52% and is currently underperforming the overall market by -7.67% year-to-date. Below is a quick view of technical charts and trends: | |
 IWM Weekly Chart |
|
| Long Term Trend: Not Good | |
| Medium Term Trend: Not Good | |
 IWM Daily Chart |
|
| Short Term Trend: Not Good | |
| Overall Trend Score: 23 | |
| YTD Performance: -4.52% | |
| **Trend Scores & Views Are Only For Educational Purposes And Not For Investing | |
| 12Stocks.com: Top Performing Small Cap Index Stocks | ||||||||||||||||||||||||||||||||||||||||||||||||
 The top performing Small Cap Index stocks year to date are
Now, more recently, over last week, the top performing Small Cap Index stocks on the move are


|
||||||||||||||||||||||||||||||||||||||||||||||||
| 12Stocks.com: Investing in Smallcap Index using Exchange Traded Funds | |
|
The following table shows list of key exchange traded funds (ETF) that
help investors track Smallcap index. The following list also includes leveraged ETF funds that track twice or thrice the daily returns of Smallcap indices. Short or inverse ETF funds move in the opposite direction to the index they track and are useful during market pullbacks or during bear markets. Quick View: Move mouse or cursor over ETF symbol (ticker) to view short-term technical chart and over ETF name to view long term chart. Click on ticker or stock name for detailed view. Click on to add stock symbol to your watchlist and to view watchlist. |
12Stocks.com List of ETFs that track Smallcap Index
| Ticker | ETF Name | Watchlist | Recent Price | Smart Investing & Trading Score | Change % | Week % | Year-to-date % |
| IWM | iShares Russell 2000 | | 191.63 | 23 | -0.63 | -3.55 | -4.52% |
| IWN | iShares Russell 2000 Value | | 146.63 | 10 | 0.21 | -2.49 | -5.6% |
| IJR | iShares Core S&P Small-Cap | | 102.51 | 10 | 0.16 | -1.92 | -5.31% |
| VTWO | Vanguard Russell 2000 ETF | | 77.48 | 23 | -0.60 | -3.53 | -4.46% |
| IWO | iShares Russell 2000 Growth | | 243.13 | 36 | -1.54 | -4.79 | -3.6% |
| IJS | iShares S&P Small-Cap 600 Value | | 95.00 | 17 | 0.52 | -1.22 | -7.83% |
| IJT | iShares S&P Small-Cap 600 Growth | | 122.10 | 23 | 0.44 | -2.15 | -2.43% |
| SAA | ProShares Ultra SmallCap600 | | 21.91 | 18 | 1.34 | -2.88 | -12.18% |
| XSLV | PowerShares S&P SmallCap Low Volatil ETF | | 42.07 | 17 | 1.01 | -0.05 | -4.71% |
| SMLV | SPDR SSGA US Small Cap Low Volatil ETF | | 105.89 | 32 | 1.98 | 0.84 | -5.89% |
| SDD | ProShares UltraShort SmallCap600 | | 20.32 | 76 | -1.79 | 2.47 | 10.28% |
| SBB | ProShares Short SmallCap600 | | 16.78 | 76 | -1.18 | 1.41 | 5.34% |
| 12Stocks.com: Charts, Trends, Fundamental Data and Performances of SmallCap Stocks | |
|
We now take in-depth look at all SmallCap stocks including charts, multi-period performances and overall trends (as measured by Smart Investing & Trading Score). One can sort SmallCap stocks (click link to choose) by Daily, Weekly and by Year-to-Date performances. Also, one can sort by size of the company or by market capitalization. |
| Select Your Default Chart Type: | |||||
| |||||
| Click on stock symbol or name for detailed view. Click on to add stock symbol to your watchlist and to view watchlist. Quick View: Move mouse or cursor over "Daily" to quickly view daily technical stock chart and over "Weekly" to view weekly technical stock chart. | |||||

 | FFIC Flushing Financial Corporation |
| Sector: Financials | |
| SubSector: Savings & Loans | |
| MarketCap: 336.43 Millions | |
| Recent Price: 11.56 Smart Investing & Trading Score: 42 | |
| Day Percent Change: 1.99% Day Change: 0.22 | |
| Week Change: 3.26% Year-to-date Change: -29.9% | |
| FFIC Links: Profile News Message Board | |
| Charts:- Daily , Weekly | |
| Add FFIC to Watchlist: View: Get Complete FFIC Trend Analysis ➞ | |
 | MLR Miller Industries, Inc. |
| Sector: Consumer Staples | |
| SubSector: Auto Parts | |
| MarketCap: 335.239 Millions | |
| Recent Price: 48.88 Smart Investing & Trading Score: 31 | |
| Day Percent Change: -0.22% Day Change: -0.11 | |
| Week Change: -2.78% Year-to-date Change: 15.6% | |
| MLR Links: Profile News Message Board | |
| Charts:- Daily , Weekly | |
| Add MLR to Watchlist: View: Get Complete MLR Trend Analysis ➞ | |
 | BKKT Bakkt Holdings, Inc. |
| Sector: Technology | |
| SubSector: Software - Infrastructure | |
| MarketCap: 335 Millions | |
| Recent Price: 0.40 Smart Investing & Trading Score: 17 | |
| Day Percent Change: -1.82% Day Change: -0.01 | |
| Week Change: -18% Year-to-date Change: -81.9% | |
| BKKT Links: Profile News Message Board | |
| Charts:- Daily , Weekly | |
| Add BKKT to Watchlist: View: Get Complete BKKT Trend Analysis ➞ | |
 | RMAX RE/MAX Holdings, Inc. |
| Sector: Financials | |
| SubSector: Property Management | |
| MarketCap: 334.742 Millions | |
| Recent Price: 7.21 Smart Investing & Trading Score: 42 | |
| Day Percent Change: 0.91% Day Change: 0.07 | |
| Week Change: -4.32% Year-to-date Change: -46.0% | |
| RMAX Links: Profile News Message Board | |
| Charts:- Daily , Weekly | |
| Add RMAX to Watchlist: View: Get Complete RMAX Trend Analysis ➞ | |
 | HCKT The Hackett Group, Inc. |
| Sector: Technology | |
| SubSector: Information Technology Services | |
| MarketCap: 334.468 Millions | |
| Recent Price: 22.43 Smart Investing & Trading Score: 18 | |
| Day Percent Change: -0.16% Day Change: -0.04 | |
| Week Change: -1.21% Year-to-date Change: -1.5% | |
| HCKT Links: Profile News Message Board | |
| Charts:- Daily , Weekly | |
| Add HCKT to Watchlist: View: Get Complete HCKT Trend Analysis ➞ | |
 | TMDX TransMedics Group, Inc. |
| Sector: Health Care | |
| SubSector: Medical Appliances & Equipment | |
| MarketCap: 331.68 Millions | |
| Recent Price: 87.08 Smart Investing & Trading Score: 61 | |
| Day Percent Change: -0.19% Day Change: -0.16 | |
| Week Change: -5.17% Year-to-date Change: 10.3% | |
| TMDX Links: Profile News Message Board | |
| Charts:- Daily , Weekly | |
| Add TMDX to Watchlist: View: Get Complete TMDX Trend Analysis ➞ | |
 | CRMT America s Car-Mart, Inc. |
| Sector: Services & Goods | |
| SubSector: Auto Dealerships | |
| MarketCap: 329.921 Millions | |
| Recent Price: 57.31 Smart Investing & Trading Score: 32 | |
| Day Percent Change: 2.05% Day Change: 1.15 | |
| Week Change: 1.15% Year-to-date Change: -24.4% | |
| CRMT Links: Profile News Message Board | |
| Charts:- Daily , Weekly | |
| Add CRMT to Watchlist: View: Get Complete CRMT Trend Analysis ➞ | |
 | WOW WideOpenWest, Inc. |
| Sector: Technology | |
| SubSector: CATV Systems | |
| MarketCap: 328.932 Millions | |
| Recent Price: 3.46 Smart Investing & Trading Score: 33 | |
| Day Percent Change: 0.14% Day Change: 0.00 | |
| Week Change: -5.08% Year-to-date Change: -14.7% | |
| WOW Links: Profile News Message Board | |
| Charts:- Daily , Weekly | |
| Add WOW to Watchlist: View: Get Complete WOW Trend Analysis ➞ | |
 | SGRY Surgery Partners, Inc. |
| Sector: Health Care | |
| SubSector: Hospitals | |
| MarketCap: 328.446 Millions | |
| Recent Price: 23.97 Smart Investing & Trading Score: 10 | |
| Day Percent Change: 2.35% Day Change: 0.55 | |
| Week Change: -8.96% Year-to-date Change: -25.1% | |
| SGRY Links: Profile News Message Board | |
| Charts:- Daily , Weekly | |
| Add SGRY to Watchlist: View: Get Complete SGRY Trend Analysis ➞ | |
 | DX Dynex Capital, Inc. |
| Sector: Financials | |
| SubSector: Mortgage Investment | |
| MarketCap: 327.839 Millions | |
| Recent Price: 11.62 Smart Investing & Trading Score: 32 | |
| Day Percent Change: 1.18% Day Change: 0.13 | |
| Week Change: -1.48% Year-to-date Change: -7.2% | |
| DX Links: Profile News Message Board | |
| Charts:- Daily , Weekly | |
| Add DX to Watchlist: View: Get Complete DX Trend Analysis ➞ | |
 | CVRX CVRx, Inc. |
| Sector: Health Care | |
| SubSector: Medical Devices | |
| MarketCap: 327 Millions | |
| Recent Price: 14.72 Smart Investing & Trading Score: 0 | |
| Day Percent Change: -7.01% Day Change: -1.11 | |
| Week Change: -14.57% Year-to-date Change: -53.2% | |
| CVRX Links: Profile News Message Board | |
| Charts:- Daily , Weekly | |
| Add CVRX to Watchlist: View: Get Complete CVRX Trend Analysis ➞ | |
 | IMXI International Money Express, Inc. |
| Sector: Services & Goods | |
| SubSector: Business Services | |
| MarketCap: 326.582 Millions | |
| Recent Price: 21.52 Smart Investing & Trading Score: 61 | |
| Day Percent Change: 0.80% Day Change: 0.17 | |
| Week Change: -0.88% Year-to-date Change: -2.6% | |
| IMXI Links: Profile News Message Board | |
| Charts:- Daily , Weekly | |
| Add IMXI to Watchlist: View: Get Complete IMXI Trend Analysis ➞ | |
 | SENEA Seneca Foods Corporation |
| Sector: Consumer Staples | |
| SubSector: Processed & Packaged Goods | |
| MarketCap: 326.348 Millions | |
| Recent Price: 57.21 Smart Investing & Trading Score: 85 | |
| Day Percent Change: 0.76% Day Change: 0.43 | |
| Week Change: 2.82% Year-to-date Change: 9.1% | |
| SENEA Links: Profile News Message Board | |
| Charts:- Daily , Weekly | |
| Add SENEA to Watchlist: View: Get Complete SENEA Trend Analysis ➞ | |
 | LMNR Limoneira Company |
| Sector: Consumer Staples | |
| SubSector: Farm Products | |
| MarketCap: 324.987 Millions | |
| Recent Price: 19.37 Smart Investing & Trading Score: 58 | |
| Day Percent Change: 0.26% Day Change: 0.05 | |
| Week Change: 0.36% Year-to-date Change: -6.1% | |
| LMNR Links: Profile News Message Board | |
| Charts:- Daily , Weekly | |
| Add LMNR to Watchlist: View: Get Complete LMNR Trend Analysis ➞ | |
 | OII Oceaneering International, Inc. |
| Sector: Energy | |
| SubSector: Oil & Gas Equipment & Services | |
| MarketCap: 324.061 Millions | |
| Recent Price: 22.52 Smart Investing & Trading Score: 36 | |
| Day Percent Change: 1.05% Day Change: 0.23 | |
| Week Change: -6.07% Year-to-date Change: 5.8% | |
| OII Links: Profile News Message Board | |
| Charts:- Daily , Weekly | |
| Add OII to Watchlist: View: Get Complete OII Trend Analysis ➞ | |
 | AMAL Amalgamated Bank |
| Sector: Financials | |
| SubSector: Regional - Northeast Banks | |
| MarketCap: 321.899 Millions | |
| Recent Price: 22.04 Smart Investing & Trading Score: 42 | |
| Day Percent Change: 2.25% Day Change: 0.48 | |
| Week Change: 0.25% Year-to-date Change: -18.2% | |
| AMAL Links: Profile News Message Board | |
| Charts:- Daily , Weekly | |
| Add AMAL to Watchlist: View: Get Complete AMAL Trend Analysis ➞ | |
 | VYGR Voyager Therapeutics, Inc. |
| Sector: Health Care | |
| SubSector: Biotechnology | |
| MarketCap: 321.085 Millions | |
| Recent Price: 7.30 Smart Investing & Trading Score: 36 | |
| Day Percent Change: -3.25% Day Change: -0.25 | |
| Week Change: -13.35% Year-to-date Change: -13.5% | |
| VYGR Links: Profile News Message Board | |
| Charts:- Daily , Weekly | |
| Add VYGR to Watchlist: View: Get Complete VYGR Trend Analysis ➞ | |
 | VAXX Vaxxinity, Inc. |
| Sector: Health Care | |
| SubSector: Biotechnology | |
| MarketCap: 320 Millions | |
| Recent Price: 0.45 Smart Investing & Trading Score: 25 | |
| Day Percent Change: -1.59% Day Change: -0.01 | |
| Week Change: -7.08% Year-to-date Change: -46.1% | |
| VAXX Links: Profile News Message Board | |
| Charts:- Daily , Weekly | |
| Add VAXX to Watchlist: View: Get Complete VAXX Trend Analysis ➞ | |
 | HAFC Hanmi Financial Corporation |
| Sector: Financials | |
| SubSector: Regional - Pacific Banks | |
| MarketCap: 319.929 Millions | |
| Recent Price: 15.01 Smart Investing & Trading Score: 52 | |
| Day Percent Change: 2.81% Day Change: 0.41 | |
| Week Change: 1.21% Year-to-date Change: -22.6% | |
| HAFC Links: Profile News Message Board | |
| Charts:- Daily , Weekly | |
| Add HAFC to Watchlist: View: Get Complete HAFC Trend Analysis ➞ | |
 | CNSL Consolidated Communications Holdings, Inc. |
| Sector: Technology | |
| SubSector: Telecom Services - Domestic | |
| MarketCap: 319.677 Millions | |
| Recent Price: 4.26 Smart Investing & Trading Score: 23 | |
| Day Percent Change: 0.35% Day Change: 0.01 | |
| Week Change: -0.58% Year-to-date Change: -2.0% | |
| CNSL Links: Profile News Message Board | |
| Charts:- Daily , Weekly | |
| Add CNSL to Watchlist: View: Get Complete CNSL Trend Analysis ➞ | |
 | GDYN Grid Dynamics Holdings, Inc. |
| Sector: Technology | |
| SubSector: Information Technology Services | |
| MarketCap: 318.968 Millions | |
| Recent Price: 10.37 Smart Investing & Trading Score: 10 | |
| Day Percent Change: 1.37% Day Change: 0.14 | |
| Week Change: -7% Year-to-date Change: -22.2% | |
| GDYN Links: Profile News Message Board | |
| Charts:- Daily , Weekly | |
| Add GDYN to Watchlist: View: Get Complete GDYN Trend Analysis ➞ | |
 | DHIL Diamond Hill Investment Group, Inc. |
| Sector: Financials | |
| SubSector: Asset Management | |
| MarketCap: 316.203 Millions | |
| Recent Price: 150.38 Smart Investing & Trading Score: 45 | |
| Day Percent Change: 1.33% Day Change: 1.98 | |
| Week Change: -0.13% Year-to-date Change: -9.2% | |
| DHIL Links: Profile News Message Board | |
| Charts:- Daily , Weekly | |
| Add DHIL to Watchlist: View: Get Complete DHIL Trend Analysis ➞ | |
 | WSR Whitestone REIT |
| Sector: Financials | |
| SubSector: REIT - Retail | |
| MarketCap: 316.114 Millions | |
| Recent Price: 11.14 Smart Investing & Trading Score: 32 | |
| Day Percent Change: 1.78% Day Change: 0.20 | |
| Week Change: 1.6% Year-to-date Change: -9.4% | |
| WSR Links: Profile News Message Board | |
| Charts:- Daily , Weekly | |
| Add WSR to Watchlist: View: Get Complete WSR Trend Analysis ➞ | |
 | MPX Marine Products Corporation |
| Sector: Consumer Staples | |
| SubSector: Recreational Vehicles | |
| MarketCap: 316.059 Millions | |
| Recent Price: 10.85 Smart Investing & Trading Score: 54 | |
| Day Percent Change: -0.28% Day Change: -0.03 | |
| Week Change: -1.99% Year-to-date Change: -4.8% | |
| MPX Links: Profile News Message Board | |
| Charts:- Daily , Weekly | |
| Add MPX to Watchlist: View: Get Complete MPX Trend Analysis ➞ | |
 | NX Quanex Building Products Corporation |
| Sector: Industrials | |
| SubSector: General Building Materials | |
| MarketCap: 315.453 Millions | |
| Recent Price: 34.10 Smart Investing & Trading Score: 36 | |
| Day Percent Change: -0.41% Day Change: -0.14 | |
| Week Change: -4.93% Year-to-date Change: 11.6% | |
| NX Links: Profile News Message Board | |
| Charts:- Daily , Weekly | |
| Add NX to Watchlist: View: Get Complete NX Trend Analysis ➞ | |
| Too many stocks? View smallcap stocks filtered by marketcap & sector |
| Marketcap: All SmallCap Stocks (default-no microcap), Large, Mid-Range, Small & MicroCap |
| Sector: Tech, Finance, Energy, Staples, Retail, Industrial, Materials, Utilities & Medical |
|
Best Stocks Today 12Stocks.com |
© 2024 12Stocks.com Terms & Conditions Privacy Contact Us
All Information Provided Only For Education And Not To Be Used For Investing or Trading. See Terms & Conditions


One More Thing ... Get Best Stocks Delivered Daily!
Never Ever Miss A Move With Our Top Ten Stocks Lists
Find Best Stocks In Any Market - Bull or Bear Market
Take A Peek At Our Top Ten Stocks Lists: Daily, Weekly, Year-to-Date & Top Trends
Find Best Stocks In Any Market - Bull or Bear Market
Take A Peek At Our Top Ten Stocks Lists: Daily, Weekly, Year-to-Date & Top Trends
Smallcap Stocks With Best Up Trends [0-bearish to 100-bullish]: Humacyte [100], Victory Capital[100], Cricut [100], Old Second[100], United Fire[100], Century Aluminum[100], Portland General[100], Tejon Ranch[100], Gannett Co[100], Lantheus [100], Target Hospitality[100]
Best Smallcap Stocks Year-to-Date:
Agenus [519.64%], CareMax [423.71%], Janux [336.95%], Alpine Immune[238.42%], Viking [231.81%], Longboard [194.11%], Arcutis Bio[184.06%], Super Micro[155.54%], Avidity Biosciences[153.65%], Vera [138.18%], Stoke [121.48%] Best Smallcap Stocks This Week:
Macatawa Bank[45.99%], Vertex Energy[43.75%], Snap One[29.61%], Vanda [24.76%], Humacyte [23.78%], ALX Oncology[22.49%], ContextLogic [20%], ProKidney [16.57%], Badger Meter[15.82%], Calavo Growers[14.44%], Accolade [13.45%] Best Smallcap Stocks Daily:
Origin Materials[20.44%], Metropolitan Bank[17.73%], Tellurian [17.66%], Vertex Energy[14.12%], Fossil Group[10.55%], Genelux [10.37%], Humacyte [9.86%], Riot Blockchain[9.11%], Cohen & Steers[8.81%], Chemung Financial[8.68%], Urban One[8.21%]