
 Login Sign Up


| |||||
 |  | ||||

| 12Stocks.com Market Intelligence |
Best SmallCap Stocks
|
| In a hurry? Small Cap Stock Lists: Performance Trends Table, Stock Charts
Sort Small Cap stocks: Daily, Weekly, Year-to-Date, Market Cap & Trends. Filter Small Cap stocks list by sector: Show all, Tech, Finance, Energy, Staples, Retail, Industrial, Materials, Utilities and HealthCare Filter Small Cap stocks list by size: All Large Medium Small and MicroCap |
| 12Stocks.com Small Cap Stocks Performances & Trends Daily | |||||||||
|
|  The overall Smart Investing & Trading Score is 58 (0-bearish to 100-bullish) which puts Small Cap index in short term neutral trend. The Smart Investing & Trading Score from previous trading session is 23 and hence an improvement of trend.
| ||||||||
Here are the Smart Investing & Trading Scores of the most requested small cap stocks at 12Stocks.com (click stock name for detailed review):
|


| 12Stocks.com: Investing in Smallcap Index with Stocks | |
|
The following table helps investors and traders sort through current performance and trends (as measured by Smart Investing & Trading Score) of various
stocks in the Smallcap Index. Quick View: Move mouse or cursor over stock symbol (ticker) to view short-term technical chart and over stock name to view long term chart. Click on  to add stock symbol to your watchlist and to add stock symbol to your watchlist and  to view watchlist. Click on any ticker or stock name for detailed market intelligence report for that stock. to view watchlist. Click on any ticker or stock name for detailed market intelligence report for that stock. |
12Stocks.com Performance of Stocks in Smallcap Index
| Ticker | Stock Name | Watchlist | Category | Recent Price | Smart Investing & Trading Score | Change % | YTD Change% |
| PKOH | Park-Ohio |   | Services & Goods | 23.55 | 32 | -1.46% | -12.65% |
| PAYS | PaySign | | Services & Goods | 4.28 | 51 | -1.83% | 52.86% |
| MCB | Metropolitan Bank | | Financials | 42.31 | 74 | 8.32% | -23.60% |
| ORC | Orchid Island | | Financials | 8.31 | 68 | 0.61% | -1.42% |
| TCBX | Third Coast | | Financials | 19.73 | 100 | 3.08% | -1.40% |
| NATH | Nathan s | | Services & Goods | 64.87 | 25 | -0.11% | -16.84% |
| NKSH | National Bankshares | | Financials | 30.10 | 49 | 4.95% | -6.96% |
| CRAI | CRA | | Services & Goods | 147.25 | 83 | 1.10% | 48.96% |
| TITN | Titan Machinery | | Services & Goods | 23.01 | 52 | -0.99% | -20.33% |
| IRMD | IRadimed | | Health Care | 42.28 | 83 | 3.13% | -10.92% |
| CHEF | Chefs | | Consumer Staples | 33.03 | 68 | 1.88% | 12.23% |
| EVI | EVI Industries | | Services & Goods | 21.82 | 25 | -0.73% | -8.05% |
| HBCP | Home Bancorp | | Financials | 35.15 | 49 | -2.60% | -16.33% |
| PDLB | PDL Community | | Financials | 8.45 | 64 | 1.20% | -13.42% |
| LLAP | Terran Orbital | | Industrials | 1.30 | 36 | 0.00% | 13.54% |
| QUAD | Quad/Graphics | | Services & Goods | 4.62 | 25 | -0.22% | -14.76% |
| CTO | Consolidated-Tomoka Land | | Financials | 17.09 | 100 | 0.65% | -1.38% |
| ADMA | ADMA Biologics | | Health Care | 6.20 | 75 | -1.12% | 37.17% |
| VGAS | Verde Clean | | Utilities | 4.59 | 51 | -0.22% | 97.00% |
| CDMO | Avid Bioservices | | Health Care | 6.41 | 32 | 0.00% | -1.38% |
| RUSHB | Rush Enterprises | | Services & Goods | 46.00 | 42 | -1.12% | -13.17% |
| RYI | Ryerson Holding | | Industrials | 32.14 | 35 | 0.44% | -7.32% |
| RYI | Ryerson Holding | | Industrials | 9.45 | 35 | 0.64% | -7.32% |
| AOMR | Angel Oak | | Financials | 11.62 | 100 | -0.17% | 9.52% |
| NWFL | Norwood Financial | | Financials | 24.90 | 49 | 2.51% | -24.34% |


| Too many stocks? View smallcap stocks filtered by marketcap & sector |
| Marketcap: All SmallCap Stocks (default-no microcap), Large, Mid-Range, Small |
| Smallcap Sector: Tech, Finance, Energy, Staples, Retail, Industrial, Materials, & Medical |
|
Get the most comprehensive stock market coverage daily at 12Stocks.com ➞ Best Stocks Today ➞ Best Stocks Weekly ➞ Best Stocks Year-to-Date ➞ Best Stocks Trends ➞  Best Stocks Today 12Stocks.com Best Nasdaq Stocks ➞ Best S&P 500 Stocks ➞ Best Tech Stocks ➞ Best Biotech Stocks ➞ |
| Detailed Overview of SmallCap Stocks |
| SmallCap Technical Overview, Leaders & Laggards, Top SmallCap ETF Funds & Detailed SmallCap Stocks List, Charts, Trends & More |
| Smallcap: Technical Analysis, Trends & YTD Performance | |
| SmallCap segment as represented by
IWM, an exchange-traded fund [ETF], holds basket of thousands of smallcap stocks from across all major sectors of the US stock market. The smallcap index (contains stocks like Riverbed & Sotheby's) is down by -2.7% and is currently underperforming the overall market by -7.09% year-to-date. Below is a quick view of technical charts and trends: | |
 IWM Weekly Chart |
|
| Long Term Trend: Good | |
| Medium Term Trend: Not Good | |
 IWM Daily Chart |
|
| Short Term Trend: Very Good | |
| Overall Trend Score: 58 | |
| YTD Performance: -2.7% | |
| **Trend Scores & Views Are Only For Educational Purposes And Not For Investing | |
| 12Stocks.com: Top Performing Small Cap Index Stocks | ||||||||||||||||||||||||||||||||||||||||||||||||
 The top performing Small Cap Index stocks year to date are
Now, more recently, over last week, the top performing Small Cap Index stocks on the move are


|
||||||||||||||||||||||||||||||||||||||||||||||||
| 12Stocks.com: Investing in Smallcap Index using Exchange Traded Funds | |
|
The following table shows list of key exchange traded funds (ETF) that
help investors track Smallcap index. The following list also includes leveraged ETF funds that track twice or thrice the daily returns of Smallcap indices. Short or inverse ETF funds move in the opposite direction to the index they track and are useful during market pullbacks or during bear markets. Quick View: Move mouse or cursor over ETF symbol (ticker) to view short-term technical chart and over ETF name to view long term chart. Click on ticker or stock name for detailed view. Click on to add stock symbol to your watchlist and to view watchlist. |
12Stocks.com List of ETFs that track Smallcap Index
| Ticker | ETF Name | Watchlist | Recent Price | Smart Investing & Trading Score | Change % | Week % | Year-to-date % |
| IWM | iShares Russell 2000 | | 195.30 | 58 | 1.12 | 1.12 | -2.7% |
| VTWO | Vanguard Russell 2000 ETF | | 78.92 | 58 | 1.08 | 1.08 | -2.69% |
| IWN | iShares Russell 2000 Value | | 149.51 | 63 | 1.17 | 1.17 | -3.75% |
| IJR | iShares Core S&P Small-Cap | | 103.47 | 45 | 0.24 | 0.24 | -4.42% |
| IWO | iShares Russell 2000 Growth | | 247.92 | 51 | 1.07 | 1.07 | -1.7% |
| IJS | iShares S&P Small-Cap 600 Value | | 96.43 | 32 | 0.86 | 0.86 | -6.44% |
| IJT | iShares S&P Small-Cap 600 Growth | | 123.36 | 70 | 0.94 | 0.94 | -1.42% |
| XSLV | PowerShares S&P SmallCap Low Volatil ETF | | 42.44 | 62 | 0.62 | 0.62 | -3.87% |
| SMLV | SPDR SSGA US Small Cap Low Volatil ETF | | 107.48 | 80 | 1.31 | 1.31 | -4.48% |
| SDD | ProShares UltraShort SmallCap600 | | 19.75 | 42 | -2.90 | -2.9 | 7.18% |
| SBB | ProShares Short SmallCap600 | | 16.62 | 42 | -1.31 | -1.31 | 4.33% |
| SAA | ProShares Ultra SmallCap600 | | 22.37 | 32 | 2.61 | 2.61 | -10.34% |
| 12Stocks.com: Charts, Trends, Fundamental Data and Performances of SmallCap Stocks | |
|
We now take in-depth look at all SmallCap stocks including charts, multi-period performances and overall trends (as measured by Smart Investing & Trading Score). One can sort SmallCap stocks (click link to choose) by Daily, Weekly and by Year-to-Date performances. Also, one can sort by size of the company or by market capitalization. |
| Select Your Default Chart Type: | |||||
| |||||
| Click on stock symbol or name for detailed view. Click on to add stock symbol to your watchlist and to view watchlist. Quick View: Move mouse or cursor over "Daily" to quickly view daily technical stock chart and over "Weekly" to view weekly technical stock chart. | |||||

 | PKOH Park-Ohio Holdings Corp. |
| Sector: Services & Goods | |
| SubSector: Industrial Equipment Wholesale | |
| MarketCap: 214.358 Millions | |
| Recent Price: 23.55 Smart Investing & Trading Score: 32 | |
| Day Percent Change: -1.46% Day Change: -0.35 | |
| Week Change: -1.46% Year-to-date Change: -12.7% | |
| PKOH Links: Profile News Message Board | |
| Charts:- Daily , Weekly | |
| Add PKOH to Watchlist: View: Get Complete PKOH Trend Analysis ➞ | |
 | PAYS PaySign, Inc. |
| Sector: Services & Goods | |
| SubSector: Business Services | |
| MarketCap: 213.882 Millions | |
| Recent Price: 4.28 Smart Investing & Trading Score: 51 | |
| Day Percent Change: -1.83% Day Change: -0.08 | |
| Week Change: -1.83% Year-to-date Change: 52.9% | |
| PAYS Links: Profile News Message Board | |
| Charts:- Daily , Weekly | |
| Add PAYS to Watchlist: View: Get Complete PAYS Trend Analysis ➞ | |
 | MCB Metropolitan Bank Holding Corp. |
| Sector: Financials | |
| SubSector: Regional - Northeast Banks | |
| MarketCap: 212.999 Millions | |
| Recent Price: 42.31 Smart Investing & Trading Score: 74 | |
| Day Percent Change: 8.32% Day Change: 3.25 | |
| Week Change: 8.32% Year-to-date Change: -23.6% | |
| MCB Links: Profile News Message Board | |
| Charts:- Daily , Weekly | |
| Add MCB to Watchlist: View: Get Complete MCB Trend Analysis ➞ | |
 | ORC Orchid Island Capital, Inc. |
| Sector: Financials | |
| SubSector: Mortgage Investment | |
| MarketCap: 212.339 Millions | |
| Recent Price: 8.31 Smart Investing & Trading Score: 68 | |
| Day Percent Change: 0.61% Day Change: 0.05 | |
| Week Change: 0.61% Year-to-date Change: -1.4% | |
| ORC Links: Profile News Message Board | |
| Charts:- Daily , Weekly | |
| Add ORC to Watchlist: View: Get Complete ORC Trend Analysis ➞ | |
 | TCBX Third Coast Bancshares, Inc. |
| Sector: Financials | |
| SubSector: Banks - Regional | |
| MarketCap: 212 Millions | |
| Recent Price: 19.73 Smart Investing & Trading Score: 100 | |
| Day Percent Change: 3.08% Day Change: 0.59 | |
| Week Change: 3.08% Year-to-date Change: -1.4% | |
| TCBX Links: Profile News Message Board | |
| Charts:- Daily , Weekly | |
| Add TCBX to Watchlist: View: Get Complete TCBX Trend Analysis ➞ | |
 | NATH Nathan s Famous, Inc. |
| Sector: Services & Goods | |
| SubSector: Restaurants | |
| MarketCap: 211.77 Millions | |
| Recent Price: 64.87 Smart Investing & Trading Score: 25 | |
| Day Percent Change: -0.11% Day Change: -0.07 | |
| Week Change: -0.11% Year-to-date Change: -16.8% | |
| NATH Links: Profile News Message Board | |
| Charts:- Daily , Weekly | |
| Add NATH to Watchlist: View: Get Complete NATH Trend Analysis ➞ | |
 | NKSH National Bankshares, Inc. |
| Sector: Financials | |
| SubSector: Regional - Mid-Atlantic Banks | |
| MarketCap: 209.759 Millions | |
| Recent Price: 30.10 Smart Investing & Trading Score: 49 | |
| Day Percent Change: 4.95% Day Change: 1.42 | |
| Week Change: 4.95% Year-to-date Change: -7.0% | |
| NKSH Links: Profile News Message Board | |
| Charts:- Daily , Weekly | |
| Add NKSH to Watchlist: View: Get Complete NKSH Trend Analysis ➞ | |
 | CRAI CRA International, Inc. |
| Sector: Services & Goods | |
| SubSector: Management Services | |
| MarketCap: 209.645 Millions | |
| Recent Price: 147.25 Smart Investing & Trading Score: 83 | |
| Day Percent Change: 1.10% Day Change: 1.60 | |
| Week Change: 1.1% Year-to-date Change: 49.0% | |
| CRAI Links: Profile News Message Board | |
| Charts:- Daily , Weekly | |
| Add CRAI to Watchlist: View: Get Complete CRAI Trend Analysis ➞ | |
 | TITN Titan Machinery Inc. |
| Sector: Services & Goods | |
| SubSector: Industrial Equipment Wholesale | |
| MarketCap: 208.958 Millions | |
| Recent Price: 23.01 Smart Investing & Trading Score: 52 | |
| Day Percent Change: -0.99% Day Change: -0.23 | |
| Week Change: -0.99% Year-to-date Change: -20.3% | |
| TITN Links: Profile News Message Board | |
| Charts:- Daily , Weekly | |
| Add TITN to Watchlist: View: Get Complete TITN Trend Analysis ➞ | |
 | IRMD IRadimed Corporation |
| Sector: Health Care | |
| SubSector: Medical Appliances & Equipment | |
| MarketCap: 207.78 Millions | |
| Recent Price: 42.28 Smart Investing & Trading Score: 83 | |
| Day Percent Change: 3.13% Day Change: 1.28 | |
| Week Change: 3.13% Year-to-date Change: -10.9% | |
| IRMD Links: Profile News Message Board | |
| Charts:- Daily , Weekly | |
| Add IRMD to Watchlist: View: Get Complete IRMD Trend Analysis ➞ | |
 | CHEF The Chefs Warehouse, Inc. |
| Sector: Consumer Staples | |
| SubSector: Food Wholesale | |
| MarketCap: 207.529 Millions | |
| Recent Price: 33.03 Smart Investing & Trading Score: 68 | |
| Day Percent Change: 1.88% Day Change: 0.61 | |
| Week Change: 1.88% Year-to-date Change: 12.2% | |
| CHEF Links: Profile News Message Board | |
| Charts:- Daily , Weekly | |
| Add CHEF to Watchlist: View: Get Complete CHEF Trend Analysis ➞ | |
 | EVI EVI Industries, Inc. |
| Sector: Services & Goods | |
| SubSector: Consumer Services | |
| MarketCap: 207.448 Millions | |
| Recent Price: 21.82 Smart Investing & Trading Score: 25 | |
| Day Percent Change: -0.73% Day Change: -0.16 | |
| Week Change: -0.73% Year-to-date Change: -8.1% | |
| EVI Links: Profile News Message Board | |
| Charts:- Daily , Weekly | |
| Add EVI to Watchlist: View: Get Complete EVI Trend Analysis ➞ | |
 | HBCP Home Bancorp, Inc. |
| Sector: Financials | |
| SubSector: Savings & Loans | |
| MarketCap: 206.83 Millions | |
| Recent Price: 35.15 Smart Investing & Trading Score: 49 | |
| Day Percent Change: -2.60% Day Change: -0.94 | |
| Week Change: -2.6% Year-to-date Change: -16.3% | |
| HBCP Links: Profile News Message Board | |
| Charts:- Daily , Weekly | |
| Add HBCP to Watchlist: View: Get Complete HBCP Trend Analysis ➞ | |
 | PDLB PDL Community Bancorp |
| Sector: Financials | |
| SubSector: REIT - Retail | |
| MarketCap: 206.114 Millions | |
| Recent Price: 8.45 Smart Investing & Trading Score: 64 | |
| Day Percent Change: 1.20% Day Change: 0.10 | |
| Week Change: 1.2% Year-to-date Change: -13.4% | |
| PDLB Links: Profile News Message Board | |
| Charts:- Daily , Weekly | |
| Add PDLB to Watchlist: View: Get Complete PDLB Trend Analysis ➞ | |
 | LLAP Terran Orbital Corporation |
| Sector: Industrials | |
| SubSector: Aerospace & Defense | |
| MarketCap: 206 Millions | |
| Recent Price: 1.30 Smart Investing & Trading Score: 36 | |
| Day Percent Change: 0.00% Day Change: 0.00 | |
| Week Change: 0% Year-to-date Change: 13.5% | |
| LLAP Links: Profile News Message Board | |
| Charts:- Daily , Weekly | |
| Add LLAP to Watchlist: View: Get Complete LLAP Trend Analysis ➞ | |
 | QUAD Quad/Graphics, Inc. |
| Sector: Services & Goods | |
| SubSector: Business Services | |
| MarketCap: 205.182 Millions | |
| Recent Price: 4.62 Smart Investing & Trading Score: 25 | |
| Day Percent Change: -0.22% Day Change: -0.01 | |
| Week Change: -0.22% Year-to-date Change: -14.8% | |
| QUAD Links: Profile News Message Board | |
| Charts:- Daily , Weekly | |
| Add QUAD to Watchlist: View: Get Complete QUAD Trend Analysis ➞ | |
 | CTO Consolidated-Tomoka Land Co. |
| Sector: Financials | |
| SubSector: Real Estate Development | |
| MarketCap: 205.119 Millions | |
| Recent Price: 17.09 Smart Investing & Trading Score: 100 | |
| Day Percent Change: 0.65% Day Change: 0.11 | |
| Week Change: 0.65% Year-to-date Change: -1.4% | |
| CTO Links: Profile News Message Board | |
| Charts:- Daily , Weekly | |
| Add CTO to Watchlist: View: Get Complete CTO Trend Analysis ➞ | |
 | ADMA ADMA Biologics, Inc. |
| Sector: Health Care | |
| SubSector: Biotechnology | |
| MarketCap: 204.985 Millions | |
| Recent Price: 6.20 Smart Investing & Trading Score: 75 | |
| Day Percent Change: -1.12% Day Change: -0.07 | |
| Week Change: -1.12% Year-to-date Change: 37.2% | |
| ADMA Links: Profile News Message Board | |
| Charts:- Daily , Weekly | |
| Add ADMA to Watchlist: View: Get Complete ADMA Trend Analysis ➞ | |
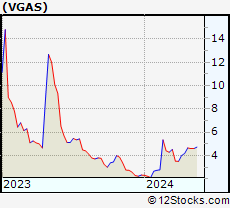 | VGAS Verde Clean Fuels, Inc. |
| Sector: Utilities | |
| SubSector: Utilities - Renewable | |
| MarketCap: 204 Millions | |
| Recent Price: 4.59 Smart Investing & Trading Score: 51 | |
| Day Percent Change: -0.22% Day Change: -0.01 | |
| Week Change: -0.22% Year-to-date Change: 97.0% | |
| VGAS Links: Profile News Message Board | |
| Charts:- Daily , Weekly | |
| Add VGAS to Watchlist: View: Get Complete VGAS Trend Analysis ➞ | |
 | CDMO Avid Bioservices, Inc. |
| Sector: Health Care | |
| SubSector: Biotechnology | |
| MarketCap: 203.685 Millions | |
| Recent Price: 6.41 Smart Investing & Trading Score: 32 | |
| Day Percent Change: 0.00% Day Change: 0.00 | |
| Week Change: 0% Year-to-date Change: -1.4% | |
| CDMO Links: Profile News Message Board | |
| Charts:- Daily , Weekly | |
| Add CDMO to Watchlist: View: Get Complete CDMO Trend Analysis ➞ | |
 | RUSHB Rush Enterprises, Inc. |
| Sector: Services & Goods | |
| SubSector: Auto Dealerships | |
| MarketCap: 203.221 Millions | |
| Recent Price: 46.00 Smart Investing & Trading Score: 42 | |
| Day Percent Change: -1.12% Day Change: -0.52 | |
| Week Change: -1.12% Year-to-date Change: -13.2% | |
| RUSHB Links: Profile News Message Board | |
| Charts:- Daily , Weekly | |
| Add RUSHB to Watchlist: View: Get Complete RUSHB Trend Analysis ➞ | |
 | RYI Ryerson Holding Corporation |
| Sector: Industrials | |
| SubSector: Metal Fabrication | |
| MarketCap: 202.55 Millions | |
| Recent Price: 32.14 Smart Investing & Trading Score: 35 | |
| Day Percent Change: 0.44% Day Change: 0.14 | |
| Week Change: 0.44% Year-to-date Change: -7.3% | |
| RYI Links: Profile News Message Board | |
| Charts:- Daily , Weekly | |
| Add RYI to Watchlist: View: Get Complete RYI Trend Analysis ➞ | |
| RYI Ryerson Holding Corporation |
| Sector: Industrials | |
| SubSector: Metal Fabrication | |
| MarketCap: 202.55 Millions | |
| Recent Price: 9.45 Smart Investing & Trading Score: 35 | |
| Day Percent Change: 0.64% Day Change: 0.06 | |
| Week Change: 0.44% Year-to-date Change: -7.3% | |
| RYI Links: Profile News Message Board | |
| Charts:- Daily , Weekly | |
| Add RYI to Watchlist: View: Get Complete RYI Trend Analysis ➞ | |
 | AOMR Angel Oak Mortgage REIT, Inc. |
| Sector: Financials | |
| SubSector: REIT - Mortgage | |
| MarketCap: 202 Millions | |
| Recent Price: 11.62 Smart Investing & Trading Score: 100 | |
| Day Percent Change: -0.17% Day Change: -0.02 | |
| Week Change: -0.17% Year-to-date Change: 9.5% | |
| AOMR Links: Profile News Message Board | |
| Charts:- Daily , Weekly | |
| Add AOMR to Watchlist: View: Get Complete AOMR Trend Analysis ➞ | |
 | NWFL Norwood Financial Corp. |
| Sector: Financials | |
| SubSector: Regional - Northeast Banks | |
| MarketCap: 201.899 Millions | |
| Recent Price: 24.90 Smart Investing & Trading Score: 49 | |
| Day Percent Change: 2.51% Day Change: 0.61 | |
| Week Change: 2.51% Year-to-date Change: -24.3% | |
| NWFL Links: Profile News Message Board | |
| Charts:- Daily , Weekly | |
| Add NWFL to Watchlist: View: Get Complete NWFL Trend Analysis ➞ | |
| Too many stocks? View smallcap stocks filtered by marketcap & sector |
| Marketcap: All SmallCap Stocks (default-no microcap), Large, Mid-Range, Small & MicroCap |
| Sector: Tech, Finance, Energy, Staples, Retail, Industrial, Materials, Utilities & Medical |
|
Best Stocks Today 12Stocks.com |
© 2024 12Stocks.com Terms & Conditions Privacy Contact Us
All Information Provided Only For Education And Not To Be Used For Investing or Trading. See Terms & Conditions


One More Thing ... Get Best Stocks Delivered Daily!
Never Ever Miss A Move With Our Top Ten Stocks Lists
Find Best Stocks In Any Market - Bull or Bear Market
Take A Peek At Our Top Ten Stocks Lists: Daily, Weekly, Year-to-Date & Top Trends
Find Best Stocks In Any Market - Bull or Bear Market
Take A Peek At Our Top Ten Stocks Lists: Daily, Weekly, Year-to-Date & Top Trends
Smallcap Stocks With Best Up Trends [0-bearish to 100-bullish]: Matterport [100], Riot Blockchain[100], Ingevity [100], Vista Outdoor[100], Park National[100], Maiden [100], Amplify Energy[100], Excelerate Energy[100], Perella Weinberg[100], Zuora [100], Vertex Energy[100]
Best Smallcap Stocks Year-to-Date:
CareMax [561.86%], Janux [354.91%], Alpine Immune[239.18%], Viking [237.13%], Longboard [205.56%], Arcutis Bio[176.78%], Avidity Biosciences[167.26%], Vera [152.78%], Super Micro[152.24%], Hippo [125.58%], Y-mAbs [122.29%] Best Smallcap Stocks This Week:
Matterport [175.86%], ProKidney [33.33%], CareMax [24.9%], Riot Blockchain[23.11%], Cipher Mining[18.75%], OptiNose [15.07%], Assertio [13.48%], MicroStrategy [12.77%], Vuzix [11.57%], Seres [11.56%], Energy Vault[11.11%] Best Smallcap Stocks Daily:
Matterport [175.86%], ProKidney [33.33%], CareMax [24.90%], Riot Blockchain[23.11%], Cipher Mining[18.75%], OptiNose [15.07%], Assertio [13.48%], MicroStrategy [12.77%], Vuzix [11.57%], Seres [11.56%], Energy Vault[11.11%]