
 Login Sign Up


| |||||
 |  | ||||

| 12Stocks.com Market Intelligence |
Best SmallCap Stocks
|
| In a hurry? Small Cap Stock Lists: Performance Trends Table, Stock Charts
Sort Small Cap stocks: Daily, Weekly, Year-to-Date, Market Cap & Trends. Filter Small Cap stocks list by sector: Show all, Tech, Finance, Energy, Staples, Retail, Industrial, Materials, Utilities and HealthCare Filter Small Cap stocks list by size: All Large Medium Small and MicroCap |
| 12Stocks.com Small Cap Stocks Performances & Trends Daily | |||||||||
|
|  The overall Smart Investing & Trading Score is 23 (0-bearish to 100-bullish) which puts Small Cap index in short term bearish to neutral trend. The Smart Investing & Trading Score from previous trading session is 13 and hence an improvement of trend.
| ||||||||
Here are the Smart Investing & Trading Scores of the most requested small cap stocks at 12Stocks.com (click stock name for detailed review):
|


| 12Stocks.com: Investing in Smallcap Index with Stocks | |
|
The following table helps investors and traders sort through current performance and trends (as measured by Smart Investing & Trading Score) of various
stocks in the Smallcap Index. Quick View: Move mouse or cursor over stock symbol (ticker) to view short-term technical chart and over stock name to view long term chart. Click on  to add stock symbol to your watchlist and to add stock symbol to your watchlist and  to view watchlist. Click on any ticker or stock name for detailed market intelligence report for that stock. to view watchlist. Click on any ticker or stock name for detailed market intelligence report for that stock. |
12Stocks.com Performance of Stocks in Smallcap Index
| Ticker | Stock Name | Watchlist | Category | Recent Price | Smart Investing & Trading Score | Change % | YTD Change% |
| EHAB | Enhabit |   | Health Care | 10.30 | 53 | 1.38% | -0.48% |
| BE | Bloom Energy | | Utilities | 9.75 | 10 | -0.51% | -34.12% |
| UHG | United Homes | | Services & Goods | 6.36 | 27 | 0.79% | -24.20% |
| PATK | Patrick Industries | | Industrials | 102.64 | 36 | -1.50% | 2.28% |
| PGEN | Precigen | | Health Care | 1.32 | 0 | 0.76% | -1.49% |
| SLP | Simulations Plus | | Technology | 44.41 | 51 | -2.09% | -0.76% |
| TBI | TrueBlue | | Services & Goods | 10.45 | 10 | 0.48% | -31.88% |
| MBUU | Malibu Boats | | Consumer Staples | 34.16 | 0 | 0.59% | -37.69% |
| TTGT | TechTarget | | Technology | 27.25 | 20 | -0.66% | -21.83% |
| PFBC | Preferred Bank | | Financials | 72.24 | 41 | 0.99% | -1.11% |
| NTGR | NETGEAR | | Technology | 14.15 | 28 | 1.36% | -2.95% |
| TCX | Tucows | | Technology | 17.47 | 27 | -0.17% | -35.30% |
| IMVT | Immunovant | | Health Care | 28.32 | 10 | -0.39% | -32.78% |
| CAC | Camden National | | Financials | 28.71 | 10 | 0.21% | -23.70% |
| AHH | Armada Hoffler | | Financials | 10.23 | 45 | 1.19% | -17.30% |
| LRN | K12 | | Services & Goods | 57.26 | 10 | -0.54% | -3.55% |
| ARCH | Arch Coal | | Materials | 162.82 | 45 | -0.90% | -1.88% |
| RES | RPC | | Energy | 7.80 | 68 | 1.96% | 7.14% |
| TG | Tredegar | | Materials | 6.47 | 51 | 2.05% | 19.59% |
| CSTL | Castle Biosciences | | Health Care | 19.20 | 23 | 1.91% | -11.03% |
| TRST | TrustCo Bank | | Financials | 25.96 | 20 | 0.19% | -16.39% |
| AGM | Federal Agricultural | | Financials | 180.36 | 18 | 0.25% | -5.68% |
| ARDX | Ardelyx | | Health Care | 6.44 | 0 | -1.68% | 3.87% |
| SCSC | ScanSource | | Technology | 40.50 | 44 | 1.05% | 2.25% |
| NFBK | Northfield Bancorp | | Financials | 8.13 | 10 | -0.12% | -35.37% |


| Too many stocks? View smallcap stocks filtered by marketcap & sector |
| Marketcap: All SmallCap Stocks (default-no microcap), Large, Mid-Range, Small |
| Smallcap Sector: Tech, Finance, Energy, Staples, Retail, Industrial, Materials, & Medical |
|
Get the most comprehensive stock market coverage daily at 12Stocks.com ➞ Best Stocks Today ➞ Best Stocks Weekly ➞ Best Stocks Year-to-Date ➞ Best Stocks Trends ➞  Best Stocks Today 12Stocks.com Best Nasdaq Stocks ➞ Best S&P 500 Stocks ➞ Best Tech Stocks ➞ Best Biotech Stocks ➞ |
| Detailed Overview of SmallCap Stocks |
| SmallCap Technical Overview, Leaders & Laggards, Top SmallCap ETF Funds & Detailed SmallCap Stocks List, Charts, Trends & More |
| Smallcap: Technical Analysis, Trends & YTD Performance | |
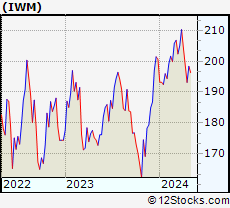
| SmallCap segment as represented by
IWM, an exchange-traded fund [ETF], holds basket of thousands of smallcap stocks from across all major sectors of the US stock market. The smallcap index (contains stocks like Riverbed & Sotheby's) is down by -3.92% and is currently underperforming the overall market by -8.11% year-to-date. Below is a quick view of technical charts and trends: | |
 IWM Weekly Chart |
|
| Long Term Trend: Not Good | |
| Medium Term Trend: Not Good | |
 IWM Daily Chart |
|
| Short Term Trend: Not Good | |
| Overall Trend Score: 23 | |
| YTD Performance: -3.92% | |
| **Trend Scores & Views Are Only For Educational Purposes And Not For Investing | |
| 12Stocks.com: Top Performing Small Cap Index Stocks | ||||||||||||||||||||||||||||||||||||||||||||||||
 The top performing Small Cap Index stocks year to date are
Now, more recently, over last week, the top performing Small Cap Index stocks on the move are


|
||||||||||||||||||||||||||||||||||||||||||||||||
| 12Stocks.com: Investing in Smallcap Index using Exchange Traded Funds | |
|
The following table shows list of key exchange traded funds (ETF) that
help investors track Smallcap index. The following list also includes leveraged ETF funds that track twice or thrice the daily returns of Smallcap indices. Short or inverse ETF funds move in the opposite direction to the index they track and are useful during market pullbacks or during bear markets. Quick View: Move mouse or cursor over ETF symbol (ticker) to view short-term technical chart and over ETF name to view long term chart. Click on ticker or stock name for detailed view. Click on to add stock symbol to your watchlist and to view watchlist. |
12Stocks.com List of ETFs that track Smallcap Index
| Ticker | ETF Name | Watchlist | Recent Price | Smart Investing & Trading Score | Change % | Week % | Year-to-date % |
| IWM | iShares Russell 2000 | | 192.84 | 23 | -0.08 | -2.94 | -3.92% |
| IJR | iShares Core S&P Small-Cap | | 102.34 | 10 | 0.21 | -2.08 | -5.46% |
| VTWO | Vanguard Russell 2000 ETF | | 77.95 | 23 | -0.13 | -2.95 | -3.88% |
| IWN | iShares Russell 2000 Value | | 146.33 | 10 | 0.21 | -2.69 | -5.79% |
| IJS | iShares S&P Small-Cap 600 Value | | 94.51 | 18 | 0.41 | -1.73 | -8.31% |
| IWO | iShares Russell 2000 Growth | | 246.94 | 36 | -0.44 | -3.3 | -2.09% |
| IJT | iShares S&P Small-Cap 600 Growth | | 121.57 | 13 | -0.22 | -2.57 | -2.85% |
| XSLV | PowerShares S&P SmallCap Low Volatil ETF | | 41.65 | 25 | 0.56 | -1.05 | -5.66% |
| SAA | ProShares Ultra SmallCap600 | | 21.62 | 10 | -0.18 | -4.17 | -13.35% |
| SMLV | SPDR SSGA US Small Cap Low Volatil ETF | | 103.83 | 10 | 0.16 | -1.13 | -7.72% |
| SBB | ProShares Short SmallCap600 | | 16.98 | 100 | 0.77 | 2.62 | 6.59% |
| SDD | ProShares UltraShort SmallCap600 | | 20.69 | 95 | 0.44 | 4.33 | 12.28% |
| 12Stocks.com: Charts, Trends, Fundamental Data and Performances of SmallCap Stocks | |
|
We now take in-depth look at all SmallCap stocks including charts, multi-period performances and overall trends (as measured by Smart Investing & Trading Score). One can sort SmallCap stocks (click link to choose) by Daily, Weekly and by Year-to-Date performances. Also, one can sort by size of the company or by market capitalization. |
| Select Your Default Chart Type: | |||||
| |||||
| Click on stock symbol or name for detailed view. Click on to add stock symbol to your watchlist and to view watchlist. Quick View: Move mouse or cursor over "Daily" to quickly view daily technical stock chart and over "Weekly" to view weekly technical stock chart. | |||||

 | EHAB Enhabit, Inc. |
| Sector: Health Care | |
| SubSector: Medical Care Facilities | |
| MarketCap: 569 Millions | |
| Recent Price: 10.30 Smart Investing & Trading Score: 53 | |
| Day Percent Change: 1.38% Day Change: 0.14 | |
| Week Change: -0.96% Year-to-date Change: -0.5% | |
| EHAB Links: Profile News Message Board | |
| Charts:- Daily , Weekly | |
| Add EHAB to Watchlist: View: Get Complete EHAB Trend Analysis ➞ | |
 | BE Bloom Energy Corporation |
| Sector: Utilities | |
| SubSector: Electric Utilities | |
| MarketCap: 567.514 Millions | |
| Recent Price: 9.75 Smart Investing & Trading Score: 10 | |
| Day Percent Change: -0.51% Day Change: -0.05 | |
| Week Change: -9.22% Year-to-date Change: -34.1% | |
| BE Links: Profile News Message Board | |
| Charts:- Daily , Weekly | |
| Add BE to Watchlist: View: Get Complete BE Trend Analysis ➞ | |
 | UHG United Homes Group, Inc. |
| Sector: Services & Goods | |
| SubSector: Residential Construction | |
| MarketCap: 566 Millions | |
| Recent Price: 6.36 Smart Investing & Trading Score: 27 | |
| Day Percent Change: 0.79% Day Change: 0.05 | |
| Week Change: 5.82% Year-to-date Change: -24.2% | |
| UHG Links: Profile News Message Board | |
| Charts:- Daily , Weekly | |
| Add UHG to Watchlist: View: Get Complete UHG Trend Analysis ➞ | |
 | PATK Patrick Industries, Inc. |
| Sector: Industrials | |
| SubSector: Lumber, Wood Production | |
| MarketCap: 565.838 Millions | |
| Recent Price: 102.64 Smart Investing & Trading Score: 36 | |
| Day Percent Change: -1.50% Day Change: -1.56 | |
| Week Change: -4.16% Year-to-date Change: 2.3% | |
| PATK Links: Profile News Message Board | |
| Charts:- Daily , Weekly | |
| Add PATK to Watchlist: View: Get Complete PATK Trend Analysis ➞ | |
 | PGEN Precigen, Inc. |
| Sector: Health Care | |
| SubSector: Biotechnology | |
| MarketCap: 564.785 Millions | |
| Recent Price: 1.32 Smart Investing & Trading Score: 0 | |
| Day Percent Change: 0.76% Day Change: 0.01 | |
| Week Change: -7.04% Year-to-date Change: -1.5% | |
| PGEN Links: Profile News Message Board | |
| Charts:- Daily , Weekly | |
| Add PGEN to Watchlist: View: Get Complete PGEN Trend Analysis ➞ | |
 | SLP Simulations Plus, Inc. |
| Sector: Technology | |
| SubSector: Business Software & Services | |
| MarketCap: 564.258 Millions | |
| Recent Price: 44.41 Smart Investing & Trading Score: 51 | |
| Day Percent Change: -2.09% Day Change: -0.95 | |
| Week Change: -4.37% Year-to-date Change: -0.8% | |
| SLP Links: Profile News Message Board | |
| Charts:- Daily , Weekly | |
| Add SLP to Watchlist: View: Get Complete SLP Trend Analysis ➞ | |
 | TBI TrueBlue, Inc. |
| Sector: Services & Goods | |
| SubSector: Staffing & Outsourcing Services | |
| MarketCap: 563.228 Millions | |
| Recent Price: 10.45 Smart Investing & Trading Score: 10 | |
| Day Percent Change: 0.48% Day Change: 0.05 | |
| Week Change: -3.69% Year-to-date Change: -31.9% | |
| TBI Links: Profile News Message Board | |
| Charts:- Daily , Weekly | |
| Add TBI to Watchlist: View: Get Complete TBI Trend Analysis ➞ | |
 | MBUU Malibu Boats, Inc. |
| Sector: Consumer Staples | |
| SubSector: Recreational Goods, Other | |
| MarketCap: 561.059 Millions | |
| Recent Price: 34.16 Smart Investing & Trading Score: 0 | |
| Day Percent Change: 0.59% Day Change: 0.20 | |
| Week Change: -11.23% Year-to-date Change: -37.7% | |
| MBUU Links: Profile News Message Board | |
| Charts:- Daily , Weekly | |
| Add MBUU to Watchlist: View: Get Complete MBUU Trend Analysis ➞ | |
 | TTGT TechTarget, Inc. |
| Sector: Technology | |
| SubSector: Internet Information Providers | |
| MarketCap: 560.78 Millions | |
| Recent Price: 27.25 Smart Investing & Trading Score: 20 | |
| Day Percent Change: -0.66% Day Change: -0.18 | |
| Week Change: -2.29% Year-to-date Change: -21.8% | |
| TTGT Links: Profile News Message Board | |
| Charts:- Daily , Weekly | |
| Add TTGT to Watchlist: View: Get Complete TTGT Trend Analysis ➞ | |
 | PFBC Preferred Bank |
| Sector: Financials | |
| SubSector: Regional - Pacific Banks | |
| MarketCap: 559.629 Millions | |
| Recent Price: 72.24 Smart Investing & Trading Score: 41 | |
| Day Percent Change: 0.99% Day Change: 0.71 | |
| Week Change: -1.51% Year-to-date Change: -1.1% | |
| PFBC Links: Profile News Message Board | |
| Charts:- Daily , Weekly | |
| Add PFBC to Watchlist: View: Get Complete PFBC Trend Analysis ➞ | |
 | NTGR NETGEAR, Inc. |
| Sector: Technology | |
| SubSector: Communication Equipment | |
| MarketCap: 558.839 Millions | |
| Recent Price: 14.15 Smart Investing & Trading Score: 28 | |
| Day Percent Change: 1.36% Day Change: 0.19 | |
| Week Change: -3.61% Year-to-date Change: -3.0% | |
| NTGR Links: Profile News Message Board | |
| Charts:- Daily , Weekly | |
| Add NTGR to Watchlist: View: Get Complete NTGR Trend Analysis ➞ | |
 | TCX Tucows Inc. |
| Sector: Technology | |
| SubSector: Internet Information Providers | |
| MarketCap: 557.78 Millions | |
| Recent Price: 17.47 Smart Investing & Trading Score: 27 | |
| Day Percent Change: -0.17% Day Change: -0.03 | |
| Week Change: -3% Year-to-date Change: -35.3% | |
| TCX Links: Profile News Message Board | |
| Charts:- Daily , Weekly | |
| Add TCX to Watchlist: View: Get Complete TCX Trend Analysis ➞ | |
 | IMVT Immunovant, Inc. |
| Sector: Health Care | |
| SubSector: Biotechnology | |
| MarketCap: 552.885 Millions | |
| Recent Price: 28.32 Smart Investing & Trading Score: 10 | |
| Day Percent Change: -0.39% Day Change: -0.11 | |
| Week Change: -3.51% Year-to-date Change: -32.8% | |
| IMVT Links: Profile News Message Board | |
| Charts:- Daily , Weekly | |
| Add IMVT to Watchlist: View: Get Complete IMVT Trend Analysis ➞ | |
 | CAC Camden National Corporation |
| Sector: Financials | |
| SubSector: Regional - Northeast Banks | |
| MarketCap: 550.999 Millions | |
| Recent Price: 28.71 Smart Investing & Trading Score: 10 | |
| Day Percent Change: 0.21% Day Change: 0.06 | |
| Week Change: -2.05% Year-to-date Change: -23.7% | |
| CAC Links: Profile News Message Board | |
| Charts:- Daily , Weekly | |
| Add CAC to Watchlist: View: Get Complete CAC Trend Analysis ➞ | |
 | AHH Armada Hoffler Properties, Inc. |
| Sector: Financials | |
| SubSector: REIT - Diversified | |
| MarketCap: 550.653 Millions | |
| Recent Price: 10.23 Smart Investing & Trading Score: 45 | |
| Day Percent Change: 1.19% Day Change: 0.12 | |
| Week Change: -1.25% Year-to-date Change: -17.3% | |
| AHH Links: Profile News Message Board | |
| Charts:- Daily , Weekly | |
| Add AHH to Watchlist: View: Get Complete AHH Trend Analysis ➞ | |
 | LRN K12 Inc. |
| Sector: Services & Goods | |
| SubSector: Education & Training Services | |
| MarketCap: 549.606 Millions | |
| Recent Price: 57.26 Smart Investing & Trading Score: 10 | |
| Day Percent Change: -0.54% Day Change: -0.31 | |
| Week Change: -3.16% Year-to-date Change: -3.6% | |
| LRN Links: Profile News Message Board | |
| Charts:- Daily , Weekly | |
| Add LRN to Watchlist: View: Get Complete LRN Trend Analysis ➞ | |
 | ARCH Arch Coal, Inc. |
| Sector: Materials | |
| SubSector: Industrial Metals & Minerals | |
| MarketCap: 547.21 Millions | |
| Recent Price: 162.82 Smart Investing & Trading Score: 45 | |
| Day Percent Change: -0.90% Day Change: -1.48 | |
| Week Change: 3.79% Year-to-date Change: -1.9% | |
| ARCH Links: Profile News Message Board | |
| Charts:- Daily , Weekly | |
| Add ARCH to Watchlist: View: Get Complete ARCH Trend Analysis ➞ | |
 | RES RPC, Inc. |
| Sector: Energy | |
| SubSector: Oil & Gas Equipment & Services | |
| MarketCap: 546.261 Millions | |
| Recent Price: 7.80 Smart Investing & Trading Score: 68 | |
| Day Percent Change: 1.96% Day Change: 0.15 | |
| Week Change: -0.89% Year-to-date Change: 7.1% | |
| RES Links: Profile News Message Board | |
| Charts:- Daily , Weekly | |
| Add RES to Watchlist: View: Get Complete RES Trend Analysis ➞ | |
 | TG Tredegar Corporation |
| Sector: Materials | |
| SubSector: Specialty Chemicals | |
| MarketCap: 545.057 Millions | |
| Recent Price: 6.47 Smart Investing & Trading Score: 51 | |
| Day Percent Change: 2.05% Day Change: 0.13 | |
| Week Change: 0.31% Year-to-date Change: 19.6% | |
| TG Links: Profile News Message Board | |
| Charts:- Daily , Weekly | |
| Add TG to Watchlist: View: Get Complete TG Trend Analysis ➞ | |
 | CSTL Castle Biosciences, Inc. |
| Sector: Health Care | |
| SubSector: Medical Laboratories & Research | |
| MarketCap: 545 Millions | |
| Recent Price: 19.20 Smart Investing & Trading Score: 23 | |
| Day Percent Change: 1.91% Day Change: 0.36 | |
| Week Change: -4.29% Year-to-date Change: -11.0% | |
| CSTL Links: Profile News Message Board | |
| Charts:- Daily , Weekly | |
| Add CSTL to Watchlist: View: Get Complete CSTL Trend Analysis ➞ | |
 | TRST TrustCo Bank Corp NY |
| Sector: Financials | |
| SubSector: Regional - Northeast Banks | |
| MarketCap: 543.999 Millions | |
| Recent Price: 25.96 Smart Investing & Trading Score: 20 | |
| Day Percent Change: 0.19% Day Change: 0.05 | |
| Week Change: -1.1% Year-to-date Change: -16.4% | |
| TRST Links: Profile News Message Board | |
| Charts:- Daily , Weekly | |
| Add TRST to Watchlist: View: Get Complete TRST Trend Analysis ➞ | |
 | AGM Federal Agricultural Mortgage Corporation |
| Sector: Financials | |
| SubSector: Credit Services | |
| MarketCap: 542.008 Millions | |
| Recent Price: 180.36 Smart Investing & Trading Score: 18 | |
| Day Percent Change: 0.25% Day Change: 0.45 | |
| Week Change: -0.85% Year-to-date Change: -5.7% | |
| AGM Links: Profile News Message Board | |
| Charts:- Daily , Weekly | |
| Add AGM to Watchlist: View: Get Complete AGM Trend Analysis ➞ | |
 | ARDX Ardelyx, Inc. |
| Sector: Health Care | |
| SubSector: Biotechnology | |
| MarketCap: 541.985 Millions | |
| Recent Price: 6.44 Smart Investing & Trading Score: 0 | |
| Day Percent Change: -1.68% Day Change: -0.11 | |
| Week Change: -8.78% Year-to-date Change: 3.9% | |
| ARDX Links: Profile News Message Board | |
| Charts:- Daily , Weekly | |
| Add ARDX to Watchlist: View: Get Complete ARDX Trend Analysis ➞ | |
 | SCSC ScanSource, Inc. |
| Sector: Technology | |
| SubSector: Technical & System Software | |
| MarketCap: 541 Millions | |
| Recent Price: 40.50 Smart Investing & Trading Score: 44 | |
| Day Percent Change: 1.05% Day Change: 0.42 | |
| Week Change: -0.71% Year-to-date Change: 2.3% | |
| SCSC Links: Profile News Message Board | |
| Charts:- Daily , Weekly | |
| Add SCSC to Watchlist: View: Get Complete SCSC Trend Analysis ➞ | |
 | NFBK Northfield Bancorp, Inc. (Staten Island, NY) |
| Sector: Financials | |
| SubSector: Regional - Northeast Banks | |
| MarketCap: 540.699 Millions | |
| Recent Price: 8.13 Smart Investing & Trading Score: 10 | |
| Day Percent Change: -0.12% Day Change: -0.01 | |
| Week Change: -2.87% Year-to-date Change: -35.4% | |
| NFBK Links: Profile News Message Board | |
| Charts:- Daily , Weekly | |
| Add NFBK to Watchlist: View: Get Complete NFBK Trend Analysis ➞ | |
| Too many stocks? View smallcap stocks filtered by marketcap & sector |
| Marketcap: All SmallCap Stocks (default-no microcap), Large, Mid-Range, Small & MicroCap |
| Sector: Tech, Finance, Energy, Staples, Retail, Industrial, Materials, Utilities & Medical |
|
Best Stocks Today 12Stocks.com |
© 2024 12Stocks.com Terms & Conditions Privacy Contact Us
All Information Provided Only For Education And Not To Be Used For Investing or Trading. See Terms & Conditions


One More Thing ... Get Best Stocks Delivered Daily!
Never Ever Miss A Move With Our Top Ten Stocks Lists
Find Best Stocks In Any Market - Bull or Bear Market
Take A Peek At Our Top Ten Stocks Lists: Daily, Weekly, Year-to-Date & Top Trends
Find Best Stocks In Any Market - Bull or Bear Market
Take A Peek At Our Top Ten Stocks Lists: Daily, Weekly, Year-to-Date & Top Trends
Smallcap Stocks With Best Up Trends [0-bearish to 100-bullish]: Badger Meter[100], Cullinan Oncology[100], Oscar Health[100], NextNav [100], EchoStar [100], Victory Capital[100], Macatawa Bank[100], IMAX [100], Envestnet [100], ALX Oncology[100], Argan [95]
Best Smallcap Stocks Year-to-Date:
Agenus [500.31%], CareMax [417.53%], Janux [348.12%], Viking [247.5%], Alpine Immune[238.5%], Super Micro[226.63%], Longboard [194.76%], Arcutis Bio[192.57%], Vera [161.3%], Avidity Biosciences[154.87%], Hippo [128.32%] Best Smallcap Stocks This Week:
Macatawa Bank[44.42%], 23andMe Holding[33.3%], ProKidney [32%], Snap One[29.73%], Vertex Energy[25.96%], ALX Oncology[20.64%], Vanda [20.63%], Expensify [18.37%], Badger Meter[16.72%], ContextLogic [15%], Cullinan Oncology[13.89%] Best Smallcap Stocks Daily:
23andMe Holding[65.91%], Vertex Energy[33.78%], Zura Bio[17.20%], Badger Meter[16.65%], ContextLogic [15.81%], Expensify [15.23%], Montrose Environmental[12.84%], Vaxxinity [10.05%], Cipher Mining[8.65%], FiscalNote [8.61%], Vuzix [8.15%]