
 Login Sign Up


| |||||
 |  | ||||

| 12Stocks.com Market Intelligence |
Best SmallCap Stocks
|
| In a hurry? Small Cap Stock Lists: Performance Trends Table, Stock Charts
Sort Small Cap stocks: Daily, Weekly, Year-to-Date, Market Cap & Trends. Filter Small Cap stocks list by sector: Show all, Tech, Finance, Energy, Staples, Retail, Industrial, Materials, Utilities and HealthCare Filter Small Cap stocks list by size: All Large Medium Small and MicroCap |
| 12Stocks.com Small Cap Stocks Performances & Trends Daily | |||||||||
|
|  The overall Smart Investing & Trading Score is 58 (0-bearish to 100-bullish) which puts Small Cap index in short term neutral trend. The Smart Investing & Trading Score from previous trading session is 23 and an improvement of trend continues.
| ||||||||
Here are the Smart Investing & Trading Scores of the most requested small cap stocks at 12Stocks.com (click stock name for detailed review):
|


| 12Stocks.com: Investing in Smallcap Index with Stocks | |
|
The following table helps investors and traders sort through current performance and trends (as measured by Smart Investing & Trading Score) of various
stocks in the Smallcap Index. Quick View: Move mouse or cursor over stock symbol (ticker) to view short-term technical chart and over stock name to view long term chart. Click on  to add stock symbol to your watchlist and to add stock symbol to your watchlist and  to view watchlist. Click on any ticker or stock name for detailed market intelligence report for that stock. to view watchlist. Click on any ticker or stock name for detailed market intelligence report for that stock. |
12Stocks.com Performance of Stocks in Smallcap Index
| Ticker | Stock Name | Watchlist | Category | Recent Price | Smart Investing & Trading Score | Change % | YTD Change% |
| FELE | Franklin Electric |   | Industrials | 103.47 | 75 | 1.40% | 7.06% |
| THS | TreeHouse Foods | | Consumer Staples | 36.88 | 59 | 0.59% | -11.01% |
| HALO | Halozyme | | Health Care | 39.17 | 75 | 1.19% | 5.98% |
| JBLU | JetBlue Airways | | Transports | 6.29 | 88 | -16.18% | 13.42% |
| TARO | Taro Pharmaceutical | | Health Care | 42.25 | 22 | -0.02% | 1.12% |
| TWKS | Thoughtworks Holding | | Technology | 2.41 | 74 | -0.82% | -50.41% |
| INDB | Independent Bank | | Financials | 52.21 | 74 | 2.80% | -20.67% |
| ONB | Old National | | Financials | 16.66 | 59 | 1.18% | -1.39% |
| LZ | LegalZoom.com | | Industrials | 12.23 | 63 | 0.99% | 7.71% |
| SHEN | Shenandoah Tele | | Technology | 14.04 | 10 | 0.36% | -35.06% |
| PCH | PotlatchDeltic | | Industrials | 41.90 | 25 | 1.33% | -14.66% |
| ALKS | Alkermes | | Health Care | 24.59 | 32 | 2.16% | -11.36% |
| BOH | Bank of Hawaii | | Financials | 58.28 | 35 | -0.22% | -19.57% |
| BMBL | Bumble | | Technology | 10.35 | 62 | -0.05% | -30.38% |
| UBSI | United Bankshares | | Financials | 34.81 | 74 | 1.10% | -7.30% |
| SMTC | Semtech | | Technology | 32.73 | 55 | 2.06% | 49.38% |
| AXSM | Axsome | | Health Care | 72.50 | 49 | 1.88% | -8.91% |
| DFH | Dream Finders | | Services & Goods | 35.66 | 43 | 4.44% | -0.96% |
| AGTI | Agiliti | | Health Care | 10.05 | 68 | -0.05% | 27.47% |
| UFPI | Universal Forest | | Industrials | 113.65 | 45 | 0.95% | -9.48% |
| ITRI | Itron | | Technology | 93.89 | 83 | 2.66% | 24.35% |
| WAFD | Washington Federal | | Financials | 28.11 | 74 | 0.02% | -14.70% |
| EVCM | EverCommerce | | Technology | 9.31 | 64 | 2.31% | -16.31% |
| UMBF | UMB Financial | | Financials | 84.89 | 93 | 1.59% | 1.60% |
| JBT | John Bean | | Industrials | 90.91 | 25 | 0.61% | -8.59% |
| For chart view version of above stock list: Chart View ➞ 0 - 25 , 25 - 50 , 50 - 75 , 75 - 100 , 100 - 125 , 125 - 150 , 150 - 175 , 175 - 200 , 200 - 225 , 225 - 250 , 250 - 275 , 275 - 300 , 300 - 325 , 325 - 350 , 350 - 375 , 375 - 400 , 400 - 425 , 425 - 450 , 450 - 475 , 475 - 500 , 500 - 525 , 525 - 550 , 550 - 575 , 575 - 600 , 600 - 625 , 625 - 650 , 650 - 675 , 675 - 700 , 700 - 725 , 725 - 750 , 750 - 775 , 775 - 800 , 800 - 825 , 825 - 850 , 850 - 875 , 875 - 900 , 900 - 925 , 925 - 950 , 950 - 975 , 975 - 1000 , 1000 - 1025 , 1025 - 1050 , 1050 - 1075 , 1075 - 1100 , 1100 - 1125 , 1125 - 1150 , 1150 - 1175 , 1175 - 1200 , 1200 - 1225 , 1225 - 1250 , 1250 - 1275 , 1275 - 1300 , 1300 - 1325 , 1325 - 1350 , 1350 - 1375 | ||
 | Click To Change The Sort Order: By Market Cap or Company Size Performance: Year-to-date, Week and Day |  |
| Too many stocks? View smallcap stocks filtered by marketcap & sector |
| Marketcap: All SmallCap Stocks (default-no microcap), Large, Mid-Range, Small |
| Smallcap Sector: Tech, Finance, Energy, Staples, Retail, Industrial, Materials, & Medical |
|
Get the most comprehensive stock market coverage daily at 12Stocks.com ➞ Best Stocks Today ➞ Best Stocks Weekly ➞ Best Stocks Year-to-Date ➞ Best Stocks Trends ➞  Best Stocks Today 12Stocks.com Best Nasdaq Stocks ➞ Best S&P 500 Stocks ➞ Best Tech Stocks ➞ Best Biotech Stocks ➞ |
| Detailed Overview of SmallCap Stocks |
| SmallCap Technical Overview, Leaders & Laggards, Top SmallCap ETF Funds & Detailed SmallCap Stocks List, Charts, Trends & More |
| Smallcap: Technical Analysis, Trends & YTD Performance | |
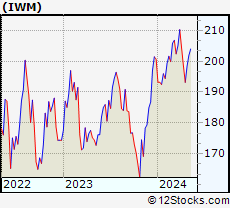
| SmallCap segment as represented by
IWM, an exchange-traded fund [ETF], holds basket of thousands of smallcap stocks from across all major sectors of the US stock market. The smallcap index (contains stocks like Riverbed & Sotheby's) is down by -1.27% and is currently underperforming the overall market by -6.76% year-to-date. Below is a quick view of technical charts and trends: | |
 IWM Weekly Chart |
|
| Long Term Trend: Good | |
| Medium Term Trend: Not Good | |
 IWM Daily Chart |
|
| Short Term Trend: Very Good | |
| Overall Trend Score: 58 | |
| YTD Performance: -1.27% | |
| **Trend Scores & Views Are Only For Educational Purposes And Not For Investing | |
| 12Stocks.com: Top Performing Small Cap Index Stocks | ||||||||||||||||||||||||||||||||||||||||||||||||
 The top performing Small Cap Index stocks year to date are
Now, more recently, over last week, the top performing Small Cap Index stocks on the move are


|
||||||||||||||||||||||||||||||||||||||||||||||||
| 12Stocks.com: Investing in Smallcap Index using Exchange Traded Funds | |
|
The following table shows list of key exchange traded funds (ETF) that
help investors track Smallcap index. The following list also includes leveraged ETF funds that track twice or thrice the daily returns of Smallcap indices. Short or inverse ETF funds move in the opposite direction to the index they track and are useful during market pullbacks or during bear markets. Quick View: Move mouse or cursor over ETF symbol (ticker) to view short-term technical chart and over ETF name to view long term chart. Click on ticker or stock name for detailed view. Click on to add stock symbol to your watchlist and to view watchlist. |
12Stocks.com List of ETFs that track Smallcap Index
| Ticker | ETF Name | Watchlist | Recent Price | Smart Investing & Trading Score | Change % | Week % | Year-to-date % |
| IWM | iShares Russell 2000 | | 198.16 | 58 | 1.46 | 2.6 | -1.27% |
| VTWO | Vanguard Russell 2000 ETF | | 80.14 | 65 | 1.54 | 2.63 | -1.19% |
| IJR | iShares Core S&P Small-Cap | | 105.44 | 45 | 1.91 | 2.16 | -2.59% |
| IWN | iShares Russell 2000 Value | | 151.50 | 63 | 1.33 | 2.52 | -2.47% |
| IWO | iShares Russell 2000 Growth | | 252.16 | 51 | 1.71 | 2.8 | -0.02% |
| IJS | iShares S&P Small-Cap 600 Value | | 97.77 | 39 | 1.39 | 2.26 | -5.14% |
| IJT | iShares S&P Small-Cap 600 Growth | | 123.36 | 70 | 0.00 | 0.94 | -1.42% |
| XSLV | PowerShares S&P SmallCap Low Volatil ETF | | 42.95 | 62 | 1.21 | 1.84 | -2.71% |
| SMLV | SPDR SSGA US Small Cap Low Volatil ETF | | 107.10 | 73 | -0.35 | 0.95 | -4.82% |
| 12Stocks.com: Charts, Trends, Fundamental Data and Performances of SmallCap Stocks | |
|
We now take in-depth look at all SmallCap stocks including charts, multi-period performances and overall trends (as measured by Smart Investing & Trading Score). One can sort SmallCap stocks (click link to choose) by Daily, Weekly and by Year-to-Date performances. Also, one can sort by size of the company or by market capitalization. |
| Select Your Default Chart Type: | |||||
| |||||
| Click on stock symbol or name for detailed view. Click on to add stock symbol to your watchlist and to view watchlist. Quick View: Move mouse or cursor over "Daily" to quickly view daily technical stock chart and over "Weekly" to view weekly technical stock chart. | |||||

 | FELE Franklin Electric Co., Inc. |
| Sector: Industrials | |
| SubSector: Industrial Electrical Equipment | |
| MarketCap: 2397.89 Millions | |
| Recent Price: 103.47 Smart Investing & Trading Score: 75 | |
| Day Percent Change: 1.40% Day Change: 1.42 | |
| Week Change: 2.01% Year-to-date Change: 7.1% | |
| FELE Links: Profile News Message Board | |
| Charts:- Daily , Weekly | |
| Add FELE to Watchlist: View: Get Complete FELE Trend Analysis ➞ | |
 | THS TreeHouse Foods, Inc. |
| Sector: Consumer Staples | |
| SubSector: Processed & Packaged Goods | |
| MarketCap: 2392.08 Millions | |
| Recent Price: 36.88 Smart Investing & Trading Score: 59 | |
| Day Percent Change: 0.59% Day Change: 0.21 | |
| Week Change: 0.39% Year-to-date Change: -11.0% | |
| THS Links: Profile News Message Board | |
| Charts:- Daily , Weekly | |
| Add THS to Watchlist: View: Get Complete THS Trend Analysis ➞ | |
 | HALO Halozyme Therapeutics, Inc. |
| Sector: Health Care | |
| SubSector: Biotechnology | |
| MarketCap: 2383.75 Millions | |
| Recent Price: 39.17 Smart Investing & Trading Score: 75 | |
| Day Percent Change: 1.19% Day Change: 0.46 | |
| Week Change: 1.37% Year-to-date Change: 6.0% | |
| HALO Links: Profile News Message Board | |
| Charts:- Daily , Weekly | |
| Add HALO to Watchlist: View: Get Complete HALO Trend Analysis ➞ | |
 | JBLU JetBlue Airways Corporation |
| Sector: Transports | |
| SubSector: Regional Airlines | |
| MarketCap: 2383.1 Millions | |
| Recent Price: 6.29 Smart Investing & Trading Score: 88 | |
| Day Percent Change: -16.18% Day Change: -1.21 | |
| Week Change: -11.46% Year-to-date Change: 13.4% | |
| JBLU Links: Profile News Message Board | |
| Charts:- Daily , Weekly | |
| Add JBLU to Watchlist: View: Get Complete JBLU Trend Analysis ➞ | |
 | TARO Taro Pharmaceutical Industries Ltd. |
| Sector: Health Care | |
| SubSector: Drug Manufacturers - Other | |
| MarketCap: 2379.33 Millions | |
| Recent Price: 42.25 Smart Investing & Trading Score: 22 | |
| Day Percent Change: -0.02% Day Change: -0.01 | |
| Week Change: 0% Year-to-date Change: 1.1% | |
| TARO Links: Profile News Message Board | |
| Charts:- Daily , Weekly | |
| Add TARO to Watchlist: View: Get Complete TARO Trend Analysis ➞ | |
 | TWKS Thoughtworks Holding, Inc. |
| Sector: Technology | |
| SubSector: Information Technology Services | |
| MarketCap: 2370 Millions | |
| Recent Price: 2.41 Smart Investing & Trading Score: 74 | |
| Day Percent Change: -0.82% Day Change: -0.02 | |
| Week Change: 3.88% Year-to-date Change: -50.4% | |
| TWKS Links: Profile News Message Board | |
| Charts:- Daily , Weekly | |
| Add TWKS to Watchlist: View: Get Complete TWKS Trend Analysis ➞ | |
 | INDB Independent Bank Corp. |
| Sector: Financials | |
| SubSector: Regional - Northeast Banks | |
| MarketCap: 2347.09 Millions | |
| Recent Price: 52.21 Smart Investing & Trading Score: 74 | |
| Day Percent Change: 2.80% Day Change: 1.42 | |
| Week Change: 3.26% Year-to-date Change: -20.7% | |
| INDB Links: Profile News Message Board | |
| Charts:- Daily , Weekly | |
| Add INDB to Watchlist: View: Get Complete INDB Trend Analysis ➞ | |
 | ONB Old National Bancorp |
| Sector: Financials | |
| SubSector: Regional - Midwest Banks | |
| MarketCap: 2340.8 Millions | |
| Recent Price: 16.66 Smart Investing & Trading Score: 59 | |
| Day Percent Change: 1.18% Day Change: 0.20 | |
| Week Change: 2.87% Year-to-date Change: -1.4% | |
| ONB Links: Profile News Message Board | |
| Charts:- Daily , Weekly | |
| Add ONB to Watchlist: View: Get Complete ONB Trend Analysis ➞ | |
 | LZ LegalZoom.com, Inc. |
| Sector: Industrials | |
| SubSector: Specialty Business Services | |
| MarketCap: 2330 Millions | |
| Recent Price: 12.23 Smart Investing & Trading Score: 63 | |
| Day Percent Change: 0.99% Day Change: 0.12 | |
| Week Change: 4.26% Year-to-date Change: 7.7% | |
| LZ Links: Profile News Message Board | |
| Charts:- Daily , Weekly | |
| Add LZ to Watchlist: View: Get Complete LZ Trend Analysis ➞ | |
 | SHEN Shenandoah Telecommunications Company |
| Sector: Technology | |
| SubSector: Telecom Services - Domestic | |
| MarketCap: 2329.67 Millions | |
| Recent Price: 14.04 Smart Investing & Trading Score: 10 | |
| Day Percent Change: 0.36% Day Change: 0.05 | |
| Week Change: -4.42% Year-to-date Change: -35.1% | |
| SHEN Links: Profile News Message Board | |
| Charts:- Daily , Weekly | |
| Add SHEN to Watchlist: View: Get Complete SHEN Trend Analysis ➞ | |
 | PCH PotlatchDeltic Corporation |
| Sector: Industrials | |
| SubSector: Lumber, Wood Production | |
| MarketCap: 2314.68 Millions | |
| Recent Price: 41.90 Smart Investing & Trading Score: 25 | |
| Day Percent Change: 1.33% Day Change: 0.55 | |
| Week Change: 1.72% Year-to-date Change: -14.7% | |
| PCH Links: Profile News Message Board | |
| Charts:- Daily , Weekly | |
| Add PCH to Watchlist: View: Get Complete PCH Trend Analysis ➞ | |
 | ALKS Alkermes plc |
| Sector: Health Care | |
| SubSector: Biotechnology | |
| MarketCap: 2311.95 Millions | |
| Recent Price: 24.59 Smart Investing & Trading Score: 32 | |
| Day Percent Change: 2.16% Day Change: 0.52 | |
| Week Change: 3.1% Year-to-date Change: -11.4% | |
| ALKS Links: Profile News Message Board | |
| Charts:- Daily , Weekly | |
| Add ALKS to Watchlist: View: Get Complete ALKS Trend Analysis ➞ | |
 | BOH Bank of Hawaii Corporation |
| Sector: Financials | |
| SubSector: Regional - Pacific Banks | |
| MarketCap: 2305.19 Millions | |
| Recent Price: 58.28 Smart Investing & Trading Score: 35 | |
| Day Percent Change: -0.22% Day Change: -0.13 | |
| Week Change: -0.21% Year-to-date Change: -19.6% | |
| BOH Links: Profile News Message Board | |
| Charts:- Daily , Weekly | |
| Add BOH to Watchlist: View: Get Complete BOH Trend Analysis ➞ | |
 | BMBL Bumble Inc. |
| Sector: Technology | |
| SubSector: Software - Application | |
| MarketCap: 2290 Millions | |
| Recent Price: 10.35 Smart Investing & Trading Score: 62 | |
| Day Percent Change: -0.05% Day Change: 0.00 | |
| Week Change: 1.62% Year-to-date Change: -30.4% | |
| BMBL Links: Profile News Message Board | |
| Charts:- Daily , Weekly | |
| Add BMBL to Watchlist: View: Get Complete BMBL Trend Analysis ➞ | |
 | UBSI United Bankshares, Inc. |
| Sector: Financials | |
| SubSector: Regional - Mid-Atlantic Banks | |
| MarketCap: 2286.79 Millions | |
| Recent Price: 34.81 Smart Investing & Trading Score: 74 | |
| Day Percent Change: 1.10% Day Change: 0.38 | |
| Week Change: 1.87% Year-to-date Change: -7.3% | |
| UBSI Links: Profile News Message Board | |
| Charts:- Daily , Weekly | |
| Add UBSI to Watchlist: View: Get Complete UBSI Trend Analysis ➞ | |
 | SMTC Semtech Corporation |
| Sector: Technology | |
| SubSector: Semiconductor - Integrated Circuits | |
| MarketCap: 2285 Millions | |
| Recent Price: 32.73 Smart Investing & Trading Score: 55 | |
| Day Percent Change: 2.06% Day Change: 0.66 | |
| Week Change: 5.41% Year-to-date Change: 49.4% | |
| SMTC Links: Profile News Message Board | |
| Charts:- Daily , Weekly | |
| Add SMTC to Watchlist: View: Get Complete SMTC Trend Analysis ➞ | |
 | AXSM Axsome Therapeutics, Inc. |
| Sector: Health Care | |
| SubSector: Biotechnology | |
| MarketCap: 2284.25 Millions | |
| Recent Price: 72.50 Smart Investing & Trading Score: 49 | |
| Day Percent Change: 1.88% Day Change: 1.34 | |
| Week Change: 6.77% Year-to-date Change: -8.9% | |
| AXSM Links: Profile News Message Board | |
| Charts:- Daily , Weekly | |
| Add AXSM to Watchlist: View: Get Complete AXSM Trend Analysis ➞ | |
 | DFH Dream Finders Homes, Inc. |
| Sector: Services & Goods | |
| SubSector: Residential Construction | |
| MarketCap: 2270 Millions | |
| Recent Price: 35.66 Smart Investing & Trading Score: 43 | |
| Day Percent Change: 4.44% Day Change: 1.52 | |
| Week Change: 5.52% Year-to-date Change: -1.0% | |
| DFH Links: Profile News Message Board | |
| Charts:- Daily , Weekly | |
| Add DFH to Watchlist: View: Get Complete DFH Trend Analysis ➞ | |
 | AGTI Agiliti, Inc. |
| Sector: Health Care | |
| SubSector: Health Information Services | |
| MarketCap: 2270 Millions | |
| Recent Price: 10.05 Smart Investing & Trading Score: 68 | |
| Day Percent Change: -0.05% Day Change: -0.01 | |
| Week Change: 0.05% Year-to-date Change: 27.5% | |
| AGTI Links: Profile News Message Board | |
| Charts:- Daily , Weekly | |
| Add AGTI to Watchlist: View: Get Complete AGTI Trend Analysis ➞ | |
 | UFPI Universal Forest Products, Inc. |
| Sector: Industrials | |
| SubSector: Lumber, Wood Production | |
| MarketCap: 2263.38 Millions | |
| Recent Price: 113.65 Smart Investing & Trading Score: 45 | |
| Day Percent Change: 0.95% Day Change: 1.07 | |
| Week Change: 1.66% Year-to-date Change: -9.5% | |
| UFPI Links: Profile News Message Board | |
| Charts:- Daily , Weekly | |
| Add UFPI to Watchlist: View: Get Complete UFPI Trend Analysis ➞ | |
 | ITRI Itron, Inc. |
| Sector: Technology | |
| SubSector: Scientific & Technical Instruments | |
| MarketCap: 2222.23 Millions | |
| Recent Price: 93.89 Smart Investing & Trading Score: 83 | |
| Day Percent Change: 2.66% Day Change: 2.44 | |
| Week Change: 4.7% Year-to-date Change: 24.4% | |
| ITRI Links: Profile News Message Board | |
| Charts:- Daily , Weekly | |
| Add ITRI to Watchlist: View: Get Complete ITRI Trend Analysis ➞ | |
 | WAFD Washington Federal, Inc. |
| Sector: Financials | |
| SubSector: Savings & Loans | |
| MarketCap: 2219.2 Millions | |
| Recent Price: 28.11 Smart Investing & Trading Score: 74 | |
| Day Percent Change: 0.02% Day Change: 0.00 | |
| Week Change: 0.77% Year-to-date Change: -14.7% | |
| WAFD Links: Profile News Message Board | |
| Charts:- Daily , Weekly | |
| Add WAFD to Watchlist: View: Get Complete WAFD Trend Analysis ➞ | |
 | EVCM EverCommerce Inc. |
| Sector: Technology | |
| SubSector: Software - Infrastructure | |
| MarketCap: 2210 Millions | |
| Recent Price: 9.31 Smart Investing & Trading Score: 64 | |
| Day Percent Change: 2.31% Day Change: 0.21 | |
| Week Change: 5.44% Year-to-date Change: -16.3% | |
| EVCM Links: Profile News Message Board | |
| Charts:- Daily , Weekly | |
| Add EVCM to Watchlist: View: Get Complete EVCM Trend Analysis ➞ | |
 | UMBF UMB Financial Corporation |
| Sector: Financials | |
| SubSector: Regional - Southwest Banks | |
| MarketCap: 2207.35 Millions | |
| Recent Price: 84.89 Smart Investing & Trading Score: 93 | |
| Day Percent Change: 1.59% Day Change: 1.33 | |
| Week Change: 4.24% Year-to-date Change: 1.6% | |
| UMBF Links: Profile News Message Board | |
| Charts:- Daily , Weekly | |
| Add UMBF to Watchlist: View: Get Complete UMBF Trend Analysis ➞ | |
 | JBT John Bean Technologies Corporation |
| Sector: Industrials | |
| SubSector: Diversified Machinery | |
| MarketCap: 2197.36 Millions | |
| Recent Price: 90.91 Smart Investing & Trading Score: 25 | |
| Day Percent Change: 0.61% Day Change: 0.55 | |
| Week Change: -0.87% Year-to-date Change: -8.6% | |
| JBT Links: Profile News Message Board | |
| Charts:- Daily , Weekly | |
| Add JBT to Watchlist: View: Get Complete JBT Trend Analysis ➞ | |
| For tabular summary view of above stock list: Summary View ➞ 0 - 25 , 25 - 50 , 50 - 75 , 75 - 100 , 100 - 125 , 125 - 150 , 150 - 175 , 175 - 200 , 200 - 225 , 225 - 250 , 250 - 275 , 275 - 300 , 300 - 325 , 325 - 350 , 350 - 375 , 375 - 400 , 400 - 425 , 425 - 450 , 450 - 475 , 475 - 500 , 500 - 525 , 525 - 550 , 550 - 575 , 575 - 600 , 600 - 625 , 625 - 650 , 650 - 675 , 675 - 700 , 700 - 725 , 725 - 750 , 750 - 775 , 775 - 800 , 800 - 825 , 825 - 850 , 850 - 875 , 875 - 900 , 900 - 925 , 925 - 950 , 950 - 975 , 975 - 1000 , 1000 - 1025 , 1025 - 1050 , 1050 - 1075 , 1075 - 1100 , 1100 - 1125 , 1125 - 1150 , 1150 - 1175 , 1175 - 1200 , 1200 - 1225 , 1225 - 1250 , 1250 - 1275 , 1275 - 1300 , 1300 - 1325 , 1325 - 1350 , 1350 - 1375 | ||
| Click To Change The Sort Order: By Market Cap or Company Size Performance: Year-to-date, Week and Day | |
| Select Chart Type: | ||
| Too many stocks? View smallcap stocks filtered by marketcap & sector |
| Marketcap: All SmallCap Stocks (default-no microcap), Large, Mid-Range, Small & MicroCap |
| Sector: Tech, Finance, Energy, Staples, Retail, Industrial, Materials, Utilities & Medical |
|
Best Stocks Today 12Stocks.com |
© 2024 12Stocks.com Terms & Conditions Privacy Contact Us
All Information Provided Only For Education And Not To Be Used For Investing or Trading. See Terms & Conditions


One More Thing ... Get Best Stocks Delivered Daily!
Never Ever Miss A Move With Our Top Ten Stocks Lists
Find Best Stocks In Any Market - Bull or Bear Market
Take A Peek At Our Top Ten Stocks Lists: Daily, Weekly, Year-to-Date & Top Trends
Find Best Stocks In Any Market - Bull or Bear Market
Take A Peek At Our Top Ten Stocks Lists: Daily, Weekly, Year-to-Date & Top Trends
Smallcap Stocks With Best Up Trends [0-bearish to 100-bullish]: Riot Blockchain[100], Piedmont Office[100], Gannett Co[100], Cricut [100], Payoneer Global[100], Napco Security[100], Regional Management[100], Community Trust[100], Andersons [100], Badger Meter[100], Park National[100]
Best Smallcap Stocks Year-to-Date:
Janux [365.24%], Viking [258.89%], Longboard [219.64%], Super Micro[175.13%], Vera [163.02%], Hippo [129.8%], MicroStrategy [115.12%], Sana [99.88%], SoundHound AI[97.2%], Verde Clean[97%], Dyne [96.24%] Best Smallcap Stocks This Week:
Matterport [164.08%], Riot Blockchain[28.59%], ProKidney [25.74%], Cipher Mining[23.83%], Seres [21.4%], Hibbett Sports[21.34%], SoundHound AI[18.87%], BigBear.ai [18.62%], Marathon Patent[15.94%], MicroStrategy [15.73%], Heron [15.72%] Best Smallcap Stocks Daily:
Hibbett Sports[19.08%], Marathon Patent[18.12%], Heron [17.95%], SES AI[16.52%], SoundHound AI[11.64%], FuelCell Energy[10.86%], BigBear.ai [10.26%], Summit [9.31%], HealthStream [9.25%], Super Micro[9.07%], Seres [8.82%]