
 Login Sign Up


| |||||
 |  | ||||

| 12Stocks.com Market Intelligence |
Best SmallCap Stocks
|
| In a hurry? Small Cap Stock Lists: Performance Trends Table, Stock Charts
Sort Small Cap stocks: Daily, Weekly, Year-to-Date, Market Cap & Trends. Filter Small Cap stocks list by sector: Show all, Tech, Finance, Energy, Staples, Retail, Industrial, Materials, Utilities and HealthCare Filter Small Cap stocks list by size: All Large Medium Small and MicroCap |
| 12Stocks.com Small Cap Stocks Performances & Trends Daily | |||||||||
|
|  The overall Smart Investing & Trading Score is 23 (0-bearish to 100-bullish) which puts Small Cap index in short term bearish to neutral trend. The Smart Investing & Trading Score from previous trading session is 13 and an improvement of trend continues.
| ||||||||
Here are the Smart Investing & Trading Scores of the most requested small cap stocks at 12Stocks.com (click stock name for detailed review):
|


| 12Stocks.com: Investing in Smallcap Index with Stocks | |
|
The following table helps investors and traders sort through current performance and trends (as measured by Smart Investing & Trading Score) of various
stocks in the Smallcap Index. Quick View: Move mouse or cursor over stock symbol (ticker) to view short-term technical chart and over stock name to view long term chart. Click on  to add stock symbol to your watchlist and to add stock symbol to your watchlist and  to view watchlist. Click on any ticker or stock name for detailed market intelligence report for that stock. to view watchlist. Click on any ticker or stock name for detailed market intelligence report for that stock. |
12Stocks.com Performance of Stocks in Smallcap Index
| Ticker | Stock Name | Watchlist | Category | Recent Price | Smart Investing & Trading Score | Change % | YTD Change% |
| UNTY | Unity Bancorp |   | Financials | 26.40 | 18 | 0.00% | -10.80% |
| BH | Biglari | | Services & Goods | 198.99 | 95 | 1.23% | 20.65% |
| RM | Regional Management | | Financials | 25.09 | 93 | 0.88% | 0.04% |
| NRIM | Northrim BanCorp | | Financials | 45.09 | 17 | 0.04% | -21.19% |
| GENC | Gencor Industries | | Industrials | 16.91 | 66 | 0.77% | 4.77% |
| ASC | Ardmore Shipping | | Transports | 15.86 | 25 | 1.73% | 12.56% |
| EOLS | Evolus | | Health Care | 11.45 | 10 | -0.95% | 8.74% |
| CFFI | C&F Financial | | Financials | 35.60 | 32 | -0.24% | -47.79% |
| FBIZ | First Business | | Financials | 34.05 | 32 | 2.16% | -15.09% |
| DHX | DHI Group | | Services & Goods | 2.35 | 68 | -0.42% | -9.27% |
| LQDT | Liquidity Services | | Services & Goods | 17.04 | 10 | 0.77% | -0.99% |
| CMBM | Cambium s | | Technology | 3.39 | 10 | -0.59% | -43.50% |
| CUTR | Cutera | | Health Care | 2.33 | 64 | 1.30% | -33.90% |
| MEC | Mayville Engineering | | Industrials | 13.66 | 53 | 0.82% | -5.26% |
| XFOR | X4 | | Health Care | 1.23 | 48 | 2.93% | 46.69% |
| BWFG | Bankwell Financial | | Financials | 24.00 | 32 | 1.57% | -20.48% |
| CHMG | Chemung Financial | | Financials | 43.18 | 64 | 9.48% | -13.29% |
| LCTX | Lineage Cell | | Health Care | 1.16 | 51 | -3.33% | 6.42% |
| UEC | Uranium Energy | | Materials | 6.82 | 15 | -0.15% | 6.56% |
| CLFD | Clearfield | | Technology | 28.41 | 36 | 0.46% | -2.30% |
| SM | SM Energy | | Energy | 48.70 | 46 | 1.37% | 25.77% |
| MG | Mistras Group | | Services & Goods | 9.00 | 48 | 0.67% | 22.95% |
| SCPH | sc | | Health Care | 4.56 | 17 | 0.88% | -27.27% |
| XAIR | Beyond Air | | Health Care | 1.17 | 10 | -0.43% | -40.31% |
| PLSE | Pulse Biosciences | | Health Care | 7.20 | 7 | -2.17% | -41.18% |
| For chart view version of above stock list: Chart View ➞ 0 - 25 , 25 - 50 , 50 - 75 , 75 - 100 , 100 - 125 , 125 - 150 | ||
 | Click To Change The Sort Order: By Market Cap or Company Size Performance: Year-to-date, Week and Day |  |
| Too many stocks? View smallcap stocks filtered by marketcap & sector |
| Marketcap: All SmallCap Stocks (default-no microcap), Large, Mid-Range, Small |
| Smallcap Sector: Tech, Finance, Energy, Staples, Retail, Industrial, Materials, & Medical |
|
Get the most comprehensive stock market coverage daily at 12Stocks.com ➞ Best Stocks Today ➞ Best Stocks Weekly ➞ Best Stocks Year-to-Date ➞ Best Stocks Trends ➞  Best Stocks Today 12Stocks.com Best Nasdaq Stocks ➞ Best S&P 500 Stocks ➞ Best Tech Stocks ➞ Best Biotech Stocks ➞ |
| Detailed Overview of SmallCap Stocks |
| SmallCap Technical Overview, Leaders & Laggards, Top SmallCap ETF Funds & Detailed SmallCap Stocks List, Charts, Trends & More |
| Smallcap: Technical Analysis, Trends & YTD Performance | |
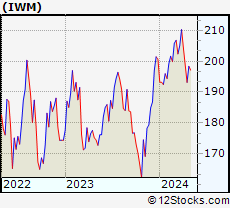
| SmallCap segment as represented by
IWM, an exchange-traded fund [ETF], holds basket of thousands of smallcap stocks from across all major sectors of the US stock market. The smallcap index (contains stocks like Riverbed & Sotheby's) is down by -3.67% and is currently underperforming the overall market by -7.75% year-to-date. Below is a quick view of technical charts and trends: | |
 IWM Weekly Chart |
|
| Long Term Trend: Good | |
| Medium Term Trend: Not Good | |
 IWM Daily Chart |
|
| Short Term Trend: Deteriorating | |
| Overall Trend Score: 23 | |
| YTD Performance: -3.67% | |
| **Trend Scores & Views Are Only For Educational Purposes And Not For Investing | |
| 12Stocks.com: Top Performing Small Cap Index Stocks | ||||||||||||||||||||||||||||||||||||||||||||||||
 The top performing Small Cap Index stocks year to date are
Now, more recently, over last week, the top performing Small Cap Index stocks on the move are


|
||||||||||||||||||||||||||||||||||||||||||||||||
| 12Stocks.com: Investing in Smallcap Index using Exchange Traded Funds | |
|
The following table shows list of key exchange traded funds (ETF) that
help investors track Smallcap index. The following list also includes leveraged ETF funds that track twice or thrice the daily returns of Smallcap indices. Short or inverse ETF funds move in the opposite direction to the index they track and are useful during market pullbacks or during bear markets. Quick View: Move mouse or cursor over ETF symbol (ticker) to view short-term technical chart and over ETF name to view long term chart. Click on ticker or stock name for detailed view. Click on to add stock symbol to your watchlist and to view watchlist. |
12Stocks.com List of ETFs that track Smallcap Index
| Ticker | ETF Name | Watchlist | Recent Price | Smart Investing & Trading Score | Change % | Week % | Year-to-date % |
| IWM | iShares Russell 2000 | | 193.34 | 23 | 0.26 | -2.69 | -3.67% |
| SAA | ProShares Ultra SmallCap600 | | 21.83 | 18 | 0.97 | -3.24 | -12.51% |
| SDD | ProShares UltraShort SmallCap600 | | 20.42 | 76 | -1.30 | 2.97 | 10.82% |
| SMLV | SPDR SSGA US Small Cap Low Volatil ETF | | 105.38 | 32 | 1.49 | 0.35 | -6.35% |
| SBB | ProShares Short SmallCap600 | | 16.80 | 76 | -1.08 | 1.51 | 5.44% |
| 12Stocks.com: Charts, Trends, Fundamental Data and Performances of SmallCap Stocks | |
|
We now take in-depth look at all SmallCap stocks including charts, multi-period performances and overall trends (as measured by Smart Investing & Trading Score). One can sort SmallCap stocks (click link to choose) by Daily, Weekly and by Year-to-Date performances. Also, one can sort by size of the company or by market capitalization. |
| Select Your Default Chart Type: | |||||
| |||||
| Click on stock symbol or name for detailed view. Click on to add stock symbol to your watchlist and to view watchlist. Quick View: Move mouse or cursor over "Daily" to quickly view daily technical stock chart and over "Weekly" to view weekly technical stock chart. | |||||

 | UNTY Unity Bancorp, Inc. |
| Sector: Financials | |
| SubSector: Money Center Banks | |
| MarketCap: 149.099 Millions | |
| Recent Price: 26.40 Smart Investing & Trading Score: 18 | |
| Day Percent Change: 0.00% Day Change: 0.00 | |
| Week Change: 0.48% Year-to-date Change: -10.8% | |
| UNTY Links: Profile News Message Board | |
| Charts:- Daily , Weekly | |
| Add UNTY to Watchlist: View: Get Complete UNTY Trend Analysis ➞ | |
 | BH Biglari Holdings Inc. |
| Sector: Services & Goods | |
| SubSector: Restaurants | |
| MarketCap: 149.07 Millions | |
| Recent Price: 198.99 Smart Investing & Trading Score: 95 | |
| Day Percent Change: 1.23% Day Change: 2.42 | |
| Week Change: 4.15% Year-to-date Change: 20.7% | |
| BH Links: Profile News Message Board | |
| Charts:- Daily , Weekly | |
| Add BH to Watchlist: View: Get Complete BH Trend Analysis ➞ | |
 | RM Regional Management Corp. |
| Sector: Financials | |
| SubSector: Credit Services | |
| MarketCap: 148.008 Millions | |
| Recent Price: 25.09 Smart Investing & Trading Score: 93 | |
| Day Percent Change: 0.88% Day Change: 0.22 | |
| Week Change: 0.36% Year-to-date Change: 0.0% | |
| RM Links: Profile News Message Board | |
| Charts:- Daily , Weekly | |
| Add RM to Watchlist: View: Get Complete RM Trend Analysis ➞ | |
 | NRIM Northrim BanCorp, Inc. |
| Sector: Financials | |
| SubSector: Regional - Pacific Banks | |
| MarketCap: 147.629 Millions | |
| Recent Price: 45.09 Smart Investing & Trading Score: 17 | |
| Day Percent Change: 0.04% Day Change: 0.02 | |
| Week Change: -0.46% Year-to-date Change: -21.2% | |
| NRIM Links: Profile News Message Board | |
| Charts:- Daily , Weekly | |
| Add NRIM to Watchlist: View: Get Complete NRIM Trend Analysis ➞ | |
 | GENC Gencor Industries, Inc. |
| Sector: Industrials | |
| SubSector: Farm & Construction Machinery | |
| MarketCap: 147.607 Millions | |
| Recent Price: 16.91 Smart Investing & Trading Score: 66 | |
| Day Percent Change: 0.77% Day Change: 0.13 | |
| Week Change: -0.76% Year-to-date Change: 4.8% | |
| GENC Links: Profile News Message Board | |
| Charts:- Daily , Weekly | |
| Add GENC to Watchlist: View: Get Complete GENC Trend Analysis ➞ | |
 | ASC Ardmore Shipping Corporation |
| Sector: Transports | |
| SubSector: Shipping | |
| MarketCap: 147.014 Millions | |
| Recent Price: 15.86 Smart Investing & Trading Score: 25 | |
| Day Percent Change: 1.73% Day Change: 0.27 | |
| Week Change: -0.13% Year-to-date Change: 12.6% | |
| ASC Links: Profile News Message Board | |
| Charts:- Daily , Weekly | |
| Add ASC to Watchlist: View: Get Complete ASC Trend Analysis ➞ | |
 | EOLS Evolus, Inc. |
| Sector: Health Care | |
| SubSector: Drugs - Generic | |
| MarketCap: 145.885 Millions | |
| Recent Price: 11.45 Smart Investing & Trading Score: 10 | |
| Day Percent Change: -0.95% Day Change: -0.11 | |
| Week Change: -5.29% Year-to-date Change: 8.7% | |
| EOLS Links: Profile News Message Board | |
| Charts:- Daily , Weekly | |
| Add EOLS to Watchlist: View: Get Complete EOLS Trend Analysis ➞ | |
 | CFFI C&F Financial Corporation |
| Sector: Financials | |
| SubSector: Regional - Mid-Atlantic Banks | |
| MarketCap: 145.559 Millions | |
| Recent Price: 35.60 Smart Investing & Trading Score: 32 | |
| Day Percent Change: -0.24% Day Change: -0.09 | |
| Week Change: -11.34% Year-to-date Change: -47.8% | |
| CFFI Links: Profile News Message Board | |
| Charts:- Daily , Weekly | |
| Add CFFI to Watchlist: View: Get Complete CFFI Trend Analysis ➞ | |
 | FBIZ First Business Financial Services, Inc. |
| Sector: Financials | |
| SubSector: Regional - Midwest Banks | |
| MarketCap: 144.97 Millions | |
| Recent Price: 34.05 Smart Investing & Trading Score: 32 | |
| Day Percent Change: 2.16% Day Change: 0.72 | |
| Week Change: -0.58% Year-to-date Change: -15.1% | |
| FBIZ Links: Profile News Message Board | |
| Charts:- Daily , Weekly | |
| Add FBIZ to Watchlist: View: Get Complete FBIZ Trend Analysis ➞ | |
 | DHX DHI Group, Inc. |
| Sector: Services & Goods | |
| SubSector: Staffing & Outsourcing Services | |
| MarketCap: 144.728 Millions | |
| Recent Price: 2.35 Smart Investing & Trading Score: 68 | |
| Day Percent Change: -0.42% Day Change: -0.01 | |
| Week Change: 3.52% Year-to-date Change: -9.3% | |
| DHX Links: Profile News Message Board | |
| Charts:- Daily , Weekly | |
| Add DHX to Watchlist: View: Get Complete DHX Trend Analysis ➞ | |
 | LQDT Liquidity Services, Inc. |
| Sector: Services & Goods | |
| SubSector: Catalog & Mail Order Houses | |
| MarketCap: 144.492 Millions | |
| Recent Price: 17.04 Smart Investing & Trading Score: 10 | |
| Day Percent Change: 0.77% Day Change: 0.13 | |
| Week Change: -4.86% Year-to-date Change: -1.0% | |
| LQDT Links: Profile News Message Board | |
| Charts:- Daily , Weekly | |
| Add LQDT to Watchlist: View: Get Complete LQDT Trend Analysis ➞ | |
 | CMBM Cambium Networks Corporation |
| Sector: Technology | |
| SubSector: Communication Equipment | |
| MarketCap: 143.739 Millions | |
| Recent Price: 3.39 Smart Investing & Trading Score: 10 | |
| Day Percent Change: -0.59% Day Change: -0.02 | |
| Week Change: -17.52% Year-to-date Change: -43.5% | |
| CMBM Links: Profile News Message Board | |
| Charts:- Daily , Weekly | |
| Add CMBM to Watchlist: View: Get Complete CMBM Trend Analysis ➞ | |
 | CUTR Cutera, Inc. |
| Sector: Health Care | |
| SubSector: Medical Appliances & Equipment | |
| MarketCap: 143.68 Millions | |
| Recent Price: 2.33 Smart Investing & Trading Score: 64 | |
| Day Percent Change: 1.30% Day Change: 0.03 | |
| Week Change: 5.43% Year-to-date Change: -33.9% | |
| CUTR Links: Profile News Message Board | |
| Charts:- Daily , Weekly | |
| Add CUTR to Watchlist: View: Get Complete CUTR Trend Analysis ➞ | |
 | MEC Mayville Engineering Company, Inc. |
| Sector: Industrials | |
| SubSector: Metal Fabrication | |
| MarketCap: 143.55 Millions | |
| Recent Price: 13.66 Smart Investing & Trading Score: 53 | |
| Day Percent Change: 0.82% Day Change: 0.11 | |
| Week Change: 0.67% Year-to-date Change: -5.3% | |
| MEC Links: Profile News Message Board | |
| Charts:- Daily , Weekly | |
| Add MEC to Watchlist: View: Get Complete MEC Trend Analysis ➞ | |
 | XFOR X4 Pharmaceuticals, Inc. |
| Sector: Health Care | |
| SubSector: Biotechnology | |
| MarketCap: 143.385 Millions | |
| Recent Price: 1.23 Smart Investing & Trading Score: 48 | |
| Day Percent Change: 2.93% Day Change: 0.03 | |
| Week Change: -8.21% Year-to-date Change: 46.7% | |
| XFOR Links: Profile News Message Board | |
| Charts:- Daily , Weekly | |
| Add XFOR to Watchlist: View: Get Complete XFOR Trend Analysis ➞ | |
 | BWFG Bankwell Financial Group, Inc. |
| Sector: Financials | |
| SubSector: Regional - Northeast Banks | |
| MarketCap: 142.899 Millions | |
| Recent Price: 24.00 Smart Investing & Trading Score: 32 | |
| Day Percent Change: 1.57% Day Change: 0.37 | |
| Week Change: -0.39% Year-to-date Change: -20.5% | |
| BWFG Links: Profile News Message Board | |
| Charts:- Daily , Weekly | |
| Add BWFG to Watchlist: View: Get Complete BWFG Trend Analysis ➞ | |
 | CHMG Chemung Financial Corporation |
| Sector: Financials | |
| SubSector: Regional - Pacific Banks | |
| MarketCap: 142.229 Millions | |
| Recent Price: 43.18 Smart Investing & Trading Score: 64 | |
| Day Percent Change: 9.48% Day Change: 3.74 | |
| Week Change: 9.29% Year-to-date Change: -13.3% | |
| CHMG Links: Profile News Message Board | |
| Charts:- Daily , Weekly | |
| Add CHMG to Watchlist: View: Get Complete CHMG Trend Analysis ➞ | |
 | LCTX Lineage Cell Therapeutics, Inc. |
| Sector: Health Care | |
| SubSector: Biotechnology | |
| MarketCap: 141.285 Millions | |
| Recent Price: 1.16 Smart Investing & Trading Score: 51 | |
| Day Percent Change: -3.33% Day Change: -0.04 | |
| Week Change: -10.77% Year-to-date Change: 6.4% | |
| LCTX Links: Profile News Message Board | |
| Charts:- Daily , Weekly | |
| Add LCTX to Watchlist: View: Get Complete LCTX Trend Analysis ➞ | |
 | UEC Uranium Energy Corp. |
| Sector: Materials | |
| SubSector: Industrial Metals & Minerals | |
| MarketCap: 138.91 Millions | |
| Recent Price: 6.82 Smart Investing & Trading Score: 15 | |
| Day Percent Change: -0.15% Day Change: -0.01 | |
| Week Change: -6.06% Year-to-date Change: 6.6% | |
| UEC Links: Profile News Message Board | |
| Charts:- Daily , Weekly | |
| Add UEC to Watchlist: View: Get Complete UEC Trend Analysis ➞ | |
 | CLFD Clearfield, Inc. |
| Sector: Technology | |
| SubSector: Communication Equipment | |
| MarketCap: 138.439 Millions | |
| Recent Price: 28.41 Smart Investing & Trading Score: 36 | |
| Day Percent Change: 0.46% Day Change: 0.13 | |
| Week Change: -5.96% Year-to-date Change: -2.3% | |
| CLFD Links: Profile News Message Board | |
| Charts:- Daily , Weekly | |
| Add CLFD to Watchlist: View: Get Complete CLFD Trend Analysis ➞ | |
 | SM SM Energy Company |
| Sector: Energy | |
| SubSector: Independent Oil & Gas | |
| MarketCap: 137.593 Millions | |
| Recent Price: 48.70 Smart Investing & Trading Score: 46 | |
| Day Percent Change: 1.37% Day Change: 0.66 | |
| Week Change: -4% Year-to-date Change: 25.8% | |
| SM Links: Profile News Message Board | |
| Charts:- Daily , Weekly | |
| Add SM to Watchlist: View: Get Complete SM Trend Analysis ➞ | |
 | MG Mistras Group, Inc. |
| Sector: Services & Goods | |
| SubSector: Security & Protection Services | |
| MarketCap: 136.903 Millions | |
| Recent Price: 9.00 Smart Investing & Trading Score: 48 | |
| Day Percent Change: 0.67% Day Change: 0.06 | |
| Week Change: -0.55% Year-to-date Change: 23.0% | |
| MG Links: Profile News Message Board | |
| Charts:- Daily , Weekly | |
| Add MG to Watchlist: View: Get Complete MG Trend Analysis ➞ | |
 | SCPH scPharmaceuticals Inc. |
| Sector: Health Care | |
| SubSector: Biotechnology | |
| MarketCap: 136.185 Millions | |
| Recent Price: 4.56 Smart Investing & Trading Score: 17 | |
| Day Percent Change: 0.88% Day Change: 0.04 | |
| Week Change: -7.51% Year-to-date Change: -27.3% | |
| SCPH Links: Profile News Message Board | |
| Charts:- Daily , Weekly | |
| Add SCPH to Watchlist: View: Get Complete SCPH Trend Analysis ➞ | |
 | XAIR Beyond Air, Inc. |
| Sector: Health Care | |
| SubSector: Medical Appliances & Equipment | |
| MarketCap: 132.48 Millions | |
| Recent Price: 1.17 Smart Investing & Trading Score: 10 | |
| Day Percent Change: -0.43% Day Change: -0.01 | |
| Week Change: -18.75% Year-to-date Change: -40.3% | |
| XAIR Links: Profile News Message Board | |
| Charts:- Daily , Weekly | |
| Add XAIR to Watchlist: View: Get Complete XAIR Trend Analysis ➞ | |
 | PLSE Pulse Biosciences, Inc. |
| Sector: Health Care | |
| SubSector: Medical Instruments & Supplies | |
| MarketCap: 131.96 Millions | |
| Recent Price: 7.20 Smart Investing & Trading Score: 7 | |
| Day Percent Change: -2.17% Day Change: -0.16 | |
| Week Change: -0.28% Year-to-date Change: -41.2% | |
| PLSE Links: Profile News Message Board | |
| Charts:- Daily , Weekly | |
| Add PLSE to Watchlist: View: Get Complete PLSE Trend Analysis ➞ | |
| For tabular summary view of above stock list: Summary View ➞ 0 - 25 , 25 - 50 , 50 - 75 , 75 - 100 , 100 - 125 , 125 - 150 | ||
| Click To Change The Sort Order: By Market Cap or Company Size Performance: Year-to-date, Week and Day | |
| Select Chart Type: | ||
| Too many stocks? View smallcap stocks filtered by marketcap & sector |
| Marketcap: All SmallCap Stocks (default-no microcap), Large, Mid-Range, Small & MicroCap |
| Sector: Tech, Finance, Energy, Staples, Retail, Industrial, Materials, Utilities & Medical |
|
Best Stocks Today 12Stocks.com |
© 2024 12Stocks.com Terms & Conditions Privacy Contact Us
All Information Provided Only For Education And Not To Be Used For Investing or Trading. See Terms & Conditions


One More Thing ... Get Best Stocks Delivered Daily!
Never Ever Miss A Move With Our Top Ten Stocks Lists
Find Best Stocks In Any Market - Bull or Bear Market
Take A Peek At Our Top Ten Stocks Lists: Daily, Weekly, Year-to-Date & Top Trends
Find Best Stocks In Any Market - Bull or Bear Market
Take A Peek At Our Top Ten Stocks Lists: Daily, Weekly, Year-to-Date & Top Trends
Smallcap Stocks With Best Up Trends [0-bearish to 100-bullish]: Humacyte [100], Victory Capital[100], Century Aluminum[100], Oscar Health[100], Mercury General[100], United Fire[100], Gannett Co[100], Old Second[100], Portland General[100], Lantheus [100], Target Hospitality[100]
Best Smallcap Stocks Year-to-Date:
Agenus [581.24%], CareMax [456.7%], Janux [343.37%], Alpine Immune[238.42%], Longboard [194.11%], Arcutis Bio[184.06%], Super Micro[176.22%], Avidity Biosciences[153.65%], Vera [147.87%], Hippo [123.38%], Stoke [121.48%] Best Smallcap Stocks This Week:
Macatawa Bank[44.89%], Humacyte [39.24%], ProKidney [37.43%], Snap One[29.79%], ALX Oncology[22.49%], 23andMe Holding[22.09%], Vanda [21.12%], ContextLogic [20%], Badger Meter[17.13%], Oscar Health[15.4%], Accolade [13.45%] Best Smallcap Stocks Daily:
Humacyte [23.57%], Metropolitan Bank[17.73%], Agenus [13.48%], Origin Materials[11.12%], Chemung Financial[9.48%], Pacific Biosciences[8.56%], Cohen & Steers[8.35%], Urban One[8.21%], Riot Blockchain[7.84%], Bar Harbor[7.71%], CareMax [7.57%]