
 Login Sign Up


| |||||
 |  | ||||

| 12Stocks.com Market Intelligence |
Best S&P 500 Stocks
|
On this page, you will find the most comprehensive analysis of S&P 500 stocks and ETFs - from latest trends to performances to charts ➞. First, here are the year-to-date (YTD) performances of the most requested S&P 500 stocks at 12Stocks.com (click stock for review):
| NVIDIA 66% | ||
| Caterpillar 23% | ||
| Amazon.com 18% | ||
| Merck 16% | ||
| Google 13% | ||
| JPMorgan Chase 13% | ||
| Walmart 12% | ||
| Goldman Sachs 10% | ||
| Chevron 9% | ||
| Microsoft 8% | ||
| Johnson & Johnson -5% | ||
| McDonald s -7% | ||
| Starbucks -8% | ||
| Apple -13% | ||
| Gilead -17% | ||
| Intel -32% | ||
| Boeing -35% | ||
| Quick: S&P 500 Stocks Lists: Performances & Trends, S&P 500 Stock Charts
Sort S&P 500 stocks: Daily, Weekly, Year-to-Date, Market Cap & Trends. Filter S&P 500 stocks list by sector: Show all, Tech, Finance, Energy, Staples, Retail, Industrial, Materials, Utilities and HealthCare |
| 12Stocks.com S&P 500 Stocks Performances & Trends Daily Report | |||||||||
|
| 
The overall Smart Investing & Trading Score is 58 (0-bearish to 100-bullish) which puts S&P 500 index in short term neutral trend. The Smart Investing & Trading Score from previous trading session is 51 and hence an improvement of trend. | ||||||||
Here are the Smart Investing & Trading Scores of the most requested S&P 500 stocks at 12Stocks.com (click stock name for detailed review):
|


| 12Stocks.com: Top Performing S&P 500 Index Stocks | ||||||||||||||||||||||||||||||||||||||||||||||||
 The top performing S&P 500 Index stocks year to date are
Now, more recently, over last week, the top performing S&P 500 Index stocks on the move are


|
||||||||||||||||||||||||||||||||||||||||||||||||
| 12Stocks.com: Investing in S&P 500 Index with Stocks | |
|
The following table helps investors and traders sort through current performance and trends (as measured by Smart Investing & Trading Score) of various
stocks in the S&P 500 Index. Quick View: Move mouse or cursor over stock symbol (ticker) to view short-term technical chart and over stock name to view long term chart. Click on  to add stock symbol to your watchlist and to add stock symbol to your watchlist and  to view watchlist. Click on any ticker or stock name for detailed market intelligence report for that stock. to view watchlist. Click on any ticker or stock name for detailed market intelligence report for that stock. |
12Stocks.com Performance of Stocks in S&P 500 Index
| Ticker | Stock Name | Watchlist | Category | Recent Price | Smart Investing & Trading Score | Change % | YTD Change% |
| CAT | Caterpillar |   | Industrials | 363.25 | 68 | 1.58% | 22.86% |
| TDG | TransDigm | | Industrials | 1242.40 | 71 | 3.45% | 22.82% |
| PXD | Pioneer Natural | | Energy | 275.23 | 95 | 0.63% | 22.39% |
| DAL | Delta Air | | Transports | 49.23 | 100 | 0.43% | 22.37% |
| CMI | Cummins | | Industrials | 292.70 | 61 | 0.79% | 22.18% |
| C | Citi | | Financials | 62.67 | 100 | 2.82% | 21.83% |
| JNPR | Juniper Networks | | Technology | 35.88 | 8 | -0.64% | 21.71% |
| KR | Kroger Co | | Services & Goods | 55.63 | 51 | -2.28% | 21.70% |
| XOM | Exxon Mobil | | Energy | 121.03 | 76 | 0.39% | 21.05% |
| HUBB | Hubbell | | Technology | 398.00 | 63 | 1.90% | 21.00% |
| FIS | Fidelity National | | Technology | 71.90 | 68 | 0.84% | 19.69% |
| PH | Parker-Hannifin | | Industrials | 550.40 | 63 | 1.98% | 19.47% |
| BSX | Boston Scientific | | Health Care | 68.99 | 83 | 1.43% | 19.34% |
| PSX | Phillips 66 | | Energy | 158.84 | 68 | 1.14% | 19.30% |
| AMAT | Applied Materials | | Technology | 193.24 | 51 | 2.00% | 19.23% |
| MLM | Martin Marietta | | Industrials | 594.39 | 63 | 1.72% | 19.14% |
| TSCO | Tractor Supply | | Services & Goods | 255.96 | 90 | 1.02% | 19.03% |
| LDOS | Leidos Holdings | | Technology | 128.68 | 83 | 2.10% | 18.88% |
| NFLX | Netflix | | Technology | 577.75 | 43 | 4.17% | 18.66% |
| TXT | Textron | | Industrials | 95.28 | 75 | 1.61% | 18.48% |
| ABNB | Airbnb | | Technology | 160.95 | 63 | 2.77% | 18.22% |
| AMZN | Amazon.com | | Services & Goods | 179.54 | 56 | 1.30% | 18.17% |
| HCA | HCA Healthcare | | Health Care | 319.43 | 68 | 2.94% | 18.01% |
| GPC | Genuine Parts | | Services & Goods | 163.38 | 100 | 0.18% | 17.96% |
| CI | Cigna | | Health Care | 352.65 | 75 | -0.15% | 17.77% |
| For chart view version of above stock list: Chart View ➞ 0 - 25 , 25 - 50 , 50 - 75 , 75 - 100 , 100 - 125 , 125 - 150 , 150 - 175 , 175 - 200 , 200 - 225 , 225 - 250 , 250 - 275 , 275 - 300 , 300 - 325 , 325 - 350 , 350 - 375 , 375 - 400 , 400 - 425 , 425 - 450 , 450 - 475 , 475 - 500 | ||
 | Click To Change The Sort Order: By Market Cap or Company Size Performance: Year-to-date, Week and Day |  |
|
Get the most comprehensive stock market coverage daily at 12Stocks.com ➞ Best Stocks Today ➞ Best Stocks Weekly ➞ Best Stocks Year-to-Date ➞ Best Stocks Trends ➞  Best Stocks Today 12Stocks.com Best Nasdaq Stocks ➞ Best S&P 500 Stocks ➞ Best Tech Stocks ➞ Best Biotech Stocks ➞ |
| Detailed Overview of S&P 500 Stocks |
| S&P 500 Technical Overview, Leaders & Laggards, Top S&P 500 ETF Funds & Detailed S&P 500 Stocks List, Charts, Trends & More |
| S&P 500: Technical Analysis, Trends & YTD Performance | |
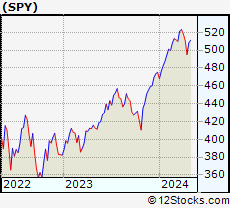
| S&P 500 index as represented by
SPY, an exchange-traded fund [ETF], holds basket of five hundred (mostly largecap) stocks from across all major sectors of the US stock market. The S&P 500 index (contains stocks like Apple and Exxon) is up by 6.38% and is currently outperforming the overall market by 0.74% year-to-date. Below is a quick view of technical charts and trends: | |
 SPY Weekly Chart |
|
| Long Term Trend: Good | |
| Medium Term Trend: Not Good | |
 SPY Daily Chart |
|
| Short Term Trend: Very Good | |
| Overall Trend Score: 58 | |
| YTD Performance: 6.38% | |
| **Trend Scores & Views Are Only For Educational Purposes And Not For Investing | |
| 12Stocks.com: Investing in S&P 500 Index using Exchange Traded Funds | |
|
The following table shows list of key exchange traded funds (ETF) that
help investors track S&P 500 index. The following list also includes leveraged ETF funds that track twice or thrice the daily returns of S&P 500 indices. Short or inverse ETF funds move in the opposite direction to the index they track and are useful during market pullbacks or during bear markets. Quick View: Move mouse or cursor over ETF symbol (ticker) to view short-term technical chart and over ETF name to view long term chart. Click on ticker or stock name for detailed view. Click on to add stock symbol to your watchlist and to view watchlist. |
12Stocks.com List of ETFs that track S&P 500 Index
| Ticker | ETF Name | Watchlist | Recent Price | Smart Investing & Trading Score | Change % | Week % | Year-to-date % |
| SPY | SPDR S&P 500 ETF | | 505.65 | 58 | 1.19 | 2.12 | 6.38% |
| IVV | iShares Core S&P 500 ETF | | 508.17 | 58 | 2.00 | 2.14 | 6.39% |
| VOO | Vanguard 500 ETF | | 464.84 | 58 | 2.03 | 2.14 | 6.42% |
| OEF | iShares S&P 100 | | 239.95 | 58 | 1.33 | 2.25 | 7.41% |
| SSO | ProShares Ultra S&P500 | | 72.04 | 58 | 2.43 | 4.24 | 10.71% |
| UPRO | ProShares UltraPro S&P500 | | 62.93 | 58 | 3.59 | 6.37 | 14.96% |
| SPXL | Direxion Daily S&P500 Bull 3X ETF | | 119.51 | 58 | 3.52 | 6.18 | 14.92% |
| SH | ProShares Short S&P500 | | 12.34 | 42 | -1.20 | -1.99 | -5% |
| SDS | ProShares UltraShort S&P500 | | 26.78 | 37 | -2.30 | -4.01 | -10.49% |
| SPXU | ProShares UltraPro Short S&P500 | | 35.99 | 42 | -3.62 | -6.1 | -16.3% |
| SPXS | Direxion Daily S&P 500 Bear 3X ETF | | 9.75 | 32 | -5.43 | -5.89 | -15.58% |
| 12Stocks.com: Charts, Trends, Fundamental Data and Performances of S&P 500 Stocks | |
|
We now take in-depth look at all S&P 500 stocks including charts, multi-period performances and overall trends (as measured by Smart Investing & Trading Score). One can sort S&P 500 stocks (click link to choose) by Daily, Weekly and by Year-to-Date performances. Also, one can sort by size of the company or by market capitalization. |
| Select Your Default Chart Type: | |||||
| |||||
| Click on stock symbol or name for detailed view. Click on to add stock symbol to your watchlist and to view watchlist. Quick View: Move mouse or cursor over "Daily" to quickly view daily technical stock chart and over "Weekly" to view weekly technical stock chart. | |||||

 | CAT Caterpillar Inc. |
| Sector: Industrials | |
| SubSector: Farm & Construction Machinery | |
| MarketCap: 58636 Millions | |
| Recent Price: 363.25 Smart Investing & Trading Score: 68 | |
| Day Percent Change: 1.58% Day Change: 5.64 | |
| Week Change: 2.42% Year-to-date Change: 22.9% | |
| CAT Links: Profile News Message Board | |
| Charts:- Daily , Weekly | |
| Add CAT to Watchlist: View: Get CAT Trend Analysis ➞ | |
 | TDG TransDigm Group Incorporated |
| Sector: Industrials | |
| SubSector: Aerospace/Defense Products & Services | |
| MarketCap: 18441 Millions | |
| Recent Price: 1242.40 Smart Investing & Trading Score: 71 | |
| Day Percent Change: 3.45% Day Change: 41.47 | |
| Week Change: 4.61% Year-to-date Change: 22.8% | |
| TDG Links: Profile News Message Board | |
| Charts:- Daily , Weekly | |
| Add TDG to Watchlist: View: Get TDG Trend Analysis ➞ | |
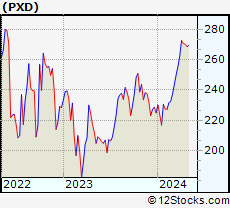 | PXD Pioneer Natural Resources Company |
| Sector: Energy | |
| SubSector: Independent Oil & Gas | |
| MarketCap: 11846.2 Millions | |
| Recent Price: 275.23 Smart Investing & Trading Score: 95 | |
| Day Percent Change: 0.63% Day Change: 1.72 | |
| Week Change: 1.82% Year-to-date Change: 22.4% | |
| PXD Links: Profile News Message Board | |
| Charts:- Daily , Weekly | |
| Add PXD to Watchlist: View: Get PXD Trend Analysis ➞ | |
 | DAL Delta Air Lines, Inc. |
| Sector: Transports | |
| SubSector: Major Airlines | |
| MarketCap: 17298.5 Millions | |
| Recent Price: 49.23 Smart Investing & Trading Score: 100 | |
| Day Percent Change: 0.43% Day Change: 0.21 | |
| Week Change: 3.49% Year-to-date Change: 22.4% | |
| DAL Links: Profile News Message Board | |
| Charts:- Daily , Weekly | |
| Add DAL to Watchlist: View: Get DAL Trend Analysis ➞ | |
 | CMI Cummins Inc. |
| Sector: Industrials | |
| SubSector: Diversified Machinery | |
| MarketCap: 19127.1 Millions | |
| Recent Price: 292.70 Smart Investing & Trading Score: 61 | |
| Day Percent Change: 0.79% Day Change: 2.30 | |
| Week Change: 1.79% Year-to-date Change: 22.2% | |
| CMI Links: Profile News Message Board | |
| Charts:- Daily , Weekly | |
| Add CMI to Watchlist: View: Get CMI Trend Analysis ➞ | |
 | C Citigroup Inc. |
| Sector: Financials | |
| SubSector: Money Center Banks | |
| MarketCap: 94128 Millions | |
| Recent Price: 62.67 Smart Investing & Trading Score: 100 | |
| Day Percent Change: 2.82% Day Change: 1.72 | |
| Week Change: 5.97% Year-to-date Change: 21.8% | |
| C Links: Profile News Message Board | |
| Charts:- Daily , Weekly | |
| Add C to Watchlist: View: Get C Trend Analysis ➞ | |
 | JNPR Juniper Networks, Inc. |
| Sector: Technology | |
| SubSector: Communication Equipment | |
| MarketCap: 6161.49 Millions | |
| Recent Price: 35.88 Smart Investing & Trading Score: 8 | |
| Day Percent Change: -0.64% Day Change: -0.23 | |
| Week Change: -0.5% Year-to-date Change: 21.7% | |
| JNPR Links: Profile News Message Board | |
| Charts:- Daily , Weekly | |
| Add JNPR to Watchlist: View: Get JNPR Trend Analysis ➞ | |
 | KR The Kroger Co. |
| Sector: Services & Goods | |
| SubSector: Grocery Stores | |
| MarketCap: 26718.5 Millions | |
| Recent Price: 55.63 Smart Investing & Trading Score: 51 | |
| Day Percent Change: -2.28% Day Change: -1.30 | |
| Week Change: -1.66% Year-to-date Change: 21.7% | |
| KR Links: Profile News Message Board | |
| Charts:- Daily , Weekly | |
| Add KR to Watchlist: View: Get KR Trend Analysis ➞ | |
 | XOM Exxon Mobil Corporation |
| Sector: Energy | |
| SubSector: Major Integrated Oil & Gas | |
| MarketCap: 156450 Millions | |
| Recent Price: 121.03 Smart Investing & Trading Score: 76 | |
| Day Percent Change: 0.39% Day Change: 0.47 | |
| Week Change: 0.96% Year-to-date Change: 21.1% | |
| XOM Links: Profile News Message Board | |
| Charts:- Daily , Weekly | |
| Add XOM to Watchlist: View: Get XOM Trend Analysis ➞ | |
 | HUBB Hubbell Incorporated |
| Sector: Technology | |
| SubSector: Diversified Electronics | |
| MarketCap: 6002.46 Millions | |
| Recent Price: 398.00 Smart Investing & Trading Score: 63 | |
| Day Percent Change: 1.90% Day Change: 7.44 | |
| Week Change: 2.57% Year-to-date Change: 21.0% | |
| HUBB Links: Profile News Message Board | |
| Charts:- Daily , Weekly | |
| Add HUBB to Watchlist: View: Get HUBB Trend Analysis ➞ | |
 | FIS Fidelity National Information Services, Inc. |
| Sector: Technology | |
| SubSector: Information Technology Services | |
| MarketCap: 71126.8 Millions | |
| Recent Price: 71.90 Smart Investing & Trading Score: 68 | |
| Day Percent Change: 0.84% Day Change: 0.60 | |
| Week Change: 1.65% Year-to-date Change: 19.7% | |
| FIS Links: Profile News Message Board | |
| Charts:- Daily , Weekly | |
| Add FIS to Watchlist: View: Get FIS Trend Analysis ➞ | |
 | PH Parker-Hannifin Corporation |
| Sector: Industrials | |
| SubSector: Industrial Equipment & Components | |
| MarketCap: 14888.9 Millions | |
| Recent Price: 550.40 Smart Investing & Trading Score: 63 | |
| Day Percent Change: 1.98% Day Change: 10.68 | |
| Week Change: 2.95% Year-to-date Change: 19.5% | |
| PH Links: Profile News Message Board | |
| Charts:- Daily , Weekly | |
| Add PH to Watchlist: View: Get PH Trend Analysis ➞ | |
 | BSX Boston Scientific Corporation |
| Sector: Health Care | |
| SubSector: Medical Appliances & Equipment | |
| MarketCap: 41541.2 Millions | |
| Recent Price: 68.99 Smart Investing & Trading Score: 83 | |
| Day Percent Change: 1.43% Day Change: 0.97 | |
| Week Change: 2.47% Year-to-date Change: 19.3% | |
| BSX Links: Profile News Message Board | |
| Charts:- Daily , Weekly | |
| Add BSX to Watchlist: View: Get BSX Trend Analysis ➞ | |
 | PSX Phillips 66 |
| Sector: Energy | |
| SubSector: Oil & Gas Refining & Marketing | |
| MarketCap: 25253.6 Millions | |
| Recent Price: 158.84 Smart Investing & Trading Score: 68 | |
| Day Percent Change: 1.14% Day Change: 1.79 | |
| Week Change: 2.67% Year-to-date Change: 19.3% | |
| PSX Links: Profile News Message Board | |
| Charts:- Daily , Weekly | |
| Add PSX to Watchlist: View: Get PSX Trend Analysis ➞ | |
 | AMAT Applied Materials, Inc. |
| Sector: Technology | |
| SubSector: Semiconductor Equipment & Materials | |
| MarketCap: 40593.8 Millions | |
| Recent Price: 193.24 Smart Investing & Trading Score: 51 | |
| Day Percent Change: 2.00% Day Change: 3.78 | |
| Week Change: 1.83% Year-to-date Change: 19.2% | |
| AMAT Links: Profile News Message Board | |
| Charts:- Daily , Weekly | |
| Add AMAT to Watchlist: View: Get AMAT Trend Analysis ➞ | |
 | MLM Martin Marietta Materials, Inc. |
| Sector: Industrials | |
| SubSector: General Building Materials | |
| MarketCap: 10624.3 Millions | |
| Recent Price: 594.39 Smart Investing & Trading Score: 63 | |
| Day Percent Change: 1.72% Day Change: 10.07 | |
| Week Change: 3.21% Year-to-date Change: 19.1% | |
| MLM Links: Profile News Message Board | |
| Charts:- Daily , Weekly | |
| Add MLM to Watchlist: View: Get MLM Trend Analysis ➞ | |
 | TSCO Tractor Supply Company |
| Sector: Services & Goods | |
| SubSector: Specialty Retail, Other | |
| MarketCap: 9692.94 Millions | |
| Recent Price: 255.96 Smart Investing & Trading Score: 90 | |
| Day Percent Change: 1.02% Day Change: 2.58 | |
| Week Change: 1.25% Year-to-date Change: 19.0% | |
| TSCO Links: Profile News Message Board | |
| Charts:- Daily , Weekly | |
| Add TSCO to Watchlist: View: Get TSCO Trend Analysis ➞ | |
 | LDOS Leidos Holdings, Inc. |
| Sector: Technology | |
| SubSector: Information Technology Services | |
| MarketCap: 11707.5 Millions | |
| Recent Price: 128.68 Smart Investing & Trading Score: 83 | |
| Day Percent Change: 2.10% Day Change: 2.65 | |
| Week Change: 3.02% Year-to-date Change: 18.9% | |
| LDOS Links: Profile News Message Board | |
| Charts:- Daily , Weekly | |
| Add LDOS to Watchlist: View: Get LDOS Trend Analysis ➞ | |
 | NFLX Netflix, Inc. |
| Sector: Technology | |
| SubSector: CATV Systems | |
| MarketCap: 162108 Millions | |
| Recent Price: 577.75 Smart Investing & Trading Score: 43 | |
| Day Percent Change: 4.17% Day Change: 23.15 | |
| Week Change: 4.09% Year-to-date Change: 18.7% | |
| NFLX Links: Profile News Message Board | |
| Charts:- Daily , Weekly | |
| Add NFLX to Watchlist: View: Get NFLX Trend Analysis ➞ | |
 | TXT Textron Inc. |
| Sector: Industrials | |
| SubSector: Aerospace/Defense - Major Diversified | |
| MarketCap: 6123.09 Millions | |
| Recent Price: 95.28 Smart Investing & Trading Score: 75 | |
| Day Percent Change: 1.61% Day Change: 1.51 | |
| Week Change: 2.12% Year-to-date Change: 18.5% | |
| TXT Links: Profile News Message Board | |
| Charts:- Daily , Weekly | |
| Add TXT to Watchlist: View: Get TXT Trend Analysis ➞ | |
 | ABNB Airbnb, Inc. |
| Sector: Technology | |
| SubSector: Internet Content & Information | |
| MarketCap: 86237 Millions | |
| Recent Price: 160.95 Smart Investing & Trading Score: 63 | |
| Day Percent Change: 2.77% Day Change: 4.34 | |
| Week Change: 1.21% Year-to-date Change: 18.2% | |
| ABNB Links: Profile News Message Board | |
| Charts:- Daily , Weekly | |
| Add ABNB to Watchlist: View: Get ABNB Trend Analysis ➞ | |
 | AMZN Amazon.com, Inc. |
| Sector: Services & Goods | |
| SubSector: Catalog & Mail Order Houses | |
| MarketCap: 998070 Millions | |
| Recent Price: 179.54 Smart Investing & Trading Score: 56 | |
| Day Percent Change: 1.30% Day Change: 2.31 | |
| Week Change: 2.81% Year-to-date Change: 18.2% | |
| AMZN Links: Profile News Message Board | |
| Charts:- Daily , Weekly | |
| Add AMZN to Watchlist: View: Get AMZN Trend Analysis ➞ | |
 | HCA HCA Healthcare, Inc. |
| Sector: Health Care | |
| SubSector: Hospitals | |
| MarketCap: 29466.6 Millions | |
| Recent Price: 319.43 Smart Investing & Trading Score: 68 | |
| Day Percent Change: 2.94% Day Change: 9.12 | |
| Week Change: 4.69% Year-to-date Change: 18.0% | |
| HCA Links: Profile News Message Board | |
| Charts:- Daily , Weekly | |
| Add HCA to Watchlist: View: Get HCA Trend Analysis ➞ | |
 | GPC Genuine Parts Company |
| Sector: Services & Goods | |
| SubSector: Auto Parts Stores | |
| MarketCap: 8605.9 Millions | |
| Recent Price: 163.38 Smart Investing & Trading Score: 100 | |
| Day Percent Change: 0.18% Day Change: 0.29 | |
| Week Change: 0.61% Year-to-date Change: 18.0% | |
| GPC Links: Profile News Message Board | |
| Charts:- Daily , Weekly | |
| Add GPC to Watchlist: View: Get GPC Trend Analysis ➞ | |
 | CI Cigna Corporation |
| Sector: Health Care | |
| SubSector: Health Care Plans | |
| MarketCap: 60251.8 Millions | |
| Recent Price: 352.65 Smart Investing & Trading Score: 75 | |
| Day Percent Change: -0.15% Day Change: -0.53 | |
| Week Change: 0.07% Year-to-date Change: 17.8% | |
| CI Links: Profile News Message Board | |
| Charts:- Daily , Weekly | |
| Add CI to Watchlist: View: Get CI Trend Analysis ➞ | |
| For tabular summary view of above stock list: Summary View ➞ 0 - 25 , 25 - 50 , 50 - 75 , 75 - 100 , 100 - 125 , 125 - 150 , 150 - 175 , 175 - 200 , 200 - 225 , 225 - 250 , 250 - 275 , 275 - 300 , 300 - 325 , 325 - 350 , 350 - 375 , 375 - 400 , 400 - 425 , 425 - 450 , 450 - 475 , 475 - 500 | ||
| Click To Change The Sort Order: By Market Cap or Company Size Performance: Year-to-date, Week and Day | |
| Select Chart Type: | ||
|
Best Stocks Today 12Stocks.com |
© 2024 12Stocks.com Terms & Conditions Privacy Contact Us
All Information Provided Only For Education And Not To Be Used For Investing or Trading. See Terms & Conditions


One More Thing ... Get Best Stocks Delivered Daily!
Never Ever Miss A Move With Our Top Ten Stocks Lists
Find Best Stocks In Any Market - Bull or Bear Market
Take A Peek At Our Top Ten Stocks Lists: Daily, Weekly, Year-to-Date & Top Trends
Find Best Stocks In Any Market - Bull or Bear Market
Take A Peek At Our Top Ten Stocks Lists: Daily, Weekly, Year-to-Date & Top Trends
S&P 500 Stocks With Best Up Trends [0-bearish to 100-bullish]: Danaher [100], Kimberly-Clark [100], Quest Diagnostics[100], Hasbro [100], Philip Morris[100], Citi [100], American Express[100], Truist Financial[100], Morgan Stanley[100], Federal Realty[100], Bank of America[100]
Best S&P 500 Stocks Year-to-Date:
NVIDIA [66.44%], Constellation [60.75%], Meta Platforms[40.09%], NRG [38.28%], Marathon [34.57%], Progressive [34.37%], Targa Resources[33.54%], Western Digital[33.51%], Micron [31.78%], Diamondback [31.78%], United Airlines[30.95%] Best S&P 500 Stocks This Week:
Globe Life[13.52%], General Electric[9.83%], NVIDIA [8.17%], Danaher [7.47%], Kimberly-Clark [7.26%], Pulte [6.95%], Norwegian Cruise[6.83%], Ford Motor[6.59%], Enphase [6.57%], General Motors[6.44%], Quest Diagnostics[6.43%] Best S&P 500 Stocks Daily:
Globe Life[14.11%], General Electric[8.28%], Danaher [7.21%], Kimberly-Clark [5.51%], Norwegian Cruise[5.39%], United Rentals[5.09%], Quest Diagnostics[5.08%], Builders FirstSource[5.07%], Thermo Fisher[4.78%], Waters [4.70%], Pulte [4.57%]