
 Login Sign Up


| |||||
 |  | ||||

| 12Stocks.com Market Intelligence |
Best S&P 500 Stocks
|
On this page, you will find the most comprehensive analysis of S&P 500 stocks and ETFs - from latest trends to performances to charts ➞. First, here are the year-to-date (YTD) performances of the most requested S&P 500 stocks at 12Stocks.com (click stock for review):
| NVIDIA 54% | ||
| Caterpillar 20% | ||
| Merck 15% | ||
| Amazon.com 15% | ||
| Walmart 13% | ||
| Google 10% | ||
| JPMorgan Chase 9% | ||
| Chevron 7% | ||
| Microsoft 6% | ||
| Goldman Sachs 5% | ||
| Johnson & Johnson -6% | ||
| McDonald s -8% | ||
| Starbucks -9% | ||
| Apple -14% | ||
| Gilead -18% | ||
| Intel -32% | ||
| Boeing -35% | ||
| Quick: S&P 500 Stocks Lists: Performances & Trends, S&P 500 Stock Charts
Sort S&P 500 stocks: Daily, Weekly, Year-to-Date, Market Cap & Trends. Filter S&P 500 stocks list by sector: Show all, Tech, Finance, Energy, Staples, Retail, Industrial, Materials, Utilities and HealthCare |
| 12Stocks.com S&P 500 Stocks Performances & Trends Daily Report | |||||||||
|
| 
The overall Smart Investing & Trading Score is 26 (0-bearish to 100-bullish) which puts S&P 500 index in short term bearish to neutral trend. The Smart Investing & Trading Score from previous trading session is 36 and hence a deterioration of trend. | ||||||||
Here are the Smart Investing & Trading Scores of the most requested S&P 500 stocks at 12Stocks.com (click stock name for detailed review):
|


| 12Stocks.com: Top Performing S&P 500 Index Stocks | ||||||||||||||||||||||||||||||||||||||||||||||||
 The top performing S&P 500 Index stocks year to date are
Now, more recently, over last week, the top performing S&P 500 Index stocks on the move are


|
||||||||||||||||||||||||||||||||||||||||||||||||
| 12Stocks.com: Investing in S&P 500 Index with Stocks | |
|
The following table helps investors and traders sort through current performance and trends (as measured by Smart Investing & Trading Score) of various
stocks in the S&P 500 Index. Quick View: Move mouse or cursor over stock symbol (ticker) to view short-term technical chart and over stock name to view long term chart. Click on  to add stock symbol to your watchlist and to add stock symbol to your watchlist and  to view watchlist. Click on any ticker or stock name for detailed market intelligence report for that stock. to view watchlist. Click on any ticker or stock name for detailed market intelligence report for that stock. |
12Stocks.com Performance of Stocks in S&P 500 Index
| Ticker | Stock Name | Watchlist | Category | Recent Price | Smart Investing & Trading Score | Change % | YTD Change% |
| VRSK | Verisk Analytics |   | Services & Goods | 222.52 | 18 | -0.36% | -6.84% |
| DLTR | Dollar Tree | | Services & Goods | 122.03 | 10 | -0.16% | -14.09% |
| PAYX | Paychex | | Services & Goods | 119.52 | 17 | 1.47% | 0.34% |
| CTAS | Cintas | | Services & Goods | 661.29 | 26 | -0.17% | 9.73% |
| AZO | AutoZone | | Services & Goods | 2985.54 | 58 | 0.42% | 15.47% |
| HLT | Hilton Worldwide | | Services & Goods | 194.47 | 26 | -2.19% | 6.80% |
| YUM | Yum! Brands | | Services & Goods | 138.50 | 75 | 0.46% | 6.00% |
| FAST | Fastenal | | Services & Goods | 67.57 | 10 | 0.10% | 4.32% |
| CMG | Chipotle Mexican | | Services & Goods | 2869.11 | 31 | -1.34% | 25.46% |
| BBY | Best Buy | | Services & Goods | 76.15 | 58 | 0.20% | -2.72% |
| CPRT | Copart | | Services & Goods | 52.88 | 36 | -0.60% | 7.92% |
| CAH | Cardinal Health | | Services & Goods | 108.19 | 32 | 2.07% | 7.33% |
| FOXA | Fox | | Services & Goods | 31.39 | 60 | 2.01% | 5.80% |
| ROL | Rollins | | Services & Goods | 42.51 | 10 | 0.16% | -2.66% |
| GWW | W.W. Grainger | | Services & Goods | 942.65 | 36 | 0.55% | 13.75% |
| DPZ | Domino s | | Services & Goods | 473.55 | 31 | -1.68% | 14.88% |
| OMC | Omnicom | | Services & Goods | 92.62 | 61 | 1.22% | 7.06% |
| CCL | Carnival | | Services & Goods | 14.12 | 25 | -0.42% | -23.84% |
| J | Jacobs Engineering | | Services & Goods | 143.83 | 48 | 0.23% | 10.81% |
| TSCO | Tractor Supply | | Services & Goods | 252.79 | 68 | 2.20% | 17.56% |
| ULTA | Ulta Beauty | | Services & Goods | 413.50 | 10 | -2.73% | -15.61% |
| GPC | Genuine Parts | | Services & Goods | 162.39 | 100 | 1.35% | 17.25% |
| ALLE | Allegion | | Services & Goods | 125.21 | 36 | 0.30% | -1.17% |
| LYV | Live Nation | | Services & Goods | 89.96 | 36 | 0.36% | -3.89% |
| KMX | CarMax | | Services & Goods | 68.34 | 10 | 0.63% | -10.95% |
| For chart view version of above stock list: Chart View ➞ 0 - 25 , 25 - 50 , 50 - 75 | ||
 | Click To Change The Sort Order: By Market Cap or Company Size Performance: Year-to-date, Week and Day |  |
|
Get the most comprehensive stock market coverage daily at 12Stocks.com ➞ Best Stocks Today ➞ Best Stocks Weekly ➞ Best Stocks Year-to-Date ➞ Best Stocks Trends ➞  Best Stocks Today 12Stocks.com Best Nasdaq Stocks ➞ Best S&P 500 Stocks ➞ Best Tech Stocks ➞ Best Biotech Stocks ➞ |
| Detailed Overview of S&P 500 Stocks |
| S&P 500 Technical Overview, Leaders & Laggards, Top S&P 500 ETF Funds & Detailed S&P 500 Stocks List, Charts, Trends & More |
| S&P 500: Technical Analysis, Trends & YTD Performance | |
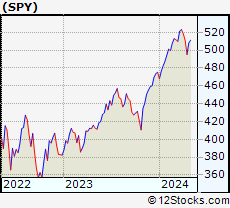
| S&P 500 index as represented by
SPY, an exchange-traded fund [ETF], holds basket of five hundred (mostly largecap) stocks from across all major sectors of the US stock market. The S&P 500 index (contains stocks like Apple and Exxon) is up by 4.18% and is currently outperforming the overall market by 0.8% year-to-date. Below is a quick view of technical charts and trends: | |
 SPY Weekly Chart |
|
| Long Term Trend: Good | |
| Medium Term Trend: Not Good | |
 SPY Daily Chart |
|
| Short Term Trend: Not Good | |
| Overall Trend Score: 26 | |
| YTD Performance: 4.18% | |
| **Trend Scores & Views Are Only For Educational Purposes And Not For Investing | |
| 12Stocks.com: Investing in S&P 500 Index using Exchange Traded Funds | |
|
The following table shows list of key exchange traded funds (ETF) that
help investors track S&P 500 index. The following list also includes leveraged ETF funds that track twice or thrice the daily returns of S&P 500 indices. Short or inverse ETF funds move in the opposite direction to the index they track and are useful during market pullbacks or during bear markets. Quick View: Move mouse or cursor over ETF symbol (ticker) to view short-term technical chart and over ETF name to view long term chart. Click on ticker or stock name for detailed view. Click on to add stock symbol to your watchlist and to view watchlist. |
12Stocks.com List of ETFs that track S&P 500 Index
| Ticker | ETF Name | Watchlist | Recent Price | Smart Investing & Trading Score | Change % | Week % | Year-to-date % |
| SPY | SPDR S&P 500 ETF | | 495.16 | 26 | -0.87 | -3.07 | 4.18% |
| IVV | iShares Core S&P 500 ETF | | 497.53 | 36 | -0.87 | -3.07 | 4.17% |
| VOO | Vanguard 500 ETF | | 455.10 | 36 | -0.84 | -3.08 | 4.19% |
| OEF | iShares S&P 100 | | 234.68 | 26 | -1.24 | -3.48 | 5.05% |
| SSO | ProShares Ultra S&P500 | | 69.11 | 26 | -1.73 | -6.18 | 6.21% |
| UPRO | ProShares UltraPro S&P500 | | 59.16 | 26 | -2.67 | -9.26 | 8.07% |
| SPXL | Direxion Daily S&P500 Bull 3X ETF | | 112.55 | 36 | -2.58 | -9.12 | 8.23% |
| SH | ProShares Short S&P500 | | 12.59 | 74 | 0.96 | 3.28 | -3.08% |
| SDS | ProShares UltraShort S&P500 | | 27.90 | 74 | 1.79 | 6.61 | -6.75% |
| SPXU | ProShares UltraPro Short S&P500 | | 38.33 | 74 | 2.68 | 9.95 | -10.86% |
| SPXS | Direxion Daily S&P 500 Bear 3X ETF | | 10.36 | 49 | 2.47 | 9.98 | -10.3% |
| 12Stocks.com: Charts, Trends, Fundamental Data and Performances of S&P 500 Stocks | |
|
We now take in-depth look at all S&P 500 stocks including charts, multi-period performances and overall trends (as measured by Smart Investing & Trading Score). One can sort S&P 500 stocks (click link to choose) by Daily, Weekly and by Year-to-Date performances. Also, one can sort by size of the company or by market capitalization. |
| Select Your Default Chart Type: | |||||
| |||||
| Click on stock symbol or name for detailed view. Click on to add stock symbol to your watchlist and to view watchlist. Quick View: Move mouse or cursor over "Daily" to quickly view daily technical stock chart and over "Weekly" to view weekly technical stock chart. | |||||

 | VRSK Verisk Analytics, Inc. |
| Sector: Services & Goods | |
| SubSector: Business Services | |
| MarketCap: 22033.2 Millions | |
| Recent Price: 222.52 Smart Investing & Trading Score: 18 | |
| Day Percent Change: -0.36% Day Change: -0.81 | |
| Week Change: 0% Year-to-date Change: -6.8% | |
| VRSK Links: Profile News Message Board | |
| Charts:- Daily , Weekly | |
| Add VRSK to Watchlist: View: Get VRSK Trend Analysis ➞ | |
 | DLTR Dollar Tree, Inc. |
| Sector: Services & Goods | |
| SubSector: Discount, Variety Stores | |
| MarketCap: 21383.2 Millions | |
| Recent Price: 122.03 Smart Investing & Trading Score: 10 | |
| Day Percent Change: -0.16% Day Change: -0.20 | |
| Week Change: -2.52% Year-to-date Change: -14.1% | |
| DLTR Links: Profile News Message Board | |
| Charts:- Daily , Weekly | |
| Add DLTR to Watchlist: View: Get DLTR Trend Analysis ➞ | |
 | PAYX Paychex, Inc. |
| Sector: Services & Goods | |
| SubSector: Staffing & Outsourcing Services | |
| MarketCap: 20928.8 Millions | |
| Recent Price: 119.52 Smart Investing & Trading Score: 17 | |
| Day Percent Change: 1.47% Day Change: 1.73 | |
| Week Change: -2.83% Year-to-date Change: 0.3% | |
| PAYX Links: Profile News Message Board | |
| Charts:- Daily , Weekly | |
| Add PAYX to Watchlist: View: Get PAYX Trend Analysis ➞ | |
 | CTAS Cintas Corporation |
| Sector: Services & Goods | |
| SubSector: Business Services | |
| MarketCap: 20154.6 Millions | |
| Recent Price: 661.29 Smart Investing & Trading Score: 26 | |
| Day Percent Change: -0.17% Day Change: -1.15 | |
| Week Change: -1.07% Year-to-date Change: 9.7% | |
| CTAS Links: Profile News Message Board | |
| Charts:- Daily , Weekly | |
| Add CTAS to Watchlist: View: Get CTAS Trend Analysis ➞ | |
 | AZO AutoZone, Inc. |
| Sector: Services & Goods | |
| SubSector: Auto Parts Stores | |
| MarketCap: 19128 Millions | |
| Recent Price: 2985.54 Smart Investing & Trading Score: 58 | |
| Day Percent Change: 0.42% Day Change: 12.37 | |
| Week Change: 0.78% Year-to-date Change: 15.5% | |
| AZO Links: Profile News Message Board | |
| Charts:- Daily , Weekly | |
| Add AZO to Watchlist: View: Get AZO Trend Analysis ➞ | |
 | HLT Hilton Worldwide Holdings Inc. |
| Sector: Services & Goods | |
| SubSector: Lodging | |
| MarketCap: 18064.6 Millions | |
| Recent Price: 194.47 Smart Investing & Trading Score: 26 | |
| Day Percent Change: -2.19% Day Change: -4.35 | |
| Week Change: -5.18% Year-to-date Change: 6.8% | |
| HLT Links: Profile News Message Board | |
| Charts:- Daily , Weekly | |
| Add HLT to Watchlist: View: Get HLT Trend Analysis ➞ | |
 | YUM Yum! Brands, Inc. |
| Sector: Services & Goods | |
| SubSector: Restaurants | |
| MarketCap: 18033.3 Millions | |
| Recent Price: 138.50 Smart Investing & Trading Score: 75 | |
| Day Percent Change: 0.46% Day Change: 0.63 | |
| Week Change: 0.51% Year-to-date Change: 6.0% | |
| YUM Links: Profile News Message Board | |
| Charts:- Daily , Weekly | |
| Add YUM to Watchlist: View: Get YUM Trend Analysis ➞ | |
 | FAST Fastenal Company |
| Sector: Services & Goods | |
| SubSector: Industrial Equipment Wholesale | |
| MarketCap: 17609.9 Millions | |
| Recent Price: 67.57 Smart Investing & Trading Score: 10 | |
| Day Percent Change: 0.10% Day Change: 0.07 | |
| Week Change: -3.31% Year-to-date Change: 4.3% | |
| FAST Links: Profile News Message Board | |
| Charts:- Daily , Weekly | |
| Add FAST to Watchlist: View: Get FAST Trend Analysis ➞ | |
 | CMG Chipotle Mexican Grill, Inc. |
| Sector: Services & Goods | |
| SubSector: Restaurants | |
| MarketCap: 16849.9 Millions | |
| Recent Price: 2869.11 Smart Investing & Trading Score: 31 | |
| Day Percent Change: -1.34% Day Change: -38.86 | |
| Week Change: -2.99% Year-to-date Change: 25.5% | |
| CMG Links: Profile News Message Board | |
| Charts:- Daily , Weekly | |
| Add CMG to Watchlist: View: Get CMG Trend Analysis ➞ | |
 | BBY Best Buy Co., Inc. |
| Sector: Services & Goods | |
| SubSector: Electronics Stores | |
| MarketCap: 15771.3 Millions | |
| Recent Price: 76.15 Smart Investing & Trading Score: 58 | |
| Day Percent Change: 0.20% Day Change: 0.15 | |
| Week Change: -2.37% Year-to-date Change: -2.7% | |
| BBY Links: Profile News Message Board | |
| Charts:- Daily , Weekly | |
| Add BBY to Watchlist: View: Get BBY Trend Analysis ➞ | |
 | CPRT Copart, Inc. |
| Sector: Services & Goods | |
| SubSector: Auto Dealerships | |
| MarketCap: 15462.1 Millions | |
| Recent Price: 52.88 Smart Investing & Trading Score: 36 | |
| Day Percent Change: -0.60% Day Change: -0.32 | |
| Week Change: -4.51% Year-to-date Change: 7.9% | |
| CPRT Links: Profile News Message Board | |
| Charts:- Daily , Weekly | |
| Add CPRT to Watchlist: View: Get CPRT Trend Analysis ➞ | |
 | CAH Cardinal Health, Inc. |
| Sector: Services & Goods | |
| SubSector: Drugs Wholesale | |
| MarketCap: 14509.9 Millions | |
| Recent Price: 108.19 Smart Investing & Trading Score: 32 | |
| Day Percent Change: 2.07% Day Change: 2.19 | |
| Week Change: 2.94% Year-to-date Change: 7.3% | |
| CAH Links: Profile News Message Board | |
| Charts:- Daily , Weekly | |
| Add CAH to Watchlist: View: Get CAH Trend Analysis ➞ | |
 | FOXA Fox Corporation |
| Sector: Services & Goods | |
| SubSector: Entertainment - Diversified | |
| MarketCap: 13440.7 Millions | |
| Recent Price: 31.39 Smart Investing & Trading Score: 60 | |
| Day Percent Change: 2.01% Day Change: 0.62 | |
| Week Change: 2.11% Year-to-date Change: 5.8% | |
| FOXA Links: Profile News Message Board | |
| Charts:- Daily , Weekly | |
| Add FOXA to Watchlist: View: Get FOXA Trend Analysis ➞ | |
 | ROL Rollins, Inc. |
| Sector: Services & Goods | |
| SubSector: Business Services | |
| MarketCap: 12827.4 Millions | |
| Recent Price: 42.51 Smart Investing & Trading Score: 10 | |
| Day Percent Change: 0.16% Day Change: 0.07 | |
| Week Change: -4.15% Year-to-date Change: -2.7% | |
| ROL Links: Profile News Message Board | |
| Charts:- Daily , Weekly | |
| Add ROL to Watchlist: View: Get ROL Trend Analysis ➞ | |
 | GWW W.W. Grainger, Inc. |
| Sector: Services & Goods | |
| SubSector: Industrial Equipment Wholesale | |
| MarketCap: 12794.8 Millions | |
| Recent Price: 942.65 Smart Investing & Trading Score: 36 | |
| Day Percent Change: 0.55% Day Change: 5.11 | |
| Week Change: -2.31% Year-to-date Change: 13.8% | |
| GWW Links: Profile News Message Board | |
| Charts:- Daily , Weekly | |
| Add GWW to Watchlist: View: Get GWW Trend Analysis ➞ | |
 | DPZ Domino s Pizza, Inc. |
| Sector: Services & Goods | |
| SubSector: Restaurants | |
| MarketCap: 12166 Millions | |
| Recent Price: 473.55 Smart Investing & Trading Score: 31 | |
| Day Percent Change: -1.68% Day Change: -8.11 | |
| Week Change: -4.39% Year-to-date Change: 14.9% | |
| DPZ Links: Profile News Message Board | |
| Charts:- Daily , Weekly | |
| Add DPZ to Watchlist: View: Get DPZ Trend Analysis ➞ | |
 | OMC Omnicom Group Inc. |
| Sector: Services & Goods | |
| SubSector: Advertising Agencies | |
| MarketCap: 11813.5 Millions | |
| Recent Price: 92.62 Smart Investing & Trading Score: 61 | |
| Day Percent Change: 1.22% Day Change: 1.12 | |
| Week Change: 2.24% Year-to-date Change: 7.1% | |
| OMC Links: Profile News Message Board | |
| Charts:- Daily , Weekly | |
| Add OMC to Watchlist: View: Get OMC Trend Analysis ➞ | |
 | CCL Carnival Corporation & Plc |
| Sector: Services & Goods | |
| SubSector: Resorts & Casinos | |
| MarketCap: 11725.4 Millions | |
| Recent Price: 14.12 Smart Investing & Trading Score: 25 | |
| Day Percent Change: -0.42% Day Change: -0.06 | |
| Week Change: -1.67% Year-to-date Change: -23.8% | |
| CCL Links: Profile News Message Board | |
| Charts:- Daily , Weekly | |
| Add CCL to Watchlist: View: Get CCL Trend Analysis ➞ | |
 | J Jacobs Engineering Group Inc. |
| Sector: Services & Goods | |
| SubSector: Technical Services | |
| MarketCap: 9714.8 Millions | |
| Recent Price: 143.83 Smart Investing & Trading Score: 48 | |
| Day Percent Change: 0.23% Day Change: 0.33 | |
| Week Change: -0.57% Year-to-date Change: 10.8% | |
| J Links: Profile News Message Board | |
| Charts:- Daily , Weekly | |
| Add J to Watchlist: View: Get J Trend Analysis ➞ | |
 | TSCO Tractor Supply Company |
| Sector: Services & Goods | |
| SubSector: Specialty Retail, Other | |
| MarketCap: 9692.94 Millions | |
| Recent Price: 252.79 Smart Investing & Trading Score: 68 | |
| Day Percent Change: 2.20% Day Change: 5.44 | |
| Week Change: 3.23% Year-to-date Change: 17.6% | |
| TSCO Links: Profile News Message Board | |
| Charts:- Daily , Weekly | |
| Add TSCO to Watchlist: View: Get TSCO Trend Analysis ➞ | |
 | ULTA Ulta Beauty, Inc. |
| Sector: Services & Goods | |
| SubSector: Specialty Retail, Other | |
| MarketCap: 9429.94 Millions | |
| Recent Price: 413.50 Smart Investing & Trading Score: 10 | |
| Day Percent Change: -2.73% Day Change: -11.61 | |
| Week Change: -6.52% Year-to-date Change: -15.6% | |
| ULTA Links: Profile News Message Board | |
| Charts:- Daily , Weekly | |
| Add ULTA to Watchlist: View: Get ULTA Trend Analysis ➞ | |
 | GPC Genuine Parts Company |
| Sector: Services & Goods | |
| SubSector: Auto Parts Stores | |
| MarketCap: 8605.9 Millions | |
| Recent Price: 162.39 Smart Investing & Trading Score: 100 | |
| Day Percent Change: 1.35% Day Change: 2.16 | |
| Week Change: 11.7% Year-to-date Change: 17.3% | |
| GPC Links: Profile News Message Board | |
| Charts:- Daily , Weekly | |
| Add GPC to Watchlist: View: Get GPC Trend Analysis ➞ | |
 | ALLE Allegion plc |
| Sector: Services & Goods | |
| SubSector: Security & Protection Services | |
| MarketCap: 8515.93 Millions | |
| Recent Price: 125.21 Smart Investing & Trading Score: 36 | |
| Day Percent Change: 0.30% Day Change: 0.37 | |
| Week Change: -1.73% Year-to-date Change: -1.2% | |
| ALLE Links: Profile News Message Board | |
| Charts:- Daily , Weekly | |
| Add ALLE to Watchlist: View: Get ALLE Trend Analysis ➞ | |
 | LYV Live Nation Entertainment, Inc. |
| Sector: Services & Goods | |
| SubSector: Entertainment - Diversified | |
| MarketCap: 8457.17 Millions | |
| Recent Price: 89.96 Smart Investing & Trading Score: 36 | |
| Day Percent Change: 0.36% Day Change: 0.32 | |
| Week Change: -10.97% Year-to-date Change: -3.9% | |
| LYV Links: Profile News Message Board | |
| Charts:- Daily , Weekly | |
| Add LYV to Watchlist: View: Get LYV Trend Analysis ➞ | |
 | KMX CarMax, Inc. |
| Sector: Services & Goods | |
| SubSector: Auto Dealerships | |
| MarketCap: 8121.71 Millions | |
| Recent Price: 68.34 Smart Investing & Trading Score: 10 | |
| Day Percent Change: 0.63% Day Change: 0.43 | |
| Week Change: -4.3% Year-to-date Change: -11.0% | |
| KMX Links: Profile News Message Board | |
| Charts:- Daily , Weekly | |
| Add KMX to Watchlist: View: Get KMX Trend Analysis ➞ | |
| For tabular summary view of above stock list: Summary View ➞ 0 - 25 , 25 - 50 , 50 - 75 | ||
| Click To Change The Sort Order: By Market Cap or Company Size Performance: Year-to-date, Week and Day | |
| Select Chart Type: | ||
|
Best Stocks Today 12Stocks.com |
© 2024 12Stocks.com Terms & Conditions Privacy Contact Us
All Information Provided Only For Education And Not To Be Used For Investing or Trading. See Terms & Conditions


One More Thing ... Get Best Stocks Delivered Daily!
Never Ever Miss A Move With Our Top Ten Stocks Lists
Find Best Stocks In Any Market - Bull or Bear Market
Take A Peek At Our Top Ten Stocks Lists: Daily, Weekly, Year-to-Date & Top Trends
Find Best Stocks In Any Market - Bull or Bear Market
Take A Peek At Our Top Ten Stocks Lists: Daily, Weekly, Year-to-Date & Top Trends
S&P 500 Stocks With Best Up Trends [0-bearish to 100-bullish]: Kinder Morgan[100], Entergy [100], Bunge [100], Philip Morris[100], Wells Fargo[100], Dominion [100], Duke [100], Tyson Foods[100], Lockheed Martin[100], Genuine Parts[100], Consolidated Edison[100]
Best S&P 500 Stocks Year-to-Date:
Constellation [54.47%], NVIDIA [53.87%], Meta Platforms[38.28%], NRG [35.34%], Progressive [34.79%], Marathon [32.37%], Targa Resources[29.99%], Diamondback [29.44%], Western Digital[26.12%], Valero [26.07%], Eaton [25.83%] Best S&P 500 Stocks This Week:
United Airlines[22.92%], UnitedHealth [14.1%], Globe Life[12.95%], Genuine Parts[11.7%], ProShares UltraPro[9.95%], American Airlines[7.3%], Wells Fargo[6.87%], Southwest Airlines[6.68%], M&T Bank[6.55%], General Mills[6.37%], Centene [6.25%] Best S&P 500 Stocks Daily:
American Express[6.23%], Fifth Third[5.93%], Walgreens Boots[3.70%], Kinder Morgan[3.46%], Bank of America[3.35%], Citizens Financial[3.31%], J. M.[3.29%], Truist Financial[3.05%], PNC Financial[2.98%], M&T Bank[2.93%], Entergy [2.91%]