
 Login Sign Up


| |||||
 |  | ||||

| 12Stocks.com Market Intelligence |
Best S&P 500 Stocks
|
On this page, you will find the most comprehensive analysis of S&P 500 stocks and ETFs - from latest trends to performances to charts ➞. First, here are the year-to-date (YTD) performances of the most requested S&P 500 stocks at 12Stocks.com (click stock for review):
| NVIDIA 70% | ||
| Caterpillar 21% | ||
| Amazon.com 19% | ||
| Merck 15% | ||
| Walmart 14% | ||
| Google 11% | ||
| Microsoft 10% | ||
| JPMorgan Chase 6% | ||
| Chevron 5% | ||
| Goldman Sachs 5% | ||
| Johnson & Johnson -8% | ||
| McDonald s -9% | ||
| Starbucks -10% | ||
| Apple -13% | ||
| Gilead -17% | ||
| Intel -29% | ||
| Boeing -35% | ||
| Quick: S&P 500 Stocks Lists: Performances & Trends, S&P 500 Stock Charts
Sort S&P 500 stocks: Daily, Weekly, Year-to-Date, Market Cap & Trends. Filter S&P 500 stocks list by sector: Show all, Tech, Finance, Energy, Staples, Retail, Industrial, Materials, Utilities and HealthCare |
| 12Stocks.com S&P 500 Stocks Performances & Trends Daily Report | |||||||||
|
| 
The overall Smart Investing & Trading Score is 26 (0-bearish to 100-bullish) which puts S&P 500 index in short term bearish to neutral trend. The Smart Investing & Trading Score from previous trading session is 31 and a deterioration of trend continues. | ||||||||
Here are the Smart Investing & Trading Scores of the most requested S&P 500 stocks at 12Stocks.com (click stock name for detailed review):
|


| 12Stocks.com: Top Performing S&P 500 Index Stocks | ||||||||||||||||||||||||||||||||||||||||||||||||
 The top performing S&P 500 Index stocks year to date are
Now, more recently, over last week, the top performing S&P 500 Index stocks on the move are


|
||||||||||||||||||||||||||||||||||||||||||||||||
| 12Stocks.com: Investing in S&P 500 Index with Stocks | |
|
The following table helps investors and traders sort through current performance and trends (as measured by Smart Investing & Trading Score) of various
stocks in the S&P 500 Index. Quick View: Move mouse or cursor over stock symbol (ticker) to view short-term technical chart and over stock name to view long term chart. Click on  to add stock symbol to your watchlist and to add stock symbol to your watchlist and  to view watchlist. Click on any ticker or stock name for detailed market intelligence report for that stock. to view watchlist. Click on any ticker or stock name for detailed market intelligence report for that stock. |
12Stocks.com Performance of Stocks in S&P 500 Index
| Ticker | Stock Name | Watchlist | Category | Recent Price | Smart Investing & Trading Score | Change % | YTD Change% |
| LDOS | Leidos Holdings |   | Technology | 124.36 | 41 | -0.22% | 14.89% |
| EPAM | EPAM Systems | | Technology | 249.00 | 0 | -0.76% | -16.26% |
| ZBRA | Zebra Technologies | | Technology | 276.14 | 36 | -1.52% | 1.03% |
| ATO | Atmos | | Utilities | 114.56 | 48 | 1.99% | -1.16% |
| MAA | Mid-America Apartment | | Financials | 124.80 | 17 | 0.82% | -7.18% |
| EXR | Extra Space | | Financials | 136.10 | 17 | 0.21% | -15.11% |
| VTR | Ventas | | Financials | 42.23 | 27 | 1.32% | -15.27% |
| DGX | Quest Diagnostics | | Health Care | 126.98 | 10 | -0.35% | -7.91% |
| MRNA | Moderna | | Health Care | 103.44 | 36 | -0.34% | 4.01% |
| STE | STERIS | | Health Care | 200.24 | 10 | 0.62% | -8.92% |
| STX | Seagate | | Technology | 84.20 | 17 | 0.62% | -1.37% |
| OKE | ONEOK | | Utilities | 77.68 | 46 | 0.78% | 10.62% |
| TYL | Tyler Technologies | | Technology | 402.84 | 17 | 0.91% | -3.65% |
| L | Loews | | Financials | 73.14 | 23 | -0.25% | 5.10% |
| DOV | Dover | | Industrials | 169.50 | 43 | -0.97% | 10.20% |
| WDC | Western Digital | | Technology | 70.17 | 58 | -1.25% | 33.99% |
| JKHY | Jack Henry | | Technology | 164.67 | 23 | 0.56% | 0.77% |
| LNT | Alliant | | Utilities | 48.42 | 55 | 2.15% | -5.61% |
| BIO | Bio-Rad | | Health Care | 290.86 | 20 | -0.65% | -9.92% |
| BR | Broadridge Financial | | Technology | 193.45 | 0 | -0.08% | -5.98% |
| MLM | Martin Marietta | | Industrials | 592.92 | 38 | -0.39% | 18.84% |
| BRO | Brown & Brown | | Financials | 80.62 | 36 | -0.37% | 13.37% |
| HES | Hess | | Energy | 150.80 | 43 | 0.36% | 4.61% |
| NUE | Nucor | | Materials | 192.78 | 38 | 0.35% | 10.77% |
| FITB | Fifth Third | | Financials | 34.10 | 35 | 0.03% | -1.13% |
| For chart view version of above stock list: Chart View ➞ 0 - 25 , 25 - 50 , 50 - 75 , 75 - 100 , 100 - 125 , 125 - 150 , 150 - 175 , 175 - 200 , 200 - 225 , 225 - 250 , 250 - 275 , 275 - 300 , 300 - 325 , 325 - 350 , 350 - 375 , 375 - 400 , 400 - 425 , 425 - 450 , 450 - 475 , 475 - 500 | ||
 | Click To Change The Sort Order: By Market Cap or Company Size Performance: Year-to-date, Week and Day |  |
|
Get the most comprehensive stock market coverage daily at 12Stocks.com ➞ Best Stocks Today ➞ Best Stocks Weekly ➞ Best Stocks Year-to-Date ➞ Best Stocks Trends ➞  Best Stocks Today 12Stocks.com Best Nasdaq Stocks ➞ Best S&P 500 Stocks ➞ Best Tech Stocks ➞ Best Biotech Stocks ➞ |
| Detailed Overview of S&P 500 Stocks |
| S&P 500 Technical Overview, Leaders & Laggards, Top S&P 500 ETF Funds & Detailed S&P 500 Stocks List, Charts, Trends & More |
| S&P 500: Technical Analysis, Trends & YTD Performance | |
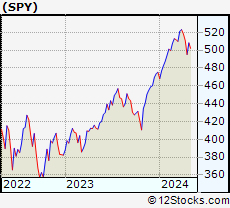
| S&P 500 index as represented by
SPY, an exchange-traded fund [ETF], holds basket of five hundred (mostly largecap) stocks from across all major sectors of the US stock market. The S&P 500 index (contains stocks like Apple and Exxon) is up by 5.31% and is currently outperforming the overall market by 0.9% year-to-date. Below is a quick view of technical charts and trends: | |
 SPY Weekly Chart |
|
| Long Term Trend: Good | |
| Medium Term Trend: Not Good | |
 SPY Daily Chart |
|
| Short Term Trend: Not Good | |
| Overall Trend Score: 26 | |
| YTD Performance: 5.31% | |
| **Trend Scores & Views Are Only For Educational Purposes And Not For Investing | |
| 12Stocks.com: Investing in S&P 500 Index using Exchange Traded Funds | |
|
The following table shows list of key exchange traded funds (ETF) that
help investors track S&P 500 index. The following list also includes leveraged ETF funds that track twice or thrice the daily returns of S&P 500 indices. Short or inverse ETF funds move in the opposite direction to the index they track and are useful during market pullbacks or during bear markets. Quick View: Move mouse or cursor over ETF symbol (ticker) to view short-term technical chart and over ETF name to view long term chart. Click on ticker or stock name for detailed view. Click on to add stock symbol to your watchlist and to view watchlist. |
12Stocks.com List of ETFs that track S&P 500 Index
| Ticker | ETF Name | Watchlist | Recent Price | Smart Investing & Trading Score | Change % | Week % | Year-to-date % |
| SPY | SPDR S&P 500 ETF | | 500.55 | 26 | -0.59 | -2.02 | 5.31% |
| IVV | iShares Core S&P 500 ETF | | 503.04 | 26 | -0.62 | -2 | 5.32% |
| VOO | Vanguard 500 ETF | | 459.99 | 26 | -0.65 | -2.04 | 5.31% |
| OEF | iShares S&P 100 | | 237.92 | 26 | -0.62 | -2.15 | 6.5% |
| SSO | ProShares Ultra S&P500 | | 70.66 | 26 | -1.24 | -4.07 | 8.59% |
| UPRO | ProShares UltraPro S&P500 | | 61.26 | 26 | -1.78 | -6.04 | 11.91% |
| SPXL | Direxion Daily S&P500 Bull 3X ETF | | 116.35 | 26 | -1.96 | -6.05 | 11.89% |
| SH | ProShares Short S&P500 | | 12.44 | 74 | 0.57 | 2.05 | -4.23% |
| SDS | ProShares UltraShort S&P500 | | 27.27 | 74 | 1.26 | 4.2 | -8.86% |
| SPXU | ProShares UltraPro Short S&P500 | | 37.07 | 74 | 1.90 | 6.34 | -13.79% |
| SPXS | Direxion Daily S&P 500 Bear 3X ETF | | 10.01 | 69 | 1.83 | 6.26 | -13.33% |
| 12Stocks.com: Charts, Trends, Fundamental Data and Performances of S&P 500 Stocks | |
|
We now take in-depth look at all S&P 500 stocks including charts, multi-period performances and overall trends (as measured by Smart Investing & Trading Score). One can sort S&P 500 stocks (click link to choose) by Daily, Weekly and by Year-to-Date performances. Also, one can sort by size of the company or by market capitalization. |
| Select Your Default Chart Type: | |||||
| |||||
| Click on stock symbol or name for detailed view. Click on to add stock symbol to your watchlist and to view watchlist. Quick View: Move mouse or cursor over "Daily" to quickly view daily technical stock chart and over "Weekly" to view weekly technical stock chart. | |||||

 | LDOS Leidos Holdings, Inc. |
| Sector: Technology | |
| SubSector: Information Technology Services | |
| MarketCap: 11707.5 Millions | |
| Recent Price: 124.36 Smart Investing & Trading Score: 41 | |
| Day Percent Change: -0.22% Day Change: -0.28 | |
| Week Change: -1.09% Year-to-date Change: 14.9% | |
| LDOS Links: Profile News Message Board | |
| Charts:- Daily , Weekly | |
| Add LDOS to Watchlist: View: Get LDOS Trend Analysis ➞ | |
 | EPAM EPAM Systems, Inc. |
| Sector: Technology | |
| SubSector: Information Technology Services | |
| MarketCap: 11519.6 Millions | |
| Recent Price: 249.00 Smart Investing & Trading Score: 0 | |
| Day Percent Change: -0.76% Day Change: -1.90 | |
| Week Change: -3.92% Year-to-date Change: -16.3% | |
| EPAM Links: Profile News Message Board | |
| Charts:- Daily , Weekly | |
| Add EPAM to Watchlist: View: Get EPAM Trend Analysis ➞ | |
 | ZBRA Zebra Technologies Corporation |
| Sector: Technology | |
| SubSector: Communication Equipment | |
| MarketCap: 11474.9 Millions | |
| Recent Price: 276.14 Smart Investing & Trading Score: 36 | |
| Day Percent Change: -1.52% Day Change: -4.28 | |
| Week Change: -4.67% Year-to-date Change: 1.0% | |
| ZBRA Links: Profile News Message Board | |
| Charts:- Daily , Weekly | |
| Add ZBRA to Watchlist: View: Get ZBRA Trend Analysis ➞ | |
 | ATO Atmos Energy Corporation |
| Sector: Utilities | |
| SubSector: Gas Utilities | |
| MarketCap: 11449 Millions | |
| Recent Price: 114.56 Smart Investing & Trading Score: 48 | |
| Day Percent Change: 1.99% Day Change: 2.23 | |
| Week Change: 0.5% Year-to-date Change: -1.2% | |
| ATO Links: Profile News Message Board | |
| Charts:- Daily , Weekly | |
| Add ATO to Watchlist: View: Get ATO Trend Analysis ➞ | |
 | MAA Mid-America Apartment Communities, Inc. |
| Sector: Financials | |
| SubSector: REIT - Residential | |
| MarketCap: 11385.5 Millions | |
| Recent Price: 124.80 Smart Investing & Trading Score: 17 | |
| Day Percent Change: 0.82% Day Change: 1.01 | |
| Week Change: -2.6% Year-to-date Change: -7.2% | |
| MAA Links: Profile News Message Board | |
| Charts:- Daily , Weekly | |
| Add MAA to Watchlist: View: Get MAA Trend Analysis ➞ | |
 | EXR Extra Space Storage Inc. |
| Sector: Financials | |
| SubSector: REIT - Industrial | |
| MarketCap: 11203.9 Millions | |
| Recent Price: 136.10 Smart Investing & Trading Score: 17 | |
| Day Percent Change: 0.21% Day Change: 0.29 | |
| Week Change: -3.26% Year-to-date Change: -15.1% | |
| EXR Links: Profile News Message Board | |
| Charts:- Daily , Weekly | |
| Add EXR to Watchlist: View: Get EXR Trend Analysis ➞ | |
 | VTR Ventas, Inc. |
| Sector: Financials | |
| SubSector: REIT - Healthcare Facilities | |
| MarketCap: 11180.4 Millions | |
| Recent Price: 42.23 Smart Investing & Trading Score: 27 | |
| Day Percent Change: 1.32% Day Change: 0.55 | |
| Week Change: -1.4% Year-to-date Change: -15.3% | |
| VTR Links: Profile News Message Board | |
| Charts:- Daily , Weekly | |
| Add VTR to Watchlist: View: Get VTR Trend Analysis ➞ | |
 | DGX Quest Diagnostics Incorporated |
| Sector: Health Care | |
| SubSector: Medical Laboratories & Research | |
| MarketCap: 11076.1 Millions | |
| Recent Price: 126.98 Smart Investing & Trading Score: 10 | |
| Day Percent Change: -0.35% Day Change: -0.44 | |
| Week Change: -1.21% Year-to-date Change: -7.9% | |
| DGX Links: Profile News Message Board | |
| Charts:- Daily , Weekly | |
| Add DGX to Watchlist: View: Get DGX Trend Analysis ➞ | |
 | MRNA Moderna, Inc. |
| Sector: Health Care | |
| SubSector: Biotechnology | |
| MarketCap: 11006.4 Millions | |
| Recent Price: 103.44 Smart Investing & Trading Score: 36 | |
| Day Percent Change: -0.34% Day Change: -0.35 | |
| Week Change: -1.62% Year-to-date Change: 4.0% | |
| MRNA Links: Profile News Message Board | |
| Charts:- Daily , Weekly | |
| Add MRNA to Watchlist: View: Get MRNA Trend Analysis ➞ | |
 | STE STERIS plc |
| Sector: Health Care | |
| SubSector: Medical Instruments & Supplies | |
| MarketCap: 10875 Millions | |
| Recent Price: 200.24 Smart Investing & Trading Score: 10 | |
| Day Percent Change: 0.62% Day Change: 1.23 | |
| Week Change: -1.84% Year-to-date Change: -8.9% | |
| STE Links: Profile News Message Board | |
| Charts:- Daily , Weekly | |
| Add STE to Watchlist: View: Get STE Trend Analysis ➞ | |
 | STX Seagate Technology plc |
| Sector: Technology | |
| SubSector: Data Storage Devices | |
| MarketCap: 10814.7 Millions | |
| Recent Price: 84.20 Smart Investing & Trading Score: 17 | |
| Day Percent Change: 0.62% Day Change: 0.52 | |
| Week Change: -1.16% Year-to-date Change: -1.4% | |
| STX Links: Profile News Message Board | |
| Charts:- Daily , Weekly | |
| Add STX to Watchlist: View: Get STX Trend Analysis ➞ | |
 | OKE ONEOK, Inc. |
| Sector: Utilities | |
| SubSector: Gas Utilities | |
| MarketCap: 10788.7 Millions | |
| Recent Price: 77.68 Smart Investing & Trading Score: 46 | |
| Day Percent Change: 0.78% Day Change: 0.60 | |
| Week Change: -1.3% Year-to-date Change: 10.6% | |
| OKE Links: Profile News Message Board | |
| Charts:- Daily , Weekly | |
| Add OKE to Watchlist: View: Get OKE Trend Analysis ➞ | |
 | TYL Tyler Technologies, Inc. |
| Sector: Technology | |
| SubSector: Technical & System Software | |
| MarketCap: 10785 Millions | |
| Recent Price: 402.84 Smart Investing & Trading Score: 17 | |
| Day Percent Change: 0.91% Day Change: 3.62 | |
| Week Change: -2.54% Year-to-date Change: -3.7% | |
| TYL Links: Profile News Message Board | |
| Charts:- Daily , Weekly | |
| Add TYL to Watchlist: View: Get TYL Trend Analysis ➞ | |
 | L Loews Corporation |
| Sector: Financials | |
| SubSector: Property & Casualty Insurance | |
| MarketCap: 10768.2 Millions | |
| Recent Price: 73.14 Smart Investing & Trading Score: 23 | |
| Day Percent Change: -0.25% Day Change: -0.18 | |
| Week Change: -1.03% Year-to-date Change: 5.1% | |
| L Links: Profile News Message Board | |
| Charts:- Daily , Weekly | |
| Add L to Watchlist: View: Get L Trend Analysis ➞ | |
 | DOV Dover Corporation |
| Sector: Industrials | |
| SubSector: Diversified Machinery | |
| MarketCap: 10725.6 Millions | |
| Recent Price: 169.50 Smart Investing & Trading Score: 43 | |
| Day Percent Change: -0.97% Day Change: -1.66 | |
| Week Change: -1.49% Year-to-date Change: 10.2% | |
| DOV Links: Profile News Message Board | |
| Charts:- Daily , Weekly | |
| Add DOV to Watchlist: View: Get DOV Trend Analysis ➞ | |
 | WDC Western Digital Corporation |
| Sector: Technology | |
| SubSector: Data Storage Devices | |
| MarketCap: 10712.9 Millions | |
| Recent Price: 70.17 Smart Investing & Trading Score: 58 | |
| Day Percent Change: -1.25% Day Change: -0.89 | |
| Week Change: -2.62% Year-to-date Change: 34.0% | |
| WDC Links: Profile News Message Board | |
| Charts:- Daily , Weekly | |
| Add WDC to Watchlist: View: Get WDC Trend Analysis ➞ | |
 | JKHY Jack Henry & Associates, Inc. |
| Sector: Technology | |
| SubSector: Information Technology Services | |
| MarketCap: 10695.4 Millions | |
| Recent Price: 164.67 Smart Investing & Trading Score: 23 | |
| Day Percent Change: 0.56% Day Change: 0.92 | |
| Week Change: -1.73% Year-to-date Change: 0.8% | |
| JKHY Links: Profile News Message Board | |
| Charts:- Daily , Weekly | |
| Add JKHY to Watchlist: View: Get JKHY Trend Analysis ➞ | |
 | LNT Alliant Energy Corporation |
| Sector: Utilities | |
| SubSector: Electric Utilities | |
| MarketCap: 10678.4 Millions | |
| Recent Price: 48.42 Smart Investing & Trading Score: 55 | |
| Day Percent Change: 2.15% Day Change: 1.02 | |
| Week Change: 0.88% Year-to-date Change: -5.6% | |
| LNT Links: Profile News Message Board | |
| Charts:- Daily , Weekly | |
| Add LNT to Watchlist: View: Get LNT Trend Analysis ➞ | |
 | BIO Bio-Rad Laboratories, Inc. |
| Sector: Health Care | |
| SubSector: Medical Laboratories & Research | |
| MarketCap: 10660 Millions | |
| Recent Price: 290.86 Smart Investing & Trading Score: 20 | |
| Day Percent Change: -0.65% Day Change: -1.89 | |
| Week Change: -3.19% Year-to-date Change: -9.9% | |
| BIO Links: Profile News Message Board | |
| Charts:- Daily , Weekly | |
| Add BIO to Watchlist: View: Get BIO Trend Analysis ➞ | |
 | BR Broadridge Financial Solutions, Inc. |
| Sector: Technology | |
| SubSector: Information Technology Services | |
| MarketCap: 10633.8 Millions | |
| Recent Price: 193.45 Smart Investing & Trading Score: 0 | |
| Day Percent Change: -0.08% Day Change: -0.16 | |
| Week Change: -2.71% Year-to-date Change: -6.0% | |
| BR Links: Profile News Message Board | |
| Charts:- Daily , Weekly | |
| Add BR to Watchlist: View: Get BR Trend Analysis ➞ | |
 | MLM Martin Marietta Materials, Inc. |
| Sector: Industrials | |
| SubSector: General Building Materials | |
| MarketCap: 10624.3 Millions | |
| Recent Price: 592.92 Smart Investing & Trading Score: 38 | |
| Day Percent Change: -0.39% Day Change: -2.32 | |
| Week Change: -1.53% Year-to-date Change: 18.8% | |
| MLM Links: Profile News Message Board | |
| Charts:- Daily , Weekly | |
| Add MLM to Watchlist: View: Get MLM Trend Analysis ➞ | |
 | BRO Brown & Brown, Inc. |
| Sector: Financials | |
| SubSector: Insurance Brokers | |
| MarketCap: 10475.7 Millions | |
| Recent Price: 80.62 Smart Investing & Trading Score: 36 | |
| Day Percent Change: -0.37% Day Change: -0.30 | |
| Week Change: -1.56% Year-to-date Change: 13.4% | |
| BRO Links: Profile News Message Board | |
| Charts:- Daily , Weekly | |
| Add BRO to Watchlist: View: Get BRO Trend Analysis ➞ | |
 | HES Hess Corporation |
| Sector: Energy | |
| SubSector: Independent Oil & Gas | |
| MarketCap: 10465.3 Millions | |
| Recent Price: 150.80 Smart Investing & Trading Score: 43 | |
| Day Percent Change: 0.36% Day Change: 0.54 | |
| Week Change: -1.57% Year-to-date Change: 4.6% | |
| HES Links: Profile News Message Board | |
| Charts:- Daily , Weekly | |
| Add HES to Watchlist: View: Get HES Trend Analysis ➞ | |
 | NUE Nucor Corporation |
| Sector: Materials | |
| SubSector: Steel & Iron | |
| MarketCap: 10281.8 Millions | |
| Recent Price: 192.78 Smart Investing & Trading Score: 38 | |
| Day Percent Change: 0.35% Day Change: 0.67 | |
| Week Change: -0.9% Year-to-date Change: 10.8% | |
| NUE Links: Profile News Message Board | |
| Charts:- Daily , Weekly | |
| Add NUE to Watchlist: View: Get NUE Trend Analysis ➞ | |
 | FITB Fifth Third Bancorp |
| Sector: Financials | |
| SubSector: Regional - Midwest Banks | |
| MarketCap: 10197 Millions | |
| Recent Price: 34.10 Smart Investing & Trading Score: 35 | |
| Day Percent Change: 0.03% Day Change: 0.01 | |
| Week Change: -2.18% Year-to-date Change: -1.1% | |
| FITB Links: Profile News Message Board | |
| Charts:- Daily , Weekly | |
| Add FITB to Watchlist: View: Get FITB Trend Analysis ➞ | |
| For tabular summary view of above stock list: Summary View ➞ 0 - 25 , 25 - 50 , 50 - 75 , 75 - 100 , 100 - 125 , 125 - 150 , 150 - 175 , 175 - 200 , 200 - 225 , 225 - 250 , 250 - 275 , 275 - 300 , 300 - 325 , 325 - 350 , 350 - 375 , 375 - 400 , 400 - 425 , 425 - 450 , 450 - 475 , 475 - 500 | ||
| Click To Change The Sort Order: By Market Cap or Company Size Performance: Year-to-date, Week and Day | |
| Select Chart Type: | ||
|
Best Stocks Today 12Stocks.com |
© 2024 12Stocks.com Terms & Conditions Privacy Contact Us
All Information Provided Only For Education And Not To Be Used For Investing or Trading. See Terms & Conditions


One More Thing ... Get Best Stocks Delivered Daily!
Never Ever Miss A Move With Our Top Ten Stocks Lists
Find Best Stocks In Any Market - Bull or Bear Market
Take A Peek At Our Top Ten Stocks Lists: Daily, Weekly, Year-to-Date & Top Trends
Find Best Stocks In Any Market - Bull or Bear Market
Take A Peek At Our Top Ten Stocks Lists: Daily, Weekly, Year-to-Date & Top Trends
S&P 500 Stocks With Best Up Trends [0-bearish to 100-bullish]: United Airlines[100], Conagra Brands[95], Bunge [93], Charles Schwab[88], Lockheed Martin[86], Progressive [83], NextEra [81], Newmont [76], Google [75], Google [75], Yum! Brands[75]
Best S&P 500 Stocks Year-to-Date:
NVIDIA [69.69%], Constellation [58.3%], NRG [42.01%], Meta Platforms[39.59%], Marathon [36.47%], Micron [36.31%], Western Digital[33.99%], Progressive [31.29%], Diamondback [29.71%], Targa Resources[29.19%], Eaton [28.8%] Best S&P 500 Stocks This Week:
United Airlines[16.6%], UnitedHealth [9.06%], Globe Life[7.01%], ProShares UltraPro[6.34%], American Airlines[5.63%], Morgan Stanley[4.51%], Southwest Airlines[4.5%], Goldman Sachs[3.7%], Charles Schwab[3.53%], General Mills[3.49%], Humana [3.48%] Best S&P 500 Stocks Daily:
United Airlines[17.45%], American Airlines[6.60%], Globe Life[5.44%], NextEra [3.39%], Consolidated Edison[3.33%], Norwegian Cruise[3.15%], Dominion [3.12%], Southern [3.00%], Delta Air[2.86%], First Solar[2.85%], Southwest Airlines[2.60%]