
 Login Sign Up


| |||||
 |  | ||||

| 12Stocks.com Market Intelligence |
Best S&P 500 Stocks
|
On this page, you will find the most comprehensive analysis of S&P 500 stocks and ETFs - from latest trends to performances to charts ➞. First, here are the year-to-date (YTD) performances of the most requested S&P 500 stocks at 12Stocks.com (click stock for review):
| NVIDIA 72% | ||
| Caterpillar 23% | ||
| Amazon.com 20% | ||
| Merck 15% | ||
| Walmart 13% | ||
| Google 12% | ||
| Microsoft 9% | ||
| JPMorgan Chase 8% | ||
| Chevron 6% | ||
| Goldman Sachs 5% | ||
| Johnson & Johnson -7% | ||
| McDonald s -9% | ||
| Starbucks -10% | ||
| Apple -13% | ||
| Gilead -18% | ||
| Intel -29% | ||
| Boeing -34% | ||
| Quick: S&P 500 Stocks Lists: Performances & Trends, S&P 500 Stock Charts
Sort S&P 500 stocks: Daily, Weekly, Year-to-Date, Market Cap & Trends. Filter S&P 500 stocks list by sector: Show all, Tech, Finance, Energy, Staples, Retail, Industrial, Materials, Utilities and HealthCare |
| 12Stocks.com S&P 500 Stocks Performances & Trends Daily Report | |||||||||
|
| 
The overall Smart Investing & Trading Score is 44 (0-bearish to 100-bullish) which puts S&P 500 index in short term neutral trend. The Smart Investing & Trading Score from previous trading session is 26 and hence an improvement of trend. | ||||||||
Here are the Smart Investing & Trading Scores of the most requested S&P 500 stocks at 12Stocks.com (click stock name for detailed review):
|


| 12Stocks.com: Top Performing S&P 500 Index Stocks | ||||||||||||||||||||||||||||||||||||||||||||||||
 The top performing S&P 500 Index stocks year to date are
Now, more recently, over last week, the top performing S&P 500 Index stocks on the move are


|
||||||||||||||||||||||||||||||||||||||||||||||||
| 12Stocks.com: Investing in S&P 500 Index with Stocks | |
|
The following table helps investors and traders sort through current performance and trends (as measured by Smart Investing & Trading Score) of various
stocks in the S&P 500 Index. Quick View: Move mouse or cursor over stock symbol (ticker) to view short-term technical chart and over stock name to view long term chart. Click on  to add stock symbol to your watchlist and to add stock symbol to your watchlist and  to view watchlist. Click on any ticker or stock name for detailed market intelligence report for that stock. to view watchlist. Click on any ticker or stock name for detailed market intelligence report for that stock. |
12Stocks.com Performance of Stocks in S&P 500 Index
| Ticker | Stock Name | Watchlist | Category | Recent Price | Smart Investing & Trading Score | Change % | Weekly Change% |
| SWKS | Skyworks Solutions |   | Technology | 98.25 | 10 | -0.23% | -3.25% |
| ZBH | Zimmer Biomet | | Health Care | 120.42 | 0 | -0.73% | -3.26% |
| ABT | Abbott | | Health Care | 105.54 | 0 | -0.34% | -3.27% |
| DVN | Devon | | Energy | 51.67 | 51 | 0.01% | -3.27% |
| COO | Cooper | | Health Care | 90.46 | 10 | 0.67% | -3.27% |
| FANG | Diamondback | | Energy | 201.44 | 51 | 0.14% | -3.27% |
| CZR | Caesars Entertainment | | Services & Goods | 38.79 | 10 | 0.70% | -3.27% |
| BXP | Boston Properties | | Financials | 58.63 | 18 | 1.16% | -3.28% |
| EXR | Extra Space | | Financials | 136.07 | 20 | -0.02% | -3.28% |
| BIIB | Biogen | | Health Care | 191.60 | 10 | -0.29% | -3.32% |
| TRMB | Trimble | | Technology | 58.50 | 46 | 0.02% | -3.37% |
| POOL | Pool | | Consumer Staples | 367.23 | 10 | 0.85% | -3.41% |
| GILD | Gilead | | Health Care | 66.30 | 10 | -0.94% | -3.42% |
| TER | Teradyne | | Technology | 102.25 | 36 | 0.18% | -3.42% |
| PODD | Insulet | | Health Care | 169.03 | 27 | 1.67% | -3.53% |
| TAP | Molson Coors | | Consumer Staples | 63.99 | 36 | 0.71% | -3.54% |
| FSLR | First Solar | | Technology | 177.79 | 78 | -0.13% | -3.61% |
| ODFL | Old Dominion | | Transports | 213.09 | 10 | 1.08% | -3.64% |
| ENPH | Enphase | | Technology | 112.71 | 61 | 0.58% | -3.69% |
| EQIX | Equinix | | Financials | 744.64 | 25 | 1.37% | -3.77% |
| APA | Apache | | Energy | 32.45 | 46 | 0.57% | -3.78% |
| ROL | Rollins | | Services & Goods | 42.67 | 10 | -0.78% | -3.78% |
| CARR | Carrier Global | | Industrials | 54.69 | 23 | 0.81% | -3.78% |
| KEYS | Keysight Technologies | | Technology | 149.15 | 10 | -0.52% | -3.84% |
| F | Ford Motor | | Consumer Staples | 12.13 | 46 | 0.71% | -3.85% |
| For chart view version of above stock list: Chart View ➞ 0 - 25 , 25 - 50 , 50 - 75 , 75 - 100 , 100 - 125 , 125 - 150 , 150 - 175 , 175 - 200 , 200 - 225 , 225 - 250 , 250 - 275 , 275 - 300 , 300 - 325 , 325 - 350 , 350 - 375 , 375 - 400 , 400 - 425 , 425 - 450 , 450 - 475 | ||
 | Click To Change The Sort Order: By Market Cap or Company Size Performance: Year-to-date, Week and Day |  |
|
Get the most comprehensive stock market coverage daily at 12Stocks.com ➞ Best Stocks Today ➞ Best Stocks Weekly ➞ Best Stocks Year-to-Date ➞ Best Stocks Trends ➞  Best Stocks Today 12Stocks.com Best Nasdaq Stocks ➞ Best S&P 500 Stocks ➞ Best Tech Stocks ➞ Best Biotech Stocks ➞ |
| Detailed Overview of S&P 500 Stocks |
| S&P 500 Technical Overview, Leaders & Laggards, Top S&P 500 ETF Funds & Detailed S&P 500 Stocks List, Charts, Trends & More |
| S&P 500: Technical Analysis, Trends & YTD Performance | |
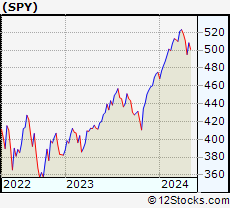
| S&P 500 index as represented by
SPY, an exchange-traded fund [ETF], holds basket of five hundred (mostly largecap) stocks from across all major sectors of the US stock market. The S&P 500 index (contains stocks like Apple and Exxon) is up by 5.9% and is currently outperforming the overall market by 0.85% year-to-date. Below is a quick view of technical charts and trends: | |
 SPY Weekly Chart |
|
| Long Term Trend: Good | |
| Medium Term Trend: Not Good | |
 SPY Daily Chart |
|
| Short Term Trend: Deteriorating | |
| Overall Trend Score: 44 | |
| YTD Performance: 5.9% | |
| **Trend Scores & Views Are Only For Educational Purposes And Not For Investing | |
| 12Stocks.com: Investing in S&P 500 Index using Exchange Traded Funds | |
|
The following table shows list of key exchange traded funds (ETF) that
help investors track S&P 500 index. The following list also includes leveraged ETF funds that track twice or thrice the daily returns of S&P 500 indices. Short or inverse ETF funds move in the opposite direction to the index they track and are useful during market pullbacks or during bear markets. Quick View: Move mouse or cursor over ETF symbol (ticker) to view short-term technical chart and over ETF name to view long term chart. Click on ticker or stock name for detailed view. Click on to add stock symbol to your watchlist and to view watchlist. |
12Stocks.com List of ETFs that track S&P 500 Index
| Ticker | ETF Name | Watchlist | Recent Price | Smart Investing & Trading Score | Change % | Week % | Year-to-date % |
| SPY | SPDR S&P 500 ETF | | 503.38 | 44 | 0.56 | -1.46 | 5.9% |
| IVV | iShares Core S&P 500 ETF | | 505.72 | 44 | 0.53 | -1.48 | 5.88% |
| VOO | Vanguard 500 ETF | | 462.63 | 44 | 0.57 | -1.48 | 5.91% |
| OEF | iShares S&P 100 | | 239.19 | 44 | 0.53 | -1.62 | 7.07% |
| SSO | ProShares Ultra S&P500 | | 71.43 | 44 | 1.09 | -3.03 | 9.77% |
| UPRO | ProShares UltraPro S&P500 | | 62.23 | 36 | 1.58 | -4.56 | 13.68% |
| SPXL | Direxion Daily S&P500 Bull 3X ETF | | 116.55 | 36 | 0.17 | -5.89 | 12.08% |
| SH | ProShares Short S&P500 | | 12.38 | 62 | -0.48 | 1.56 | -4.7% |
| SDS | ProShares UltraShort S&P500 | | 26.99 | 62 | -1.03 | 3.13 | -9.79% |
| SPXU | ProShares UltraPro Short S&P500 | | 36.49 | 69 | -1.56 | 4.68 | -15.14% |
| SPXS | Direxion Daily S&P 500 Bear 3X ETF | | 9.87 | 59 | -1.40 | 4.78 | -14.55% |
| 12Stocks.com: Charts, Trends, Fundamental Data and Performances of S&P 500 Stocks | |
|
We now take in-depth look at all S&P 500 stocks including charts, multi-period performances and overall trends (as measured by Smart Investing & Trading Score). One can sort S&P 500 stocks (click link to choose) by Daily, Weekly and by Year-to-Date performances. Also, one can sort by size of the company or by market capitalization. |
| Select Your Default Chart Type: | |||||
| |||||
| Click on stock symbol or name for detailed view. Click on to add stock symbol to your watchlist and to view watchlist. Quick View: Move mouse or cursor over "Daily" to quickly view daily technical stock chart and over "Weekly" to view weekly technical stock chart. | |||||

 | SWKS Skyworks Solutions, Inc. |
| Sector: Technology | |
| SubSector: Semiconductor - Integrated Circuits | |
| MarketCap: 13981 Millions | |
| Recent Price: 98.25 Smart Investing & Trading Score: 10 | |
| Day Percent Change: -0.23% Day Change: -0.22 | |
| Week Change: -3.25% Year-to-date Change: -12.6% | |
| SWKS Links: Profile News Message Board | |
| Charts:- Daily , Weekly | |
| Add SWKS to Watchlist: View: Get SWKS Trend Analysis ➞ | |
 | ZBH Zimmer Biomet Holdings, Inc. |
| Sector: Health Care | |
| SubSector: Medical Appliances & Equipment | |
| MarketCap: 19339.4 Millions | |
| Recent Price: 120.42 Smart Investing & Trading Score: 0 | |
| Day Percent Change: -0.73% Day Change: -0.88 | |
| Week Change: -3.26% Year-to-date Change: -1.1% | |
| ZBH Links: Profile News Message Board | |
| Charts:- Daily , Weekly | |
| Add ZBH to Watchlist: View: Get ZBH Trend Analysis ➞ | |
 | ABT Abbott Laboratories |
| Sector: Health Care | |
| SubSector: Medical Appliances & Equipment | |
| MarketCap: 125288 Millions | |
| Recent Price: 105.54 Smart Investing & Trading Score: 0 | |
| Day Percent Change: -0.34% Day Change: -0.36 | |
| Week Change: -3.27% Year-to-date Change: -4.1% | |
| ABT Links: Profile News Message Board | |
| Charts:- Daily , Weekly | |
| Add ABT to Watchlist: View: Get ABT Trend Analysis ➞ | |
 | DVN Devon Energy Corporation |
| Sector: Energy | |
| SubSector: Independent Oil & Gas | |
| MarketCap: 2693.03 Millions | |
| Recent Price: 51.67 Smart Investing & Trading Score: 51 | |
| Day Percent Change: 0.01% Day Change: 0.00 | |
| Week Change: -3.27% Year-to-date Change: 14.1% | |
| DVN Links: Profile News Message Board | |
| Charts:- Daily , Weekly | |
| Add DVN to Watchlist: View: Get DVN Trend Analysis ➞ | |
 | COO The Cooper Companies, Inc. |
| Sector: Health Care | |
| SubSector: Medical Instruments & Supplies | |
| MarketCap: 15460 Millions | |
| Recent Price: 90.46 Smart Investing & Trading Score: 10 | |
| Day Percent Change: 0.67% Day Change: 0.60 | |
| Week Change: -3.27% Year-to-date Change: -4.4% | |
| COO Links: Profile News Message Board | |
| Charts:- Daily , Weekly | |
| Add COO to Watchlist: View: Get COO Trend Analysis ➞ | |
 | FANG Diamondback Energy, Inc. |
| Sector: Energy | |
| SubSector: Independent Oil & Gas | |
| MarketCap: 3009.13 Millions | |
| Recent Price: 201.44 Smart Investing & Trading Score: 51 | |
| Day Percent Change: 0.14% Day Change: 0.29 | |
| Week Change: -3.27% Year-to-date Change: 29.9% | |
| FANG Links: Profile News Message Board | |
| Charts:- Daily , Weekly | |
| Add FANG to Watchlist: View: Get FANG Trend Analysis ➞ | |
 | CZR Caesars Entertainment Corporation |
| Sector: Services & Goods | |
| SubSector: Resorts & Casinos | |
| MarketCap: 4618.44 Millions | |
| Recent Price: 38.79 Smart Investing & Trading Score: 10 | |
| Day Percent Change: 0.70% Day Change: 0.27 | |
| Week Change: -3.27% Year-to-date Change: -17.3% | |
| CZR Links: Profile News Message Board | |
| Charts:- Daily , Weekly | |
| Add CZR to Watchlist: View: Get CZR Trend Analysis ➞ | |
 | BXP Boston Properties, Inc. |
| Sector: Financials | |
| SubSector: REIT - Office | |
| MarketCap: 13788.6 Millions | |
| Recent Price: 58.63 Smart Investing & Trading Score: 18 | |
| Day Percent Change: 1.16% Day Change: 0.67 | |
| Week Change: -3.28% Year-to-date Change: -16.5% | |
| BXP Links: Profile News Message Board | |
| Charts:- Daily , Weekly | |
| Add BXP to Watchlist: View: Get BXP Trend Analysis ➞ | |
 | EXR Extra Space Storage Inc. |
| Sector: Financials | |
| SubSector: REIT - Industrial | |
| MarketCap: 11203.9 Millions | |
| Recent Price: 136.07 Smart Investing & Trading Score: 20 | |
| Day Percent Change: -0.02% Day Change: -0.03 | |
| Week Change: -3.28% Year-to-date Change: -15.1% | |
| EXR Links: Profile News Message Board | |
| Charts:- Daily , Weekly | |
| Add EXR to Watchlist: View: Get EXR Trend Analysis ➞ | |
 | BIIB Biogen Inc. |
| Sector: Health Care | |
| SubSector: Biotechnology | |
| MarketCap: 53102.6 Millions | |
| Recent Price: 191.60 Smart Investing & Trading Score: 10 | |
| Day Percent Change: -0.29% Day Change: -0.56 | |
| Week Change: -3.32% Year-to-date Change: -26.0% | |
| BIIB Links: Profile News Message Board | |
| Charts:- Daily , Weekly | |
| Add BIIB to Watchlist: View: Get BIIB Trend Analysis ➞ | |
 | TRMB Trimble Inc. |
| Sector: Technology | |
| SubSector: Scientific & Technical Instruments | |
| MarketCap: 7990.33 Millions | |
| Recent Price: 58.50 Smart Investing & Trading Score: 46 | |
| Day Percent Change: 0.02% Day Change: 0.01 | |
| Week Change: -3.37% Year-to-date Change: 10.0% | |
| TRMB Links: Profile News Message Board | |
| Charts:- Daily , Weekly | |
| Add TRMB to Watchlist: View: Get TRMB Trend Analysis ➞ | |
 | POOL Pool Corporation |
| Sector: Consumer Staples | |
| SubSector: Sporting Goods | |
| MarketCap: 7479.64 Millions | |
| Recent Price: 367.23 Smart Investing & Trading Score: 10 | |
| Day Percent Change: 0.85% Day Change: 3.08 | |
| Week Change: -3.41% Year-to-date Change: -7.9% | |
| POOL Links: Profile News Message Board | |
| Charts:- Daily , Weekly | |
| Add POOL to Watchlist: View: Get POOL Trend Analysis ➞ | |
 | GILD Gilead Sciences, Inc. |
| Sector: Health Care | |
| SubSector: Biotechnology | |
| MarketCap: 99485.6 Millions | |
| Recent Price: 66.30 Smart Investing & Trading Score: 10 | |
| Day Percent Change: -0.94% Day Change: -0.63 | |
| Week Change: -3.42% Year-to-date Change: -18.2% | |
| GILD Links: Profile News Message Board | |
| Charts:- Daily , Weekly | |
| Add GILD to Watchlist: View: Get GILD Trend Analysis ➞ | |
 | TER Teradyne, Inc. |
| Sector: Technology | |
| SubSector: Semiconductor Equipment & Materials | |
| MarketCap: 8135.68 Millions | |
| Recent Price: 102.25 Smart Investing & Trading Score: 36 | |
| Day Percent Change: 0.18% Day Change: 0.18 | |
| Week Change: -3.42% Year-to-date Change: -5.8% | |
| TER Links: Profile News Message Board | |
| Charts:- Daily , Weekly | |
| Add TER to Watchlist: View: Get TER Trend Analysis ➞ | |
 | PODD Insulet Corporation |
| Sector: Health Care | |
| SubSector: Medical Instruments & Supplies | |
| MarketCap: 9313.2 Millions | |
| Recent Price: 169.03 Smart Investing & Trading Score: 27 | |
| Day Percent Change: 1.67% Day Change: 2.77 | |
| Week Change: -3.53% Year-to-date Change: -22.1% | |
| PODD Links: Profile News Message Board | |
| Charts:- Daily , Weekly | |
| Add PODD to Watchlist: View: Get PODD Trend Analysis ➞ | |
 | TAP Molson Coors Beverage Company |
| Sector: Consumer Staples | |
| SubSector: Beverages - Brewers | |
| MarketCap: 8619.97 Millions | |
| Recent Price: 63.99 Smart Investing & Trading Score: 36 | |
| Day Percent Change: 0.71% Day Change: 0.45 | |
| Week Change: -3.54% Year-to-date Change: 4.5% | |
| TAP Links: Profile News Message Board | |
| Charts:- Daily , Weekly | |
| Add TAP to Watchlist: View: Get TAP Trend Analysis ➞ | |
 | FSLR First Solar, Inc. |
| Sector: Technology | |
| SubSector: Semiconductor - Specialized | |
| MarketCap: 3617.9 Millions | |
| Recent Price: 177.79 Smart Investing & Trading Score: 78 | |
| Day Percent Change: -0.13% Day Change: -0.22 | |
| Week Change: -3.61% Year-to-date Change: 3.2% | |
| FSLR Links: Profile News Message Board | |
| Charts:- Daily , Weekly | |
| Add FSLR to Watchlist: View: Get FSLR Trend Analysis ➞ | |
 | ODFL Old Dominion Freight Line, Inc. |
| Sector: Transports | |
| SubSector: Trucking | |
| MarketCap: 14457.5 Millions | |
| Recent Price: 213.09 Smart Investing & Trading Score: 10 | |
| Day Percent Change: 1.08% Day Change: 2.28 | |
| Week Change: -3.64% Year-to-date Change: -47.4% | |
| ODFL Links: Profile News Message Board | |
| Charts:- Daily , Weekly | |
| Add ODFL to Watchlist: View: Get ODFL Trend Analysis ➞ | |
 | ENPH Enphase Energy, Inc. |
| Sector: Technology | |
| SubSector: Semiconductor Equipment & Materials | |
| MarketCap: 4047.48 Millions | |
| Recent Price: 112.71 Smart Investing & Trading Score: 61 | |
| Day Percent Change: 0.58% Day Change: 0.66 | |
| Week Change: -3.69% Year-to-date Change: -14.7% | |
| ENPH Links: Profile News Message Board | |
| Charts:- Daily , Weekly | |
| Add ENPH to Watchlist: View: Get ENPH Trend Analysis ➞ | |
 | EQIX Equinix, Inc. (REIT) |
| Sector: Financials | |
| SubSector: REIT - Diversified | |
| MarketCap: 45855.3 Millions | |
| Recent Price: 744.64 Smart Investing & Trading Score: 25 | |
| Day Percent Change: 1.37% Day Change: 10.08 | |
| Week Change: -3.77% Year-to-date Change: -7.5% | |
| EQIX Links: Profile News Message Board | |
| Charts:- Daily , Weekly | |
| Add EQIX to Watchlist: View: Get EQIX Trend Analysis ➞ | |
 | APA Apache Corporation |
| Sector: Energy | |
| SubSector: Independent Oil & Gas | |
| MarketCap: 1937.53 Millions | |
| Recent Price: 32.45 Smart Investing & Trading Score: 46 | |
| Day Percent Change: 0.57% Day Change: 0.19 | |
| Week Change: -3.78% Year-to-date Change: -9.6% | |
| APA Links: Profile News Message Board | |
| Charts:- Daily , Weekly | |
| Add APA to Watchlist: View: Get APA Trend Analysis ➞ | |
 | ROL Rollins, Inc. |
| Sector: Services & Goods | |
| SubSector: Business Services | |
| MarketCap: 12827.4 Millions | |
| Recent Price: 42.67 Smart Investing & Trading Score: 10 | |
| Day Percent Change: -0.78% Day Change: -0.34 | |
| Week Change: -3.78% Year-to-date Change: -2.3% | |
| ROL Links: Profile News Message Board | |
| Charts:- Daily , Weekly | |
| Add ROL to Watchlist: View: Get ROL Trend Analysis ➞ | |
 | CARR Carrier Global Corporation |
| Sector: Industrials | |
| SubSector: Building Products & Equipment | |
| MarketCap: 32547 Millions | |
| Recent Price: 54.69 Smart Investing & Trading Score: 23 | |
| Day Percent Change: 0.81% Day Change: 0.44 | |
| Week Change: -3.78% Year-to-date Change: -4.8% | |
| CARR Links: Profile News Message Board | |
| Charts:- Daily , Weekly | |
| Add CARR to Watchlist: View: Get CARR Trend Analysis ➞ | |
 | KEYS Keysight Technologies, Inc. |
| Sector: Technology | |
| SubSector: Scientific & Technical Instruments | |
| MarketCap: 17355.1 Millions | |
| Recent Price: 149.15 Smart Investing & Trading Score: 10 | |
| Day Percent Change: -0.52% Day Change: -0.78 | |
| Week Change: -3.84% Year-to-date Change: -6.3% | |
| KEYS Links: Profile News Message Board | |
| Charts:- Daily , Weekly | |
| Add KEYS to Watchlist: View: Get KEYS Trend Analysis ➞ | |
 | F Ford Motor Company |
| Sector: Consumer Staples | |
| SubSector: Auto Manufacturers - Major | |
| MarketCap: 19052.1 Millions | |
| Recent Price: 12.13 Smart Investing & Trading Score: 46 | |
| Day Percent Change: 0.71% Day Change: 0.09 | |
| Week Change: -3.85% Year-to-date Change: -0.5% | |
| F Links: Profile News Message Board | |
| Charts:- Daily , Weekly | |
| Add F to Watchlist: View: Get F Trend Analysis ➞ | |
| For tabular summary view of above stock list: Summary View ➞ 0 - 25 , 25 - 50 , 50 - 75 , 75 - 100 , 100 - 125 , 125 - 150 , 150 - 175 , 175 - 200 , 200 - 225 , 225 - 250 , 250 - 275 , 275 - 300 , 300 - 325 , 325 - 350 , 350 - 375 , 375 - 400 , 400 - 425 , 425 - 450 , 450 - 475 | ||
| Click To Change The Sort Order: By Market Cap or Company Size Performance: Year-to-date, Week and Day | |
| Select Chart Type: | ||
|
Best Stocks Today 12Stocks.com |
© 2024 12Stocks.com Terms & Conditions Privacy Contact Us
All Information Provided Only For Education And Not To Be Used For Investing or Trading. See Terms & Conditions


One More Thing ... Get Best Stocks Delivered Daily!
Never Ever Miss A Move With Our Top Ten Stocks Lists
Find Best Stocks In Any Market - Bull or Bear Market
Take A Peek At Our Top Ten Stocks Lists: Daily, Weekly, Year-to-Date & Top Trends
Find Best Stocks In Any Market - Bull or Bear Market
Take A Peek At Our Top Ten Stocks Lists: Daily, Weekly, Year-to-Date & Top Trends
S&P 500 Stocks With Best Up Trends [0-bearish to 100-bullish]: Genuine Parts[100], United Airlines[100], Generac Holdings[93], Delta Air[93], Charles Schwab[93], Bunge [93], Lockheed Martin[93], Wells Fargo[90], Google [90], Google [90], Freeport-McMoRan [88]
Best S&P 500 Stocks Year-to-Date:
NVIDIA [72.44%], Constellation [59.78%], Meta Platforms[44.17%], NRG [40.48%], Micron [35.16%], Western Digital[34.81%], Marathon [33.15%], Progressive [31.69%], Eaton [30.68%], Diamondback [29.89%], Targa Resources[29.2%] Best S&P 500 Stocks This Week:
United Airlines[21.81%], UnitedHealth [13.06%], Genuine Parts[10.85%], American Airlines[7.91%], Southwest Airlines[6.57%], Morgan Stanley[5.34%], Charles Schwab[4.84%], Norwegian Cruise[4.7%], ProShares UltraPro[4.68%], Centene [4.64%], Humana [4.57%] Best S&P 500 Stocks Daily:
Genuine Parts[11.86%], United Airlines[4.46%], Capital One[4.24%], Discover Financial[3.95%], Fair Isaac[3.70%], UnitedHealth [3.67%], Marsh & McLennan[3.63%], Allstate [3.62%], Builders FirstSource[3.39%], Synchrony Financial[3.35%], D.R. Horton[3.31%]