
 Login Sign Up


| |||||
 |  | ||||

| 12Stocks.com Market Intelligence |
Best S&P 500 Stocks
|
On this page, you will find the most comprehensive analysis of S&P 500 stocks and ETFs - from latest trends to performances to charts ➞. First, here are the year-to-date (YTD) performances of the most requested S&P 500 stocks at 12Stocks.com (click stock for review):
| NVIDIA 54% | ||
| Caterpillar 20% | ||
| Merck 15% | ||
| Amazon.com 15% | ||
| Walmart 13% | ||
| Google 10% | ||
| JPMorgan Chase 9% | ||
| Chevron 7% | ||
| Microsoft 6% | ||
| Goldman Sachs 5% | ||
| Johnson & Johnson -6% | ||
| McDonald s -8% | ||
| Starbucks -9% | ||
| Apple -14% | ||
| Gilead -18% | ||
| Intel -32% | ||
| Boeing -35% | ||
| Quick: S&P 500 Stocks Lists: Performances & Trends, S&P 500 Stock Charts
Sort S&P 500 stocks: Daily, Weekly, Year-to-Date, Market Cap & Trends. Filter S&P 500 stocks list by sector: Show all, Tech, Finance, Energy, Staples, Retail, Industrial, Materials, Utilities and HealthCare |
| 12Stocks.com S&P 500 Stocks Performances & Trends Daily Report | |||||||||
|
| 
The overall Smart Investing & Trading Score is 26 (0-bearish to 100-bullish) which puts S&P 500 index in short term bearish to neutral trend. The Smart Investing & Trading Score from previous trading session is 36 and hence a deterioration of trend. | ||||||||
Here are the Smart Investing & Trading Scores of the most requested S&P 500 stocks at 12Stocks.com (click stock name for detailed review):
|


| 12Stocks.com: Top Performing S&P 500 Index Stocks | ||||||||||||||||||||||||||||||||||||||||||||||||
 The top performing S&P 500 Index stocks year to date are
Now, more recently, over last week, the top performing S&P 500 Index stocks on the move are


|
||||||||||||||||||||||||||||||||||||||||||||||||
| 12Stocks.com: Investing in S&P 500 Index with Stocks | |
|
The following table helps investors and traders sort through current performance and trends (as measured by Smart Investing & Trading Score) of various
stocks in the S&P 500 Index. Quick View: Move mouse or cursor over stock symbol (ticker) to view short-term technical chart and over stock name to view long term chart. Click on  to add stock symbol to your watchlist and to add stock symbol to your watchlist and  to view watchlist. Click on any ticker or stock name for detailed market intelligence report for that stock. to view watchlist. Click on any ticker or stock name for detailed market intelligence report for that stock. |
12Stocks.com Performance of Stocks in S&P 500 Index
| Ticker | Stock Name | Watchlist | Category | Recent Price | Smart Investing & Trading Score | Change % | Weekly Change% |
| TRGP | Targa Resources |   | Energy | 112.91 | 76 | 1.01% | -1.55% |
| CCI | Crown Castle | | Technology | 95.20 | 32 | 0.88% | -1.56% |
| MTCH | Match | | Technology | 32.17 | 37 | -0.16% | -1.56% |
| EMN | Eastman Chemical | | Materials | 96.44 | 61 | 0.44% | -1.57% |
| ECL | Ecolab | | Materials | 218.16 | 36 | -0.48% | -1.59% |
| MAA | Mid-America Apartment | | Financials | 126.08 | 55 | 1.17% | -1.60% |
| EQT | EQT | | Energy | 36.65 | 54 | 1.19% | -1.61% |
| JNPR | Juniper Networks | | Technology | 36.06 | 5 | -0.28% | -1.61% |
| NUE | Nucor | | Materials | 191.36 | 26 | 0.31% | -1.63% |
| GM | General Motors | | Consumer Staples | 42.37 | 53 | -0.16% | -1.65% |
| ABT | Abbott | | Health Care | 107.29 | 17 | 1.92% | -1.67% |
| CCL | Carnival | | Services & Goods | 14.12 | 25 | -0.42% | -1.67% |
| CPT | Camden Property | | Financials | 96.28 | 68 | 1.04% | -1.69% |
| TEL | TE Connectivity | | Technology | 140.55 | 0 | 0.05% | -1.70% |
| ESS | Essex Property | | Financials | 235.17 | 68 | 0.51% | -1.72% |
| ALLE | Allegion | | Services & Goods | 125.22 | 23 | 0.31% | -1.72% |
| ICE | Intercontinental Exchange | | Financials | 131.21 | 51 | 0.18% | -1.75% |
| BLK | BlackRock | | Financials | 749.98 | 18 | 0.36% | -1.76% |
| DOW | Dow | | Materials | 56.66 | 54 | 0.30% | -1.79% |
| EBAY | eBay | | Services & Goods | 50.38 | 61 | 0.86% | -1.81% |
| NSC | Norfolk Southern | | Transports | 241.28 | 48 | 0.42% | -1.81% |
| DHR | Danaher | | Industrials | 235.51 | 0 | -0.36% | -1.85% |
| ZION | Zions Ban | | Financials | 39.91 | 28 | 1.71% | -1.87% |
| NDAQ | Nasdaq | | Financials | 60.35 | 54 | 0.47% | -1.90% |
| BIIB | Biogen | | Health Care | 194.39 | 17 | 2.03% | -1.91% |
| For chart view version of above stock list: Chart View ➞ 0 - 25 , 25 - 50 , 50 - 75 , 75 - 100 , 100 - 125 , 125 - 150 , 150 - 175 , 175 - 200 , 200 - 225 , 225 - 250 , 250 - 275 , 275 - 300 , 300 - 325 , 325 - 350 , 350 - 375 , 375 - 400 , 400 - 425 , 425 - 450 , 450 - 475 , 475 - 500 | ||
 | Click To Change The Sort Order: By Market Cap or Company Size Performance: Year-to-date, Week and Day |  |
|
Get the most comprehensive stock market coverage daily at 12Stocks.com ➞ Best Stocks Today ➞ Best Stocks Weekly ➞ Best Stocks Year-to-Date ➞ Best Stocks Trends ➞  Best Stocks Today 12Stocks.com Best Nasdaq Stocks ➞ Best S&P 500 Stocks ➞ Best Tech Stocks ➞ Best Biotech Stocks ➞ |
| Detailed Overview of S&P 500 Stocks |
| S&P 500 Technical Overview, Leaders & Laggards, Top S&P 500 ETF Funds & Detailed S&P 500 Stocks List, Charts, Trends & More |
| S&P 500: Technical Analysis, Trends & YTD Performance | |
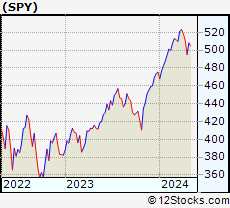
| S&P 500 index as represented by
SPY, an exchange-traded fund [ETF], holds basket of five hundred (mostly largecap) stocks from across all major sectors of the US stock market. The S&P 500 index (contains stocks like Apple and Exxon) is up by 4.18% and is currently outperforming the overall market by 0.79% year-to-date. Below is a quick view of technical charts and trends: | |
 SPY Weekly Chart |
|
| Long Term Trend: Good | |
| Medium Term Trend: Not Good | |
 SPY Daily Chart |
|
| Short Term Trend: Not Good | |
| Overall Trend Score: 26 | |
| YTD Performance: 4.18% | |
| **Trend Scores & Views Are Only For Educational Purposes And Not For Investing | |
| 12Stocks.com: Investing in S&P 500 Index using Exchange Traded Funds | |
|
The following table shows list of key exchange traded funds (ETF) that
help investors track S&P 500 index. The following list also includes leveraged ETF funds that track twice or thrice the daily returns of S&P 500 indices. Short or inverse ETF funds move in the opposite direction to the index they track and are useful during market pullbacks or during bear markets. Quick View: Move mouse or cursor over ETF symbol (ticker) to view short-term technical chart and over ETF name to view long term chart. Click on ticker or stock name for detailed view. Click on to add stock symbol to your watchlist and to view watchlist. |
12Stocks.com List of ETFs that track S&P 500 Index
| Ticker | ETF Name | Watchlist | Recent Price | Smart Investing & Trading Score | Change % | Week % | Year-to-date % |
| SPY | SPDR S&P 500 ETF | | 495.16 | 26 | -0.87 | -3.07 | 4.18% |
| IVV | iShares Core S&P 500 ETF | | 497.53 | 36 | -0.87 | -3.07 | 4.17% |
| VOO | Vanguard 500 ETF | | 455.10 | 36 | -0.84 | -3.08 | 4.19% |
| OEF | iShares S&P 100 | | 234.49 | 26 | -1.32 | -3.56 | 4.97% |
| SSO | ProShares Ultra S&P500 | | 69.13 | 26 | -1.71 | -6.15 | 6.23% |
| UPRO | ProShares UltraPro S&P500 | | 59.16 | 26 | -2.67 | -9.26 | 8.07% |
| SPXL | Direxion Daily S&P500 Bull 3X ETF | | 112.55 | 36 | -2.58 | -9.12 | 8.23% |
| SH | ProShares Short S&P500 | | 12.59 | 74 | 0.96 | 3.28 | -3.08% |
| SDS | ProShares UltraShort S&P500 | | 27.91 | 74 | 1.82 | 6.65 | -6.72% |
| SPXU | ProShares UltraPro Short S&P500 | | 38.33 | 74 | 2.68 | 9.95 | -10.86% |
| SPXS | Direxion Daily S&P 500 Bear 3X ETF | | 10.37 | 49 | 2.57 | 10.08 | -10.22% |
| 12Stocks.com: Charts, Trends, Fundamental Data and Performances of S&P 500 Stocks | |
|
We now take in-depth look at all S&P 500 stocks including charts, multi-period performances and overall trends (as measured by Smart Investing & Trading Score). One can sort S&P 500 stocks (click link to choose) by Daily, Weekly and by Year-to-Date performances. Also, one can sort by size of the company or by market capitalization. |
| Select Your Default Chart Type: | |||||
| |||||
| Click on stock symbol or name for detailed view. Click on to add stock symbol to your watchlist and to view watchlist. Quick View: Move mouse or cursor over "Daily" to quickly view daily technical stock chart and over "Weekly" to view weekly technical stock chart. | |||||

 | TRGP Targa Resources Corp. |
| Sector: Energy | |
| SubSector: Oil & Gas Pipelines | |
| MarketCap: 2210.65 Millions | |
| Recent Price: 112.91 Smart Investing & Trading Score: 76 | |
| Day Percent Change: 1.01% Day Change: 1.13 | |
| Week Change: -1.55% Year-to-date Change: 30.0% | |
| TRGP Links: Profile News Message Board | |
| Charts:- Daily , Weekly | |
| Add TRGP to Watchlist: View: Get TRGP Trend Analysis ➞ | |
 | CCI Crown Castle International Corp. (REIT) |
| Sector: Technology | |
| SubSector: Diversified Communication Services | |
| MarketCap: 57615.4 Millions | |
| Recent Price: 95.20 Smart Investing & Trading Score: 32 | |
| Day Percent Change: 0.88% Day Change: 0.83 | |
| Week Change: -1.56% Year-to-date Change: -17.4% | |
| CCI Links: Profile News Message Board | |
| Charts:- Daily , Weekly | |
| Add CCI to Watchlist: View: Get CCI Trend Analysis ➞ | |
 | MTCH Match Group, Inc. |
| Sector: Technology | |
| SubSector: Internet Information Providers | |
| MarketCap: 14655.8 Millions | |
| Recent Price: 32.17 Smart Investing & Trading Score: 37 | |
| Day Percent Change: -0.16% Day Change: -0.05 | |
| Week Change: -1.56% Year-to-date Change: -11.9% | |
| MTCH Links: Profile News Message Board | |
| Charts:- Daily , Weekly | |
| Add MTCH to Watchlist: View: Get MTCH Trend Analysis ➞ | |
 | EMN Eastman Chemical Company |
| Sector: Materials | |
| SubSector: Chemicals - Major Diversified | |
| MarketCap: 6217.06 Millions | |
| Recent Price: 96.44 Smart Investing & Trading Score: 61 | |
| Day Percent Change: 0.44% Day Change: 0.42 | |
| Week Change: -1.57% Year-to-date Change: 7.4% | |
| EMN Links: Profile News Message Board | |
| Charts:- Daily , Weekly | |
| Add EMN to Watchlist: View: Get EMN Trend Analysis ➞ | |
 | ECL Ecolab Inc. |
| Sector: Materials | |
| SubSector: Specialty Chemicals | |
| MarketCap: 46215.9 Millions | |
| Recent Price: 218.16 Smart Investing & Trading Score: 36 | |
| Day Percent Change: -0.48% Day Change: -1.05 | |
| Week Change: -1.59% Year-to-date Change: 10.0% | |
| ECL Links: Profile News Message Board | |
| Charts:- Daily , Weekly | |
| Add ECL to Watchlist: View: Get ECL Trend Analysis ➞ | |
 | MAA Mid-America Apartment Communities, Inc. |
| Sector: Financials | |
| SubSector: REIT - Residential | |
| MarketCap: 11385.5 Millions | |
| Recent Price: 126.08 Smart Investing & Trading Score: 55 | |
| Day Percent Change: 1.17% Day Change: 1.46 | |
| Week Change: -1.6% Year-to-date Change: -6.2% | |
| MAA Links: Profile News Message Board | |
| Charts:- Daily , Weekly | |
| Add MAA to Watchlist: View: Get MAA Trend Analysis ➞ | |
 | EQT EQT Corporation |
| Sector: Energy | |
| SubSector: Independent Oil & Gas | |
| MarketCap: 1886.63 Millions | |
| Recent Price: 36.65 Smart Investing & Trading Score: 54 | |
| Day Percent Change: 1.19% Day Change: 0.43 | |
| Week Change: -1.61% Year-to-date Change: -5.2% | |
| EQT Links: Profile News Message Board | |
| Charts:- Daily , Weekly | |
| Add EQT to Watchlist: View: Get EQT Trend Analysis ➞ | |
 | JNPR Juniper Networks, Inc. |
| Sector: Technology | |
| SubSector: Communication Equipment | |
| MarketCap: 6161.49 Millions | |
| Recent Price: 36.06 Smart Investing & Trading Score: 5 | |
| Day Percent Change: -0.28% Day Change: -0.10 | |
| Week Change: -1.61% Year-to-date Change: 22.3% | |
| JNPR Links: Profile News Message Board | |
| Charts:- Daily , Weekly | |
| Add JNPR to Watchlist: View: Get JNPR Trend Analysis ➞ | |
 | NUE Nucor Corporation |
| Sector: Materials | |
| SubSector: Steel & Iron | |
| MarketCap: 10281.8 Millions | |
| Recent Price: 191.36 Smart Investing & Trading Score: 26 | |
| Day Percent Change: 0.31% Day Change: 0.59 | |
| Week Change: -1.63% Year-to-date Change: 10.0% | |
| NUE Links: Profile News Message Board | |
| Charts:- Daily , Weekly | |
| Add NUE to Watchlist: View: Get NUE Trend Analysis ➞ | |
 | GM General Motors Company |
| Sector: Consumer Staples | |
| SubSector: Auto Manufacturers - Major | |
| MarketCap: 29252.4 Millions | |
| Recent Price: 42.37 Smart Investing & Trading Score: 53 | |
| Day Percent Change: -0.16% Day Change: -0.07 | |
| Week Change: -1.65% Year-to-date Change: 18.0% | |
| GM Links: Profile News Message Board | |
| Charts:- Daily , Weekly | |
| Add GM to Watchlist: View: Get GM Trend Analysis ➞ | |
 | ABT Abbott Laboratories |
| Sector: Health Care | |
| SubSector: Medical Appliances & Equipment | |
| MarketCap: 125288 Millions | |
| Recent Price: 107.29 Smart Investing & Trading Score: 17 | |
| Day Percent Change: 1.92% Day Change: 2.02 | |
| Week Change: -1.67% Year-to-date Change: -2.5% | |
| ABT Links: Profile News Message Board | |
| Charts:- Daily , Weekly | |
| Add ABT to Watchlist: View: Get ABT Trend Analysis ➞ | |
 | CCL Carnival Corporation & Plc |
| Sector: Services & Goods | |
| SubSector: Resorts & Casinos | |
| MarketCap: 11725.4 Millions | |
| Recent Price: 14.12 Smart Investing & Trading Score: 25 | |
| Day Percent Change: -0.42% Day Change: -0.06 | |
| Week Change: -1.67% Year-to-date Change: -23.8% | |
| CCL Links: Profile News Message Board | |
| Charts:- Daily , Weekly | |
| Add CCL to Watchlist: View: Get CCL Trend Analysis ➞ | |
 | CPT Camden Property Trust |
| Sector: Financials | |
| SubSector: REIT - Residential | |
| MarketCap: 7535.21 Millions | |
| Recent Price: 96.28 Smart Investing & Trading Score: 68 | |
| Day Percent Change: 1.04% Day Change: 0.99 | |
| Week Change: -1.69% Year-to-date Change: -3.0% | |
| CPT Links: Profile News Message Board | |
| Charts:- Daily , Weekly | |
| Add CPT to Watchlist: View: Get CPT Trend Analysis ➞ | |
 | TEL TE Connectivity Ltd. |
| Sector: Technology | |
| SubSector: Diversified Electronics | |
| MarketCap: 20044.9 Millions | |
| Recent Price: 140.55 Smart Investing & Trading Score: 0 | |
| Day Percent Change: 0.05% Day Change: 0.07 | |
| Week Change: -1.7% Year-to-date Change: 0.0% | |
| TEL Links: Profile News Message Board | |
| Charts:- Daily , Weekly | |
| Add TEL to Watchlist: View: Get TEL Trend Analysis ➞ | |
 | ESS Essex Property Trust, Inc. |
| Sector: Financials | |
| SubSector: REIT - Residential | |
| MarketCap: 13725.5 Millions | |
| Recent Price: 235.17 Smart Investing & Trading Score: 68 | |
| Day Percent Change: 0.51% Day Change: 1.20 | |
| Week Change: -1.72% Year-to-date Change: -5.2% | |
| ESS Links: Profile News Message Board | |
| Charts:- Daily , Weekly | |
| Add ESS to Watchlist: View: Get ESS Trend Analysis ➞ | |
 | ALLE Allegion plc |
| Sector: Services & Goods | |
| SubSector: Security & Protection Services | |
| MarketCap: 8515.93 Millions | |
| Recent Price: 125.22 Smart Investing & Trading Score: 23 | |
| Day Percent Change: 0.31% Day Change: 0.38 | |
| Week Change: -1.72% Year-to-date Change: -1.2% | |
| ALLE Links: Profile News Message Board | |
| Charts:- Daily , Weekly | |
| Add ALLE to Watchlist: View: Get ALLE Trend Analysis ➞ | |
 | ICE Intercontinental Exchange, Inc. |
| Sector: Financials | |
| SubSector: Diversified Investments | |
| MarketCap: 46054.6 Millions | |
| Recent Price: 131.21 Smart Investing & Trading Score: 51 | |
| Day Percent Change: 0.18% Day Change: 0.23 | |
| Week Change: -1.75% Year-to-date Change: 2.2% | |
| ICE Links: Profile News Message Board | |
| Charts:- Daily , Weekly | |
| Add ICE to Watchlist: View: Get ICE Trend Analysis ➞ | |
 | BLK BlackRock, Inc. |
| Sector: Financials | |
| SubSector: Asset Management | |
| MarketCap: 61284.9 Millions | |
| Recent Price: 749.98 Smart Investing & Trading Score: 18 | |
| Day Percent Change: 0.36% Day Change: 2.68 | |
| Week Change: -1.76% Year-to-date Change: -7.6% | |
| BLK Links: Profile News Message Board | |
| Charts:- Daily , Weekly | |
| Add BLK to Watchlist: View: Get BLK Trend Analysis ➞ | |
 | DOW Dow Inc. |
| Sector: Materials | |
| SubSector: Chemicals - Major Diversified | |
| MarketCap: 24098.6 Millions | |
| Recent Price: 56.66 Smart Investing & Trading Score: 54 | |
| Day Percent Change: 0.30% Day Change: 0.17 | |
| Week Change: -1.79% Year-to-date Change: 3.3% | |
| DOW Links: Profile News Message Board | |
| Charts:- Daily , Weekly | |
| Add DOW to Watchlist: View: Get DOW Trend Analysis ➞ | |
 | EBAY eBay Inc. |
| Sector: Services & Goods | |
| SubSector: Specialty Retail, Other | |
| MarketCap: 23152.3 Millions | |
| Recent Price: 50.38 Smart Investing & Trading Score: 61 | |
| Day Percent Change: 0.86% Day Change: 0.43 | |
| Week Change: -1.81% Year-to-date Change: 15.5% | |
| EBAY Links: Profile News Message Board | |
| Charts:- Daily , Weekly | |
| Add EBAY to Watchlist: View: Get EBAY Trend Analysis ➞ | |
 | NSC Norfolk Southern Corporation |
| Sector: Transports | |
| SubSector: Railroads | |
| MarketCap: 36165.4 Millions | |
| Recent Price: 241.28 Smart Investing & Trading Score: 48 | |
| Day Percent Change: 0.42% Day Change: 1.01 | |
| Week Change: -1.81% Year-to-date Change: 2.1% | |
| NSC Links: Profile News Message Board | |
| Charts:- Daily , Weekly | |
| Add NSC to Watchlist: View: Get NSC Trend Analysis ➞ | |
 | DHR Danaher Corporation |
| Sector: Industrials | |
| SubSector: Diversified Machinery | |
| MarketCap: 93210.3 Millions | |
| Recent Price: 235.51 Smart Investing & Trading Score: 0 | |
| Day Percent Change: -0.36% Day Change: -0.85 | |
| Week Change: -1.85% Year-to-date Change: 1.8% | |
| DHR Links: Profile News Message Board | |
| Charts:- Daily , Weekly | |
| Add DHR to Watchlist: View: Get DHR Trend Analysis ➞ | |
 | ZION Zions Bancorporation, National Association |
| Sector: Financials | |
| SubSector: Regional - Pacific Banks | |
| MarketCap: 4577.89 Millions | |
| Recent Price: 39.91 Smart Investing & Trading Score: 28 | |
| Day Percent Change: 1.71% Day Change: 0.67 | |
| Week Change: -1.87% Year-to-date Change: -9.0% | |
| ZION Links: Profile News Message Board | |
| Charts:- Daily , Weekly | |
| Add ZION to Watchlist: View: Get ZION Trend Analysis ➞ | |
 | NDAQ Nasdaq, Inc. |
| Sector: Financials | |
| SubSector: Diversified Investments | |
| MarketCap: 14885.2 Millions | |
| Recent Price: 60.35 Smart Investing & Trading Score: 54 | |
| Day Percent Change: 0.47% Day Change: 0.28 | |
| Week Change: -1.9% Year-to-date Change: 3.8% | |
| NDAQ Links: Profile News Message Board | |
| Charts:- Daily , Weekly | |
| Add NDAQ to Watchlist: View: Get NDAQ Trend Analysis ➞ | |
 | BIIB Biogen Inc. |
| Sector: Health Care | |
| SubSector: Biotechnology | |
| MarketCap: 53102.6 Millions | |
| Recent Price: 194.39 Smart Investing & Trading Score: 17 | |
| Day Percent Change: 2.03% Day Change: 3.87 | |
| Week Change: -1.91% Year-to-date Change: -24.9% | |
| BIIB Links: Profile News Message Board | |
| Charts:- Daily , Weekly | |
| Add BIIB to Watchlist: View: Get BIIB Trend Analysis ➞ | |
| For tabular summary view of above stock list: Summary View ➞ 0 - 25 , 25 - 50 , 50 - 75 , 75 - 100 , 100 - 125 , 125 - 150 , 150 - 175 , 175 - 200 , 200 - 225 , 225 - 250 , 250 - 275 , 275 - 300 , 300 - 325 , 325 - 350 , 350 - 375 , 375 - 400 , 400 - 425 , 425 - 450 , 450 - 475 , 475 - 500 | ||
| Click To Change The Sort Order: By Market Cap or Company Size Performance: Year-to-date, Week and Day | |
| Select Chart Type: | ||
|
Best Stocks Today 12Stocks.com |
© 2024 12Stocks.com Terms & Conditions Privacy Contact Us
All Information Provided Only For Education And Not To Be Used For Investing or Trading. See Terms & Conditions


One More Thing ... Get Best Stocks Delivered Daily!
Never Ever Miss A Move With Our Top Ten Stocks Lists
Find Best Stocks In Any Market - Bull or Bear Market
Take A Peek At Our Top Ten Stocks Lists: Daily, Weekly, Year-to-Date & Top Trends
Find Best Stocks In Any Market - Bull or Bear Market
Take A Peek At Our Top Ten Stocks Lists: Daily, Weekly, Year-to-Date & Top Trends
S&P 500 Stocks With Best Up Trends [0-bearish to 100-bullish]: Kinder Morgan[100], Entergy [100], Bunge [100], Philip Morris[100], Wells Fargo[100], Duke [100], General Mills[100], Lockheed Martin[100], Genuine Parts[100], Consolidated Edison[100], Conagra Brands[100]
Best S&P 500 Stocks Year-to-Date:
NVIDIA [53.87%], Constellation [52.26%], Meta Platforms[38.28%], NRG [35.34%], Progressive [34.73%], Marathon [32.37%], Targa Resources[29.98%], Diamondback [29.43%], Western Digital[26.1%], Valero [26.07%], Eaton [25.83%] Best S&P 500 Stocks This Week:
United Airlines[22.94%], UnitedHealth [14.1%], Globe Life[12.78%], Genuine Parts[11.7%], ProShares UltraPro[9.95%], American Airlines[7.22%], Wells Fargo[6.87%], Southwest Airlines[6.68%], M&T Bank[6.57%], General Mills[6.36%], Centene [6.21%] Best S&P 500 Stocks Daily:
American Express[6.22%], Fifth Third[5.86%], Walgreens Boots[3.75%], Kinder Morgan[3.46%], Bank of America[3.35%], J. M.[3.31%], Citizens Financial[3.31%], Truist Financial[3.05%], PNC Financial[3.00%], M&T Bank[2.94%], Entergy [2.91%]