
 Login Sign Up


| |||||
 |  | ||||

| 12Stocks.com Market Intelligence |
Best S&P 500 Stocks
|
On this page, you will find the most comprehensive analysis of S&P 500 stocks and ETFs - from latest trends to performances to charts ➞. First, here are the year-to-date (YTD) performances of the most requested S&P 500 stocks at 12Stocks.com (click stock for review):
| NVIDIA 61% | ||
| Caterpillar 23% | ||
| Merck 16% | ||
| Amazon.com 16% | ||
| Google 14% | ||
| Walmart 14% | ||
| JPMorgan Chase 14% | ||
| Chevron 10% | ||
| Goldman Sachs 10% | ||
| Microsoft 9% | ||
| Johnson & Johnson -5% | ||
| McDonald s -7% | ||
| Starbucks -8% | ||
| Apple -12% | ||
| Gilead -17% | ||
| Intel -31% | ||
| Boeing -37% | ||
| Quick: S&P 500 Stocks Lists: Performances & Trends, S&P 500 Stock Charts
Sort S&P 500 stocks: Daily, Weekly, Year-to-Date, Market Cap & Trends. Filter S&P 500 stocks list by sector: Show all, Tech, Finance, Energy, Staples, Retail, Industrial, Materials, Utilities and HealthCare |
| 12Stocks.com S&P 500 Stocks Performances & Trends Daily Report | |||||||||
|
| 
The overall Smart Investing & Trading Score is 58 (0-bearish to 100-bullish) which puts S&P 500 index in short term neutral trend. The Smart Investing & Trading Score from previous trading session is 51 and an improvement of trend continues. | ||||||||
Here are the Smart Investing & Trading Scores of the most requested S&P 500 stocks at 12Stocks.com (click stock name for detailed review):
|


| 12Stocks.com: Top Performing S&P 500 Index Stocks | ||||||||||||||||||||||||||||||||||||||||||||||||
 The top performing S&P 500 Index stocks year to date are
Now, more recently, over last week, the top performing S&P 500 Index stocks on the move are


|
||||||||||||||||||||||||||||||||||||||||||||||||
| 12Stocks.com: Investing in S&P 500 Index with Stocks | |
|
The following table helps investors and traders sort through current performance and trends (as measured by Smart Investing & Trading Score) of various
stocks in the S&P 500 Index. Quick View: Move mouse or cursor over stock symbol (ticker) to view short-term technical chart and over stock name to view long term chart. Click on  to add stock symbol to your watchlist and to add stock symbol to your watchlist and  to view watchlist. Click on any ticker or stock name for detailed market intelligence report for that stock. to view watchlist. Click on any ticker or stock name for detailed market intelligence report for that stock. |
12Stocks.com Performance of Stocks in S&P 500 Index
| Ticker | Stock Name | Watchlist | Category | Recent Price | Smart Investing & Trading Score | Change % | Weekly Change% |
| TRGP | Targa Resources |   | Energy | 116.90 | 83 | 0.77% | 3.52% |
| SYK | Stryker | | Health Care | 336.85 | 45 | 0.58% | 3.51% |
| NEE | NextEra | | Utilities | 66.56 | 100 | 0.54% | 3.51% |
| AXP | American Express | | Financials | 239.12 | 100 | 0.07% | 3.50% |
| NTRS | Northern Trust | | Financials | 84.29 | 68 | 0.13% | 3.49% |
| LULU | Lululemon Athletica | | Consumer Staples | 364.62 | 64 | -0.02% | 3.45% |
| AMD | Advanced Micro | | Technology | 151.68 | 32 | -0.39% | 3.44% |
| ARE | Alexandria Real | | Financials | 119.65 | 35 | 0.13% | 3.42% |
| GOOG | | Technology | 161.05 | 100 | 0.71% | 3.42% | |
| MAR | Marriott | | Services & Goods | 244.04 | 58 | 1.81% | 3.41% |
| AMAT | Applied Materials | | Technology | 196.22 | 63 | 1.54% | 3.40% |
| HSIC | Henry Schein | | Services & Goods | 73.25 | 67 | 0.67% | 3.37% |
| HST | Host Hotels | | Financials | 19.33 | 45 | 0.21% | 3.31% |
| SJM | J. M. | | Consumer Staples | 118.55 | 74 | 0.72% | 3.30% |
| GOOGL | | Technology | 159.18 | 93 | 0.58% | 3.30% | |
| SNPS | Synopsys | | Technology | 527.52 | 45 | 0.00% | 3.29% |
| FTNT | Fortinet | | Technology | 65.46 | 68 | 1.02% | 3.25% |
| LH | Laboratory | | Health Care | 207.94 | 49 | -0.01% | 3.21% |
| RJF | Raymond James | | Financials | 127.54 | 88 | 0.31% | 3.19% |
| MTB | M&T Bank | | Financials | 147.96 | 100 | 0.75% | 3.19% |
| CEG | Constellation | | Utilities | 186.68 | 61 | -0.84% | 3.19% |
| LDOS | Leidos Holdings | | Technology | 128.90 | 78 | 0.17% | 3.19% |
| EW | Edwards Life | | Health Care | 88.61 | 68 | 0.98% | 3.11% |
| CAG | Conagra Brands | | Consumer Staples | 31.57 | 100 | 0.96% | 3.10% |
| HES | Hess | | Energy | 159.13 | 93 | 1.40% | 3.10% |
| For chart view version of above stock list: Chart View ➞ 0 - 25 , 25 - 50 , 50 - 75 , 75 - 100 , 100 - 125 , 125 - 150 , 150 - 175 , 175 - 200 , 200 - 225 , 225 - 250 , 250 - 275 , 275 - 300 , 300 - 325 , 325 - 350 , 350 - 375 , 375 - 400 , 400 - 425 , 425 - 450 , 450 - 475 , 475 - 500 | ||
 | Click To Change The Sort Order: By Market Cap or Company Size Performance: Year-to-date, Week and Day |  |
|
Get the most comprehensive stock market coverage daily at 12Stocks.com ➞ Best Stocks Today ➞ Best Stocks Weekly ➞ Best Stocks Year-to-Date ➞ Best Stocks Trends ➞  Best Stocks Today 12Stocks.com Best Nasdaq Stocks ➞ Best S&P 500 Stocks ➞ Best Tech Stocks ➞ Best Biotech Stocks ➞ |
| Detailed Overview of S&P 500 Stocks |
| S&P 500 Technical Overview, Leaders & Laggards, Top S&P 500 ETF Funds & Detailed S&P 500 Stocks List, Charts, Trends & More |
| S&P 500: Technical Analysis, Trends & YTD Performance | |
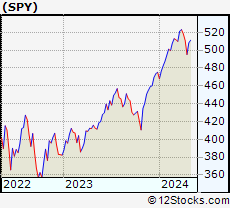
| S&P 500 index as represented by
SPY, an exchange-traded fund [ETF], holds basket of five hundred (mostly largecap) stocks from across all major sectors of the US stock market. The S&P 500 index (contains stocks like Apple and Exxon) is up by 6.33% and is currently outperforming the overall market by 0.67% year-to-date. Below is a quick view of technical charts and trends: | |
 SPY Weekly Chart |
|
| Long Term Trend: Good | |
| Medium Term Trend: Not Good | |
 SPY Daily Chart |
|
| Short Term Trend: Very Good | |
| Overall Trend Score: 58 | |
| YTD Performance: 6.33% | |
| **Trend Scores & Views Are Only For Educational Purposes And Not For Investing | |
| 12Stocks.com: Investing in S&P 500 Index using Exchange Traded Funds | |
|
The following table shows list of key exchange traded funds (ETF) that
help investors track S&P 500 index. The following list also includes leveraged ETF funds that track twice or thrice the daily returns of S&P 500 indices. Short or inverse ETF funds move in the opposite direction to the index they track and are useful during market pullbacks or during bear markets. Quick View: Move mouse or cursor over ETF symbol (ticker) to view short-term technical chart and over ETF name to view long term chart. Click on ticker or stock name for detailed view. Click on to add stock symbol to your watchlist and to view watchlist. |
12Stocks.com List of ETFs that track S&P 500 Index
| Ticker | ETF Name | Watchlist | Recent Price | Smart Investing & Trading Score | Change % | Week % | Year-to-date % |
| SPY | SPDR S&P 500 ETF | | 505.41 | 58 | -0.05 | 2.07 | 6.33% |
| IVV | iShares Core S&P 500 ETF | | 507.97 | 63 | -0.04 | 2.1 | 6.35% |
| VOO | Vanguard 500 ETF | | 464.50 | 63 | -0.07 | 2.07 | 6.34% |
| OEF | iShares S&P 100 | | 239.79 | 58 | -0.07 | 2.18 | 7.34% |
| SSO | ProShares Ultra S&P500 | | 71.95 | 58 | -0.12 | 4.11 | 10.57% |
| UPRO | ProShares UltraPro S&P500 | | 62.88 | 58 | -0.08 | 6.29 | 14.87% |
| SPXL | Direxion Daily S&P500 Bull 3X ETF | | 119.35 | 63 | -0.13 | 6.04 | 14.77% |
| SH | ProShares Short S&P500 | | 12.33 | 42 | -0.08 | -2.07 | -5.08% |
| SDS | ProShares UltraShort S&P500 | | 26.80 | 42 | 0.07 | -3.94 | -10.43% |
| SPXU | ProShares UltraPro Short S&P500 | | 36.04 | 42 | 0.14 | -5.97 | -16.19% |
| SPXS | Direxion Daily S&P 500 Bear 3X ETF | | 9.75 | 32 | 0.00 | -5.89 | -15.58% |
| 12Stocks.com: Charts, Trends, Fundamental Data and Performances of S&P 500 Stocks | |
|
We now take in-depth look at all S&P 500 stocks including charts, multi-period performances and overall trends (as measured by Smart Investing & Trading Score). One can sort S&P 500 stocks (click link to choose) by Daily, Weekly and by Year-to-Date performances. Also, one can sort by size of the company or by market capitalization. |
| Select Your Default Chart Type: | |||||
| |||||
| Click on stock symbol or name for detailed view. Click on to add stock symbol to your watchlist and to view watchlist. Quick View: Move mouse or cursor over "Daily" to quickly view daily technical stock chart and over "Weekly" to view weekly technical stock chart. | |||||

 | TRGP Targa Resources Corp. |
| Sector: Energy | |
| SubSector: Oil & Gas Pipelines | |
| MarketCap: 2210.65 Millions | |
| Recent Price: 116.90 Smart Investing & Trading Score: 83 | |
| Day Percent Change: 0.77% Day Change: 0.89 | |
| Week Change: 3.52% Year-to-date Change: 34.6% | |
| TRGP Links: Profile News Message Board | |
| Charts:- Daily , Weekly | |
| Add TRGP to Watchlist: View: Get TRGP Trend Analysis ➞ | |
 | SYK Stryker Corporation |
| Sector: Health Care | |
| SubSector: Medical Appliances & Equipment | |
| MarketCap: 59441.3 Millions | |
| Recent Price: 336.85 Smart Investing & Trading Score: 45 | |
| Day Percent Change: 0.58% Day Change: 1.94 | |
| Week Change: 3.51% Year-to-date Change: 12.5% | |
| SYK Links: Profile News Message Board | |
| Charts:- Daily , Weekly | |
| Add SYK to Watchlist: View: Get SYK Trend Analysis ➞ | |
 | NEE NextEra Energy, Inc. |
| Sector: Utilities | |
| SubSector: Electric Utilities | |
| MarketCap: 108288 Millions | |
| Recent Price: 66.56 Smart Investing & Trading Score: 100 | |
| Day Percent Change: 0.54% Day Change: 0.36 | |
| Week Change: 3.51% Year-to-date Change: 9.6% | |
| NEE Links: Profile News Message Board | |
| Charts:- Daily , Weekly | |
| Add NEE to Watchlist: View: Get NEE Trend Analysis ➞ | |
 | AXP American Express Company |
| Sector: Financials | |
| SubSector: Credit Services | |
| MarketCap: 68388 Millions | |
| Recent Price: 239.12 Smart Investing & Trading Score: 100 | |
| Day Percent Change: 0.07% Day Change: 0.16 | |
| Week Change: 3.5% Year-to-date Change: 27.6% | |
| AXP Links: Profile News Message Board | |
| Charts:- Daily , Weekly | |
| Add AXP to Watchlist: View: Get AXP Trend Analysis ➞ | |
 | NTRS Northern Trust Corporation |
| Sector: Financials | |
| SubSector: Asset Management | |
| MarketCap: 15316.8 Millions | |
| Recent Price: 84.29 Smart Investing & Trading Score: 68 | |
| Day Percent Change: 0.13% Day Change: 0.11 | |
| Week Change: 3.49% Year-to-date Change: -0.1% | |
| NTRS Links: Profile News Message Board | |
| Charts:- Daily , Weekly | |
| Add NTRS to Watchlist: View: Get NTRS Trend Analysis ➞ | |
 | LULU Lululemon Athletica Inc. |
| Sector: Consumer Staples | |
| SubSector: Textile - Apparel Clothing | |
| MarketCap: 24627.8 Millions | |
| Recent Price: 364.62 Smart Investing & Trading Score: 64 | |
| Day Percent Change: -0.02% Day Change: -0.06 | |
| Week Change: 3.45% Year-to-date Change: -28.7% | |
| LULU Links: Profile News Message Board | |
| Charts:- Daily , Weekly | |
| Add LULU to Watchlist: View: Get LULU Trend Analysis ➞ | |
 | AMD Advanced Micro Devices, Inc. |
| Sector: Technology | |
| SubSector: Semiconductor - Broad Line | |
| MarketCap: 54275.1 Millions | |
| Recent Price: 151.68 Smart Investing & Trading Score: 32 | |
| Day Percent Change: -0.39% Day Change: -0.59 | |
| Week Change: 3.44% Year-to-date Change: 2.9% | |
| AMD Links: Profile News Message Board | |
| Charts:- Daily , Weekly | |
| Add AMD to Watchlist: View: Get AMD Trend Analysis ➞ | |
 | ARE Alexandria Real Estate Equities, Inc. |
| Sector: Financials | |
| SubSector: REIT - Office | |
| MarketCap: 16793.6 Millions | |
| Recent Price: 119.65 Smart Investing & Trading Score: 35 | |
| Day Percent Change: 0.13% Day Change: 0.16 | |
| Week Change: 3.42% Year-to-date Change: -5.6% | |
| ARE Links: Profile News Message Board | |
| Charts:- Daily , Weekly | |
| Add ARE to Watchlist: View: Get ARE Trend Analysis ➞ | |
 | GOOG Alphabet Inc. |
| Sector: Technology | |
| SubSector: Internet Information Providers | |
| MarketCap: 730159 Millions | |
| Recent Price: 161.05 Smart Investing & Trading Score: 100 | |
| Day Percent Change: 0.71% Day Change: 1.13 | |
| Week Change: 3.42% Year-to-date Change: 14.3% | |
| GOOG Links: Profile News Message Board | |
| Charts:- Daily , Weekly | |
| Add GOOG to Watchlist: View: Get GOOG Trend Analysis ➞ | |
 | MAR Marriott International, Inc. |
| Sector: Services & Goods | |
| SubSector: Lodging | |
| MarketCap: 25831.6 Millions | |
| Recent Price: 244.04 Smart Investing & Trading Score: 58 | |
| Day Percent Change: 1.81% Day Change: 4.35 | |
| Week Change: 3.41% Year-to-date Change: 8.2% | |
| MAR Links: Profile News Message Board | |
| Charts:- Daily , Weekly | |
| Add MAR to Watchlist: View: Get MAR Trend Analysis ➞ | |
 | AMAT Applied Materials, Inc. |
| Sector: Technology | |
| SubSector: Semiconductor Equipment & Materials | |
| MarketCap: 40593.8 Millions | |
| Recent Price: 196.22 Smart Investing & Trading Score: 63 | |
| Day Percent Change: 1.54% Day Change: 2.98 | |
| Week Change: 3.4% Year-to-date Change: 21.1% | |
| AMAT Links: Profile News Message Board | |
| Charts:- Daily , Weekly | |
| Add AMAT to Watchlist: View: Get AMAT Trend Analysis ➞ | |
 | HSIC Henry Schein, Inc. |
| Sector: Services & Goods | |
| SubSector: Medical Equipment Wholesale | |
| MarketCap: 6760.9 Millions | |
| Recent Price: 73.25 Smart Investing & Trading Score: 67 | |
| Day Percent Change: 0.67% Day Change: 0.49 | |
| Week Change: 3.37% Year-to-date Change: -3.3% | |
| HSIC Links: Profile News Message Board | |
| Charts:- Daily , Weekly | |
| Add HSIC to Watchlist: View: Get HSIC Trend Analysis ➞ | |
 | HST Host Hotels & Resorts, Inc. |
| Sector: Financials | |
| SubSector: REIT - Hotel/Motel | |
| MarketCap: 8253.74 Millions | |
| Recent Price: 19.33 Smart Investing & Trading Score: 45 | |
| Day Percent Change: 0.21% Day Change: 0.04 | |
| Week Change: 3.31% Year-to-date Change: -0.7% | |
| HST Links: Profile News Message Board | |
| Charts:- Daily , Weekly | |
| Add HST to Watchlist: View: Get HST Trend Analysis ➞ | |
 | SJM The J. M. Smucker Company |
| Sector: Consumer Staples | |
| SubSector: Processed & Packaged Goods | |
| MarketCap: 12635.8 Millions | |
| Recent Price: 118.55 Smart Investing & Trading Score: 74 | |
| Day Percent Change: 0.72% Day Change: 0.85 | |
| Week Change: 3.3% Year-to-date Change: -6.2% | |
| SJM Links: Profile News Message Board | |
| Charts:- Daily , Weekly | |
| Add SJM to Watchlist: View: Get SJM Trend Analysis ➞ | |
 | GOOGL Alphabet Inc. |
| Sector: Technology | |
| SubSector: Internet Information Providers | |
| MarketCap: 801264 Millions | |
| Recent Price: 159.18 Smart Investing & Trading Score: 93 | |
| Day Percent Change: 0.58% Day Change: 0.92 | |
| Week Change: 3.3% Year-to-date Change: 14.0% | |
| GOOGL Links: Profile News Message Board | |
| Charts:- Daily , Weekly | |
| Add GOOGL to Watchlist: View: Get GOOGL Trend Analysis ➞ | |
 | SNPS Synopsys, Inc. |
| Sector: Technology | |
| SubSector: Semiconductor Equipment & Materials | |
| MarketCap: 18273.8 Millions | |
| Recent Price: 527.52 Smart Investing & Trading Score: 45 | |
| Day Percent Change: 0.00% Day Change: 0.02 | |
| Week Change: 3.29% Year-to-date Change: 2.5% | |
| SNPS Links: Profile News Message Board | |
| Charts:- Daily , Weekly | |
| Add SNPS to Watchlist: View: Get SNPS Trend Analysis ➞ | |
 | FTNT Fortinet, Inc. |
| Sector: Technology | |
| SubSector: Application Software | |
| MarketCap: 16993.8 Millions | |
| Recent Price: 65.46 Smart Investing & Trading Score: 68 | |
| Day Percent Change: 1.02% Day Change: 0.66 | |
| Week Change: 3.25% Year-to-date Change: 11.8% | |
| FTNT Links: Profile News Message Board | |
| Charts:- Daily , Weekly | |
| Add FTNT to Watchlist: View: Get FTNT Trend Analysis ➞ | |
 | LH Laboratory Corporation of America Holdings |
| Sector: Health Care | |
| SubSector: Medical Laboratories & Research | |
| MarketCap: 12119.2 Millions | |
| Recent Price: 207.94 Smart Investing & Trading Score: 49 | |
| Day Percent Change: -0.01% Day Change: -0.03 | |
| Week Change: 3.21% Year-to-date Change: -8.5% | |
| LH Links: Profile News Message Board | |
| Charts:- Daily , Weekly | |
| Add LH to Watchlist: View: Get LH Trend Analysis ➞ | |
 | RJF Raymond James Financial, Inc. |
| Sector: Financials | |
| SubSector: Investment Brokerage - Regional | |
| MarketCap: 9490.65 Millions | |
| Recent Price: 127.54 Smart Investing & Trading Score: 88 | |
| Day Percent Change: 0.31% Day Change: 0.40 | |
| Week Change: 3.19% Year-to-date Change: 14.4% | |
| RJF Links: Profile News Message Board | |
| Charts:- Daily , Weekly | |
| Add RJF to Watchlist: View: Get RJF Trend Analysis ➞ | |
 | MTB M&T Bank Corporation |
| Sector: Financials | |
| SubSector: Regional - Northeast Banks | |
| MarketCap: 13950.9 Millions | |
| Recent Price: 147.96 Smart Investing & Trading Score: 100 | |
| Day Percent Change: 0.75% Day Change: 1.10 | |
| Week Change: 3.19% Year-to-date Change: 7.9% | |
| MTB Links: Profile News Message Board | |
| Charts:- Daily , Weekly | |
| Add MTB to Watchlist: View: Get MTB Trend Analysis ➞ | |
 | CEG Constellation Energy Corporation |
| Sector: Utilities | |
| SubSector: Utilities - Renewable | |
| MarketCap: 29600 Millions | |
| Recent Price: 186.68 Smart Investing & Trading Score: 61 | |
| Day Percent Change: -0.84% Day Change: -1.57 | |
| Week Change: 3.19% Year-to-date Change: 59.4% | |
| CEG Links: Profile News Message Board | |
| Charts:- Daily , Weekly | |
| Add CEG to Watchlist: View: Get CEG Trend Analysis ➞ | |
 | LDOS Leidos Holdings, Inc. |
| Sector: Technology | |
| SubSector: Information Technology Services | |
| MarketCap: 11707.5 Millions | |
| Recent Price: 128.90 Smart Investing & Trading Score: 78 | |
| Day Percent Change: 0.17% Day Change: 0.22 | |
| Week Change: 3.19% Year-to-date Change: 19.1% | |
| LDOS Links: Profile News Message Board | |
| Charts:- Daily , Weekly | |
| Add LDOS to Watchlist: View: Get LDOS Trend Analysis ➞ | |
 | EW Edwards Lifesciences Corporation |
| Sector: Health Care | |
| SubSector: Medical Appliances & Equipment | |
| MarketCap: 36735.5 Millions | |
| Recent Price: 88.61 Smart Investing & Trading Score: 68 | |
| Day Percent Change: 0.98% Day Change: 0.86 | |
| Week Change: 3.11% Year-to-date Change: 16.2% | |
| EW Links: Profile News Message Board | |
| Charts:- Daily , Weekly | |
| Add EW to Watchlist: View: Get EW Trend Analysis ➞ | |
 | CAG Conagra Brands, Inc. |
| Sector: Consumer Staples | |
| SubSector: Processed & Packaged Goods | |
| MarketCap: 14084.1 Millions | |
| Recent Price: 31.57 Smart Investing & Trading Score: 100 | |
| Day Percent Change: 0.96% Day Change: 0.30 | |
| Week Change: 3.1% Year-to-date Change: 10.2% | |
| CAG Links: Profile News Message Board | |
| Charts:- Daily , Weekly | |
| Add CAG to Watchlist: View: Get CAG Trend Analysis ➞ | |
 | HES Hess Corporation |
| Sector: Energy | |
| SubSector: Independent Oil & Gas | |
| MarketCap: 10465.3 Millions | |
| Recent Price: 159.13 Smart Investing & Trading Score: 93 | |
| Day Percent Change: 1.40% Day Change: 2.19 | |
| Week Change: 3.1% Year-to-date Change: 10.4% | |
| HES Links: Profile News Message Board | |
| Charts:- Daily , Weekly | |
| Add HES to Watchlist: View: Get HES Trend Analysis ➞ | |
| For tabular summary view of above stock list: Summary View ➞ 0 - 25 , 25 - 50 , 50 - 75 , 75 - 100 , 100 - 125 , 125 - 150 , 150 - 175 , 175 - 200 , 200 - 225 , 225 - 250 , 250 - 275 , 275 - 300 , 300 - 325 , 325 - 350 , 350 - 375 , 375 - 400 , 400 - 425 , 425 - 450 , 450 - 475 , 475 - 500 | ||
| Click To Change The Sort Order: By Market Cap or Company Size Performance: Year-to-date, Week and Day | |
| Select Chart Type: | ||
|
Best Stocks Today 12Stocks.com |
© 2024 12Stocks.com Terms & Conditions Privacy Contact Us
All Information Provided Only For Education And Not To Be Used For Investing or Trading. See Terms & Conditions


One More Thing ... Get Best Stocks Delivered Daily!
Never Ever Miss A Move With Our Top Ten Stocks Lists
Find Best Stocks In Any Market - Bull or Bear Market
Take A Peek At Our Top Ten Stocks Lists: Daily, Weekly, Year-to-Date & Top Trends
Find Best Stocks In Any Market - Bull or Bear Market
Take A Peek At Our Top Ten Stocks Lists: Daily, Weekly, Year-to-Date & Top Trends
S&P 500 Stocks With Best Up Trends [0-bearish to 100-bullish]: Hasbro [100], Wabtec [100], Boston Scientific[100], Texas Instruments[100], Microchip [100], Synchrony Financial[100], EQT [100], PepsiCo [100], Analog Devices[100], Equity Residential[100], Essex Property[100]
Best S&P 500 Stocks Year-to-Date:
NVIDIA [60.89%], Constellation [59.4%], NRG [40.44%], Meta Platforms[39.4%], Targa Resources[34.57%], Marathon [34.23%], Progressive [33.22%], Western Digital[32.88%], Eaton [32.38%], Diamondback [32.34%], Micron [30.98%] Best S&P 500 Stocks This Week:
Globe Life[17.77%], Hasbro [17.66%], Wabtec [13.32%], Microchip [11.07%], Tesla [10.24%], Texas Instruments[9.47%], NXP Semiconductors[9.29%], CoStar [9.21%], Kimberly-Clark [8.63%], Monolithic Power[8.57%], Synchrony Financial[8.3%] Best S&P 500 Stocks Daily:
Tesla [12.05%], Hasbro [11.85%], Wabtec [10.04%], CoStar [8.74%], ON Semiconductor[6.26%], Boston Scientific[5.68%], Texas Instruments[5.64%], Microchip [5.26%], Monolithic Power[5.04%], Synchrony Financial[5.04%], Biogen [4.52%]