
 Login Sign Up


| |||||
 |  | ||||

| 12Stocks.com Market Intelligence |
Best S&P 500 Stocks
|
On this page, you will find the most comprehensive analysis of S&P 500 stocks and ETFs - from latest trends to performances to charts ➞. First, here are the year-to-date (YTD) performances of the most requested S&P 500 stocks at 12Stocks.com (click stock for review):
| NVIDIA 63% | ||
| Merck 20% | ||
| Walmart 14% | ||
| JPMorgan Chase 13% | ||
| Caterpillar 13% | ||
| Amazon.com 12% | ||
| Chevron 10% | ||
| Google 9% | ||
| Goldman Sachs 8% | ||
| Microsoft 4% | ||
| Johnson & Johnson -6% | ||
| McDonald s -7% | ||
| Starbucks -8% | ||
| Apple -12% | ||
| Gilead -18% | ||
| Intel -31% | ||
| Boeing -38% | ||
| Quick: S&P 500 Stocks Lists: Performances & Trends, S&P 500 Stock Charts
Sort S&P 500 stocks: Daily, Weekly, Year-to-Date, Market Cap & Trends. Filter S&P 500 stocks list by sector: Show all, Tech, Finance, Energy, Staples, Retail, Industrial, Materials, Utilities and HealthCare |
| 12Stocks.com S&P 500 Stocks Performances & Trends Daily Report | |||||||||
|
| 
The overall Smart Investing & Trading Score is 44 (0-bearish to 100-bullish) which puts S&P 500 index in short term neutral trend. The Smart Investing & Trading Score from previous trading session is 58 and hence a deterioration of trend. | ||||||||
Here are the Smart Investing & Trading Scores of the most requested S&P 500 stocks at 12Stocks.com (click stock name for detailed review):
|


| 12Stocks.com: Top Performing S&P 500 Index Stocks | ||||||||||||||||||||||||||||||||||||||||||||||||
 The top performing S&P 500 Index stocks year to date are
Now, more recently, over last week, the top performing S&P 500 Index stocks on the move are


|
||||||||||||||||||||||||||||||||||||||||||||||||
| 12Stocks.com: Investing in S&P 500 Index with Stocks | |
|
The following table helps investors and traders sort through current performance and trends (as measured by Smart Investing & Trading Score) of various
stocks in the S&P 500 Index. Quick View: Move mouse or cursor over stock symbol (ticker) to view short-term technical chart and over stock name to view long term chart. Click on  to add stock symbol to your watchlist and to add stock symbol to your watchlist and  to view watchlist. Click on any ticker or stock name for detailed market intelligence report for that stock. to view watchlist. Click on any ticker or stock name for detailed market intelligence report for that stock. |
12Stocks.com Performance of Stocks in S&P 500 Index
| Ticker | Stock Name | Watchlist | Category | Recent Price | Smart Investing & Trading Score | Change % | Weekly Change% |
| HAS | Hasbro |   | Consumer Staples | 63.52 | 100 | -2.31% | 14.94% |
| TYL | Tyler Technologies | | Technology | 460.86 | 64 | 9.99% | 14.26% |
| GL | Globe Life | | Financials | 76.23 | 27 | -3.02% | 14.22% |
| WAB | Wabtec | | Transports | 161.45 | 93 | -1.18% | 11.99% |
| MCHP | Microchip | | Technology | 90.81 | 100 | 0.14% | 11.17% |
| TSLA | Tesla | | Consumer Staples | 162.97 | 42 | 0.52% | 10.83% |
| TER | Teradyne | | Technology | 106.18 | 58 | 5.44% | 10.63% |
| NXPI | NXP Semiconductors | | Technology | 236.82 | 75 | 0.76% | 10.09% |
| TXN | Texas Instruments | | Technology | 174.68 | 100 | -0.07% | 9.39% |
| BSX | Boston Scientific | | Health Care | 73.52 | 100 | 0.83% | 9.19% |
| MPWR | Monolithic Power | | Technology | 644.88 | 68 | 0.41% | 9.02% |
| KMB | Kimberly-Clark | | Consumer Staples | 137.57 | 100 | -0.16% | 8.46% |
| ON | ON Semiconductor | | Technology | 65.65 | 42 | 0.18% | 8.14% |
| GE | General Electric | | Industrials | 159.15 | 80 | -0.03% | 7.49% |
| EQT | EQT | | Energy | 39.37 | 100 | -0.15% | 7.42% |
| ADI | Analog Devices | | Technology | 196.85 | 100 | 0.18% | 7.36% |
| QRVO | Qorvo | | Technology | 112.49 | 85 | 0.30% | 7.25% |
| CARR | Carrier Global | | Industrials | 57.91 | 95 | 5.73% | 7.24% |
| AVGO | Broadcom | | Technology | 1289.45 | 58 | 2.60% | 7.03% |
| CSGP | CoStar | | Financials | 89.86 | 80 | -2.28% | 6.64% |
| KDP | Keurig Dr | | Consumer Staples | 33.56 | 80 | 3.77% | 6.51% |
| RCL | Royal Caribbean | | Services & Goods | 137.57 | 88 | 0.61% | 6.47% |
| DGX | Quest Diagnostics | | Health Care | 136.62 | 100 | -0.68% | 6.36% |
| SWKS | Skyworks Solutions | | Technology | 101.99 | 42 | 0.86% | 6.11% |
| CMG | Chipotle Mexican | | Services & Goods | 3040.95 | 100 | 3.90% | 5.99% |
| For chart view version of above stock list: Chart View ➞ 0 - 25 , 25 - 50 , 50 - 75 , 75 - 100 , 100 - 125 , 125 - 150 , 150 - 175 , 175 - 200 , 200 - 225 , 225 - 250 , 250 - 275 , 275 - 300 , 300 - 325 , 325 - 350 , 350 - 375 , 375 - 400 , 400 - 425 , 425 - 450 , 450 - 475 , 475 - 500 | ||
 | Click To Change The Sort Order: By Market Cap or Company Size Performance: Year-to-date, Week and Day |  |
|
Get the most comprehensive stock market coverage daily at 12Stocks.com ➞ Best Stocks Today ➞ Best Stocks Weekly ➞ Best Stocks Year-to-Date ➞ Best Stocks Trends ➞  Best Stocks Today 12Stocks.com Best Nasdaq Stocks ➞ Best S&P 500 Stocks ➞ Best Tech Stocks ➞ Best Biotech Stocks ➞ |
| Detailed Overview of S&P 500 Stocks |
| S&P 500 Technical Overview, Leaders & Laggards, Top S&P 500 ETF Funds & Detailed S&P 500 Stocks List, Charts, Trends & More |
| S&P 500: Technical Analysis, Trends & YTD Performance | |
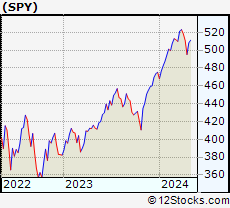
| S&P 500 index as represented by
SPY, an exchange-traded fund [ETF], holds basket of five hundred (mostly largecap) stocks from across all major sectors of the US stock market. The S&P 500 index (contains stocks like Apple and Exxon) is up by 4.7% and is currently outperforming the overall market by 0.78% year-to-date. Below is a quick view of technical charts and trends: | |
 SPY Weekly Chart |
|
| Long Term Trend: Good | |
| Medium Term Trend: Not Good | |
 SPY Daily Chart |
|
| Short Term Trend: Not Good | |
| Overall Trend Score: 44 | |
| YTD Performance: 4.7% | |
| **Trend Scores & Views Are Only For Educational Purposes And Not For Investing | |
| 12Stocks.com: Investing in S&P 500 Index using Exchange Traded Funds | |
|
The following table shows list of key exchange traded funds (ETF) that
help investors track S&P 500 index. The following list also includes leveraged ETF funds that track twice or thrice the daily returns of S&P 500 indices. Short or inverse ETF funds move in the opposite direction to the index they track and are useful during market pullbacks or during bear markets. Quick View: Move mouse or cursor over ETF symbol (ticker) to view short-term technical chart and over ETF name to view long term chart. Click on ticker or stock name for detailed view. Click on to add stock symbol to your watchlist and to view watchlist. |
12Stocks.com List of ETFs that track S&P 500 Index
| Ticker | ETF Name | Watchlist | Recent Price | Smart Investing & Trading Score | Change % | Week % | Year-to-date % |
| SPY | SPDR S&P 500 ETF | | 497.67 | 44 | -1.53 | 0.51 | 4.7% |
| OEF | iShares S&P 100 | | 235.56 | 34 | -1.76 | 0.37 | 5.45% |
| SSO | ProShares Ultra S&P500 | | 69.83 | 44 | -2.94 | 1.05 | 7.32% |
| UPRO | ProShares UltraPro S&P500 | | 60.03 | 36 | -4.52 | 1.48 | 9.67% |
| SH | ProShares Short S&P500 | | 12.53 | 62 | 1.58 | -0.52 | -3.58% |
| SDS | ProShares UltraShort S&P500 | | 27.58 | 62 | 2.91 | -1.15 | -7.82% |
| SPXU | ProShares UltraPro Short S&P500 | | 37.68 | 69 | 4.55 | -1.7 | -12.37% |
| 12Stocks.com: Charts, Trends, Fundamental Data and Performances of S&P 500 Stocks | |
|
We now take in-depth look at all S&P 500 stocks including charts, multi-period performances and overall trends (as measured by Smart Investing & Trading Score). One can sort S&P 500 stocks (click link to choose) by Daily, Weekly and by Year-to-Date performances. Also, one can sort by size of the company or by market capitalization. |
| Select Your Default Chart Type: | |||||
| |||||
| Click on stock symbol or name for detailed view. Click on to add stock symbol to your watchlist and to view watchlist. Quick View: Move mouse or cursor over "Daily" to quickly view daily technical stock chart and over "Weekly" to view weekly technical stock chart. | |||||

 | HAS Hasbro, Inc. |
| Sector: Consumer Staples | |
| SubSector: Toys & Games | |
| MarketCap: 7389.5 Millions | |
| Recent Price: 63.52 Smart Investing & Trading Score: 100 | |
| Day Percent Change: -2.31% Day Change: -1.51 | |
| Week Change: 14.94% Year-to-date Change: 24.4% | |
| HAS Links: Profile News Message Board | |
| Charts:- Daily , Weekly | |
| Add HAS to Watchlist: View: Get HAS Trend Analysis ➞ | |
 | TYL Tyler Technologies, Inc. |
| Sector: Technology | |
| SubSector: Technical & System Software | |
| MarketCap: 10785 Millions | |
| Recent Price: 460.86 Smart Investing & Trading Score: 64 | |
| Day Percent Change: 9.99% Day Change: 41.86 | |
| Week Change: 14.26% Year-to-date Change: 10.2% | |
| TYL Links: Profile News Message Board | |
| Charts:- Daily , Weekly | |
| Add TYL to Watchlist: View: Get TYL Trend Analysis ➞ | |
 | GL Globe Life Inc. |
| Sector: Financials | |
| SubSector: Life Insurance | |
| MarketCap: 7596.46 Millions | |
| Recent Price: 76.23 Smart Investing & Trading Score: 27 | |
| Day Percent Change: -3.02% Day Change: -2.37 | |
| Week Change: 14.22% Year-to-date Change: -37.4% | |
| GL Links: Profile News Message Board | |
| Charts:- Daily , Weekly | |
| Add GL to Watchlist: View: Get GL Trend Analysis ➞ | |
 | WAB Wabtec Corporation |
| Sector: Transports | |
| SubSector: Railroads | |
| MarketCap: 8230.22 Millions | |
| Recent Price: 161.45 Smart Investing & Trading Score: 93 | |
| Day Percent Change: -1.18% Day Change: -1.93 | |
| Week Change: 11.99% Year-to-date Change: 27.2% | |
| WAB Links: Profile News Message Board | |
| Charts:- Daily , Weekly | |
| Add WAB to Watchlist: View: Get WAB Trend Analysis ➞ | |
 | MCHP Microchip Technology Incorporated |
| Sector: Technology | |
| SubSector: Semiconductor - Broad Line | |
| MarketCap: 16826.3 Millions | |
| Recent Price: 90.81 Smart Investing & Trading Score: 100 | |
| Day Percent Change: 0.14% Day Change: 0.13 | |
| Week Change: 11.17% Year-to-date Change: 0.7% | |
| MCHP Links: Profile News Message Board | |
| Charts:- Daily , Weekly | |
| Add MCHP to Watchlist: View: Get MCHP Trend Analysis ➞ | |
 | TSLA Tesla, Inc. |
| Sector: Consumer Staples | |
| SubSector: Auto Manufacturers - Major | |
| MarketCap: 89058.8 Millions | |
| Recent Price: 162.97 Smart Investing & Trading Score: 42 | |
| Day Percent Change: 0.52% Day Change: 0.84 | |
| Week Change: 10.83% Year-to-date Change: -34.4% | |
| TSLA Links: Profile News Message Board | |
| Charts:- Daily , Weekly | |
| Add TSLA to Watchlist: View: Get TSLA Trend Analysis ➞ | |
 | TER Teradyne, Inc. |
| Sector: Technology | |
| SubSector: Semiconductor Equipment & Materials | |
| MarketCap: 8135.68 Millions | |
| Recent Price: 106.18 Smart Investing & Trading Score: 58 | |
| Day Percent Change: 5.44% Day Change: 5.47 | |
| Week Change: 10.63% Year-to-date Change: -2.2% | |
| TER Links: Profile News Message Board | |
| Charts:- Daily , Weekly | |
| Add TER to Watchlist: View: Get TER Trend Analysis ➞ | |
 | NXPI NXP Semiconductors N.V. |
| Sector: Technology | |
| SubSector: Semiconductor - Broad Line | |
| MarketCap: 22497.9 Millions | |
| Recent Price: 236.82 Smart Investing & Trading Score: 75 | |
| Day Percent Change: 0.76% Day Change: 1.78 | |
| Week Change: 10.09% Year-to-date Change: 3.1% | |
| NXPI Links: Profile News Message Board | |
| Charts:- Daily , Weekly | |
| Add NXPI to Watchlist: View: Get NXPI Trend Analysis ➞ | |
 | TXN Texas Instruments Incorporated |
| Sector: Technology | |
| SubSector: Semiconductor - Broad Line | |
| MarketCap: 99509.1 Millions | |
| Recent Price: 174.68 Smart Investing & Trading Score: 100 | |
| Day Percent Change: -0.07% Day Change: -0.13 | |
| Week Change: 9.39% Year-to-date Change: 2.5% | |
| TXN Links: Profile News Message Board | |
| Charts:- Daily , Weekly | |
| Add TXN to Watchlist: View: Get TXN Trend Analysis ➞ | |
 | BSX Boston Scientific Corporation |
| Sector: Health Care | |
| SubSector: Medical Appliances & Equipment | |
| MarketCap: 41541.2 Millions | |
| Recent Price: 73.52 Smart Investing & Trading Score: 100 | |
| Day Percent Change: 0.83% Day Change: 0.61 | |
| Week Change: 9.19% Year-to-date Change: 27.2% | |
| BSX Links: Profile News Message Board | |
| Charts:- Daily , Weekly | |
| Add BSX to Watchlist: View: Get BSX Trend Analysis ➞ | |
 | MPWR Monolithic Power Systems, Inc. |
| Sector: Technology | |
| SubSector: Semiconductor - Specialized | |
| MarketCap: 6436.4 Millions | |
| Recent Price: 644.88 Smart Investing & Trading Score: 68 | |
| Day Percent Change: 0.41% Day Change: 2.66 | |
| Week Change: 9.02% Year-to-date Change: 2.2% | |
| MPWR Links: Profile News Message Board | |
| Charts:- Daily , Weekly | |
| Add MPWR to Watchlist: View: Get MPWR Trend Analysis ➞ | |
 | KMB Kimberly-Clark Corporation |
| Sector: Consumer Staples | |
| SubSector: Personal Products | |
| MarketCap: 44300.5 Millions | |
| Recent Price: 137.57 Smart Investing & Trading Score: 100 | |
| Day Percent Change: -0.16% Day Change: -0.22 | |
| Week Change: 8.46% Year-to-date Change: 13.2% | |
| KMB Links: Profile News Message Board | |
| Charts:- Daily , Weekly | |
| Add KMB to Watchlist: View: Get KMB Trend Analysis ➞ | |
 | ON ON Semiconductor Corporation |
| Sector: Technology | |
| SubSector: Semiconductor - Broad Line | |
| MarketCap: 5183.82 Millions | |
| Recent Price: 65.65 Smart Investing & Trading Score: 42 | |
| Day Percent Change: 0.18% Day Change: 0.12 | |
| Week Change: 8.14% Year-to-date Change: -21.4% | |
| ON Links: Profile News Message Board | |
| Charts:- Daily , Weekly | |
| Add ON to Watchlist: View: Get ON Trend Analysis ➞ | |
 | GE General Electric Company |
| Sector: Industrials | |
| SubSector: Diversified Machinery | |
| MarketCap: 64710.6 Millions | |
| Recent Price: 159.15 Smart Investing & Trading Score: 80 | |
| Day Percent Change: -0.03% Day Change: -0.04 | |
| Week Change: 7.49% Year-to-date Change: 24.7% | |
| GE Links: Profile News Message Board | |
| Charts:- Daily , Weekly | |
| Add GE to Watchlist: View: Get GE Trend Analysis ➞ | |
 | EQT EQT Corporation |
| Sector: Energy | |
| SubSector: Independent Oil & Gas | |
| MarketCap: 1886.63 Millions | |
| Recent Price: 39.37 Smart Investing & Trading Score: 100 | |
| Day Percent Change: -0.15% Day Change: -0.06 | |
| Week Change: 7.42% Year-to-date Change: 1.8% | |
| EQT Links: Profile News Message Board | |
| Charts:- Daily , Weekly | |
| Add EQT to Watchlist: View: Get EQT Trend Analysis ➞ | |
 | ADI Analog Devices, Inc. |
| Sector: Technology | |
| SubSector: Semiconductor - Integrated Circuits | |
| MarketCap: 32859 Millions | |
| Recent Price: 196.85 Smart Investing & Trading Score: 100 | |
| Day Percent Change: 0.18% Day Change: 0.35 | |
| Week Change: 7.36% Year-to-date Change: -0.9% | |
| ADI Links: Profile News Message Board | |
| Charts:- Daily , Weekly | |
| Add ADI to Watchlist: View: Get ADI Trend Analysis ➞ | |
 | QRVO Qorvo, Inc. |
| Sector: Technology | |
| SubSector: Semiconductor - Broad Line | |
| MarketCap: 9524.32 Millions | |
| Recent Price: 112.49 Smart Investing & Trading Score: 85 | |
| Day Percent Change: 0.30% Day Change: 0.33 | |
| Week Change: 7.25% Year-to-date Change: -0.1% | |
| QRVO Links: Profile News Message Board | |
| Charts:- Daily , Weekly | |
| Add QRVO to Watchlist: View: Get QRVO Trend Analysis ➞ | |
 | CARR Carrier Global Corporation |
| Sector: Industrials | |
| SubSector: Building Products & Equipment | |
| MarketCap: 32547 Millions | |
| Recent Price: 57.91 Smart Investing & Trading Score: 95 | |
| Day Percent Change: 5.73% Day Change: 3.14 | |
| Week Change: 7.24% Year-to-date Change: 0.8% | |
| CARR Links: Profile News Message Board | |
| Charts:- Daily , Weekly | |
| Add CARR to Watchlist: View: Get CARR Trend Analysis ➞ | |
 | AVGO Broadcom Inc. |
| Sector: Technology | |
| SubSector: Semiconductor - Broad Line | |
| MarketCap: 86329.1 Millions | |
| Recent Price: 1289.45 Smart Investing & Trading Score: 58 | |
| Day Percent Change: 2.60% Day Change: 32.63 | |
| Week Change: 7.03% Year-to-date Change: 15.5% | |
| AVGO Links: Profile News Message Board | |
| Charts:- Daily , Weekly | |
| Add AVGO to Watchlist: View: Get AVGO Trend Analysis ➞ | |
 | CSGP CoStar Group, Inc. |
| Sector: Financials | |
| SubSector: Property Management | |
| MarketCap: 21454.4 Millions | |
| Recent Price: 89.86 Smart Investing & Trading Score: 80 | |
| Day Percent Change: -2.28% Day Change: -2.09 | |
| Week Change: 6.64% Year-to-date Change: 2.8% | |
| CSGP Links: Profile News Message Board | |
| Charts:- Daily , Weekly | |
| Add CSGP to Watchlist: View: Get CSGP Trend Analysis ➞ | |
 | KDP Keurig Dr Pepper Inc. |
| Sector: Consumer Staples | |
| SubSector: Beverages - Soft Drinks | |
| MarketCap: 35295.2 Millions | |
| Recent Price: 33.56 Smart Investing & Trading Score: 80 | |
| Day Percent Change: 3.77% Day Change: 1.22 | |
| Week Change: 6.51% Year-to-date Change: 0.7% | |
| KDP Links: Profile News Message Board | |
| Charts:- Daily , Weekly | |
| Add KDP to Watchlist: View: Get KDP Trend Analysis ➞ | |
 | RCL Royal Caribbean Cruises Ltd. |
| Sector: Services & Goods | |
| SubSector: Resorts & Casinos | |
| MarketCap: 7294.14 Millions | |
| Recent Price: 137.57 Smart Investing & Trading Score: 88 | |
| Day Percent Change: 0.61% Day Change: 0.84 | |
| Week Change: 6.47% Year-to-date Change: 6.2% | |
| RCL Links: Profile News Message Board | |
| Charts:- Daily , Weekly | |
| Add RCL to Watchlist: View: Get RCL Trend Analysis ➞ | |
 | DGX Quest Diagnostics Incorporated |
| Sector: Health Care | |
| SubSector: Medical Laboratories & Research | |
| MarketCap: 11076.1 Millions | |
| Recent Price: 136.62 Smart Investing & Trading Score: 100 | |
| Day Percent Change: -0.68% Day Change: -0.94 | |
| Week Change: 6.36% Year-to-date Change: -0.9% | |
| DGX Links: Profile News Message Board | |
| Charts:- Daily , Weekly | |
| Add DGX to Watchlist: View: Get DGX Trend Analysis ➞ | |
 | SWKS Skyworks Solutions, Inc. |
| Sector: Technology | |
| SubSector: Semiconductor - Integrated Circuits | |
| MarketCap: 13981 Millions | |
| Recent Price: 101.99 Smart Investing & Trading Score: 42 | |
| Day Percent Change: 0.86% Day Change: 0.86 | |
| Week Change: 6.11% Year-to-date Change: -9.3% | |
| SWKS Links: Profile News Message Board | |
| Charts:- Daily , Weekly | |
| Add SWKS to Watchlist: View: Get SWKS Trend Analysis ➞ | |
 | CMG Chipotle Mexican Grill, Inc. |
| Sector: Services & Goods | |
| SubSector: Restaurants | |
| MarketCap: 16849.9 Millions | |
| Recent Price: 3040.95 Smart Investing & Trading Score: 100 | |
| Day Percent Change: 3.90% Day Change: 114.18 | |
| Week Change: 5.99% Year-to-date Change: 33.0% | |
| CMG Links: Profile News Message Board | |
| Charts:- Daily , Weekly | |
| Add CMG to Watchlist: View: Get CMG Trend Analysis ➞ | |
| For tabular summary view of above stock list: Summary View ➞ 0 - 25 , 25 - 50 , 50 - 75 , 75 - 100 , 100 - 125 , 125 - 150 , 150 - 175 , 175 - 200 , 200 - 225 , 225 - 250 , 250 - 275 , 275 - 300 , 300 - 325 , 325 - 350 , 350 - 375 , 375 - 400 , 400 - 425 , 425 - 450 , 450 - 475 , 475 - 500 | ||
| Click To Change The Sort Order: By Market Cap or Company Size Performance: Year-to-date, Week and Day | |
| Select Chart Type: | ||
|
Best Stocks Today 12Stocks.com |
© 2024 12Stocks.com Terms & Conditions Privacy Contact Us
All Information Provided Only For Education And Not To Be Used For Investing or Trading. See Terms & Conditions


One More Thing ... Get Best Stocks Delivered Daily!
Never Ever Miss A Move With Our Top Ten Stocks Lists
Find Best Stocks In Any Market - Bull or Bear Market
Take A Peek At Our Top Ten Stocks Lists: Daily, Weekly, Year-to-Date & Top Trends
Find Best Stocks In Any Market - Bull or Bear Market
Take A Peek At Our Top Ten Stocks Lists: Daily, Weekly, Year-to-Date & Top Trends
S&P 500 Stocks With Best Up Trends [0-bearish to 100-bullish]: Newmont [100], Dover [100], Chipotle Mexican[100], Merck [100], Boston Scientific[100], Northrop Grumman[100], Coca-Cola [100], Altria [100], Procter & Gamble[100], Hess [100], Analog Devices[100]
Best S&P 500 Stocks Year-to-Date:
NVIDIA [63.06%], Constellation [59.76%], NRG [38.59%], Targa Resources[34%], Marathon [33.53%], Chipotle Mexican[32.97%], Progressive [31.92%], Diamondback [31.62%], Eaton [30.71%], Micron [29.9%], Western Digital[28.49%] Best S&P 500 Stocks This Week:
Hasbro [14.94%], Tyler Technologies[14.26%], Globe Life[14.22%], Wabtec [11.99%], Microchip [11.17%], Tesla [10.83%], Teradyne [10.63%], NXP Semiconductors[10.09%], Texas Instruments[9.39%], Boston Scientific[9.19%], Monolithic Power[9.02%] Best S&P 500 Stocks Daily:
Tyler Technologies[9.99%], Newmont [5.84%], Carrier Global[5.73%], Teradyne [5.44%], ProShares UltraPro[4.55%], Dover [4.44%], Union Pacific[4.18%], Chipotle Mexican[3.90%], Keurig Dr[3.77%], Merck [3.15%], Rollins [3.03%]