
 Login Sign Up


| |||||
 |  | ||||

| 12Stocks.com Market Intelligence |
Best S&P 500 Stocks
|
On this page, you will find the most comprehensive analysis of S&P 500 stocks and ETFs - from latest trends to performances to charts ➞. First, here are the year-to-date (YTD) performances of the most requested S&P 500 stocks at 12Stocks.com (click stock for review):
| NVIDIA 72% | ||
| Caterpillar 23% | ||
| Amazon.com 20% | ||
| Merck 15% | ||
| Walmart 13% | ||
| Google 12% | ||
| Microsoft 9% | ||
| JPMorgan Chase 8% | ||
| Chevron 6% | ||
| Goldman Sachs 5% | ||
| Johnson & Johnson -7% | ||
| McDonald s -9% | ||
| Starbucks -10% | ||
| Apple -13% | ||
| Gilead -18% | ||
| Intel -29% | ||
| Boeing -34% | ||
| Quick: S&P 500 Stocks Lists: Performances & Trends, S&P 500 Stock Charts
Sort S&P 500 stocks: Daily, Weekly, Year-to-Date, Market Cap & Trends. Filter S&P 500 stocks list by sector: Show all, Tech, Finance, Energy, Staples, Retail, Industrial, Materials, Utilities and HealthCare |
| 12Stocks.com S&P 500 Stocks Performances & Trends Daily Report | |||||||||
|
| 
The overall Smart Investing & Trading Score is 44 (0-bearish to 100-bullish) which puts S&P 500 index in short term neutral trend. The Smart Investing & Trading Score from previous trading session is 26 and hence an improvement of trend. | ||||||||
Here are the Smart Investing & Trading Scores of the most requested S&P 500 stocks at 12Stocks.com (click stock name for detailed review):
|


| 12Stocks.com: Top Performing S&P 500 Index Stocks | ||||||||||||||||||||||||||||||||||||||||||||||||
 The top performing S&P 500 Index stocks year to date are
Now, more recently, over last week, the top performing S&P 500 Index stocks on the move are


|
||||||||||||||||||||||||||||||||||||||||||||||||
| 12Stocks.com: Investing in S&P 500 Index with Stocks | |
|
The following table helps investors and traders sort through current performance and trends (as measured by Smart Investing & Trading Score) of various
stocks in the S&P 500 Index. Quick View: Move mouse or cursor over stock symbol (ticker) to view short-term technical chart and over stock name to view long term chart. Click on  to add stock symbol to your watchlist and to add stock symbol to your watchlist and  to view watchlist. Click on any ticker or stock name for detailed market intelligence report for that stock. to view watchlist. Click on any ticker or stock name for detailed market intelligence report for that stock. |
12Stocks.com Performance of Stocks in S&P 500 Index
| Ticker | Stock Name | Watchlist | Category | Recent Price | Smart Investing & Trading Score | Change % | YTD Change% |
| ZBH | Zimmer Biomet |   | Health Care | 120.42 | 0 | -0.73% | -1.05% |
| CBOE | Cboe Global | | Financials | 176.63 | 25 | -0.05% | -1.08% |
| ED | Consolidated Edison | | Utilities | 89.78 | 45 | -0.60% | -1.30% |
| NWSA | News | | Services & Goods | 24.23 | 25 | 0.33% | -1.30% |
| CSGP | CoStar | | Financials | 86.19 | 36 | 0.86% | -1.37% |
| RF | Regions Financial | | Financials | 19.10 | 61 | 1.27% | -1.44% |
| ATO | Atmos | | Utilities | 114.18 | 55 | -0.33% | -1.48% |
| BBY | Best Buy | | Services & Goods | 77.12 | 63 | 1.17% | -1.48% |
| HSY | Hershey | | Consumer Staples | 183.33 | 28 | 0.48% | -1.67% |
| AFL | Aflac | | Financials | 81.04 | 32 | 0.97% | -1.77% |
| INTU | Intuit | | Technology | 613.79 | 18 | 0.10% | -1.80% |
| BKNG | Booking Holdings | | Services & Goods | 3475.30 | 18 | 0.91% | -2.03% |
| LYV | Live Nation | | Services & Goods | 91.69 | 26 | -0.14% | -2.04% |
| CRL | Charles River | | Health Care | 231.19 | 36 | 0.48% | -2.20% |
| ROL | Rollins | | Services & Goods | 42.67 | 10 | -0.78% | -2.28% |
| INVH | Invitation Homes | | Financials | 33.32 | 61 | 0.76% | -2.32% |
| IP | Paper | | Consumer Staples | 35.27 | 10 | 0.61% | -2.42% |
| PPL | PPL | | Utilities | 26.41 | 61 | -0.04% | -2.55% |
| MS | Morgan Stanley | | Financials | 90.79 | 73 | 0.79% | -2.64% |
| DUK | Duke | | Utilities | 94.41 | 35 | -0.10% | -2.72% |
| AVB | AvalonBay Communities | | Financials | 182.09 | 61 | 0.63% | -2.74% |
| GPN | Global Payments | | Services & Goods | 123.45 | 18 | 0.41% | -2.80% |
| NOC | Northrop Grumman | | Industrials | 454.68 | 61 | 0.58% | -2.88% |
| QRVO | Qorvo | | Technology | 109.36 | 39 | -0.54% | -2.89% |
| MCO | Moody s | | Services & Goods | 379.15 | 32 | 1.00% | -2.92% |
| For chart view version of above stock list: Chart View ➞ 0 - 25 , 25 - 50 , 50 - 75 , 75 - 100 , 100 - 125 , 125 - 150 , 150 - 175 , 175 - 200 , 200 - 225 , 225 - 250 , 250 - 275 , 275 - 300 , 300 - 325 , 325 - 350 , 350 - 375 , 375 - 400 , 400 - 425 , 425 - 450 , 450 - 475 | ||
 | Click To Change The Sort Order: By Market Cap or Company Size Performance: Year-to-date, Week and Day |  |
|
Get the most comprehensive stock market coverage daily at 12Stocks.com ➞ Best Stocks Today ➞ Best Stocks Weekly ➞ Best Stocks Year-to-Date ➞ Best Stocks Trends ➞  Best Stocks Today 12Stocks.com Best Nasdaq Stocks ➞ Best S&P 500 Stocks ➞ Best Tech Stocks ➞ Best Biotech Stocks ➞ |
| Detailed Overview of S&P 500 Stocks |
| S&P 500 Technical Overview, Leaders & Laggards, Top S&P 500 ETF Funds & Detailed S&P 500 Stocks List, Charts, Trends & More |
| S&P 500: Technical Analysis, Trends & YTD Performance | |
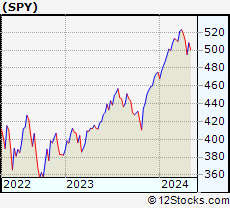
| S&P 500 index as represented by
SPY, an exchange-traded fund [ETF], holds basket of five hundred (mostly largecap) stocks from across all major sectors of the US stock market. The S&P 500 index (contains stocks like Apple and Exxon) is up by 5.9% and is currently outperforming the overall market by 0.85% year-to-date. Below is a quick view of technical charts and trends: | |
 SPY Weekly Chart |
|
| Long Term Trend: Good | |
| Medium Term Trend: Not Good | |
 SPY Daily Chart |
|
| Short Term Trend: Deteriorating | |
| Overall Trend Score: 44 | |
| YTD Performance: 5.9% | |
| **Trend Scores & Views Are Only For Educational Purposes And Not For Investing | |
| 12Stocks.com: Investing in S&P 500 Index using Exchange Traded Funds | |
|
The following table shows list of key exchange traded funds (ETF) that
help investors track S&P 500 index. The following list also includes leveraged ETF funds that track twice or thrice the daily returns of S&P 500 indices. Short or inverse ETF funds move in the opposite direction to the index they track and are useful during market pullbacks or during bear markets. Quick View: Move mouse or cursor over ETF symbol (ticker) to view short-term technical chart and over ETF name to view long term chart. Click on ticker or stock name for detailed view. Click on to add stock symbol to your watchlist and to view watchlist. |
12Stocks.com List of ETFs that track S&P 500 Index
| Ticker | ETF Name | Watchlist | Recent Price | Smart Investing & Trading Score | Change % | Week % | Year-to-date % |
| SPY | SPDR S&P 500 ETF | | 503.38 | 44 | 0.56 | -1.46 | 5.9% |
| IVV | iShares Core S&P 500 ETF | | 505.72 | 44 | 0.53 | -1.48 | 5.88% |
| VOO | Vanguard 500 ETF | | 462.63 | 44 | 0.57 | -1.48 | 5.91% |
| OEF | iShares S&P 100 | | 239.19 | 44 | 0.53 | -1.62 | 7.07% |
| SSO | ProShares Ultra S&P500 | | 71.43 | 44 | 1.09 | -3.03 | 9.77% |
| UPRO | ProShares UltraPro S&P500 | | 62.23 | 36 | 1.58 | -4.56 | 13.68% |
| SPXL | Direxion Daily S&P500 Bull 3X ETF | | 116.55 | 36 | 0.17 | -5.89 | 12.08% |
| SH | ProShares Short S&P500 | | 12.38 | 62 | -0.48 | 1.56 | -4.7% |
| SDS | ProShares UltraShort S&P500 | | 26.99 | 62 | -1.03 | 3.13 | -9.79% |
| SPXU | ProShares UltraPro Short S&P500 | | 36.49 | 69 | -1.56 | 4.68 | -15.14% |
| SPXS | Direxion Daily S&P 500 Bear 3X ETF | | 9.87 | 59 | -1.40 | 4.78 | -14.55% |
| 12Stocks.com: Charts, Trends, Fundamental Data and Performances of S&P 500 Stocks | |
|
We now take in-depth look at all S&P 500 stocks including charts, multi-period performances and overall trends (as measured by Smart Investing & Trading Score). One can sort S&P 500 stocks (click link to choose) by Daily, Weekly and by Year-to-Date performances. Also, one can sort by size of the company or by market capitalization. |
| Select Your Default Chart Type: | |||||
| |||||
| Click on stock symbol or name for detailed view. Click on to add stock symbol to your watchlist and to view watchlist. Quick View: Move mouse or cursor over "Daily" to quickly view daily technical stock chart and over "Weekly" to view weekly technical stock chart. | |||||

 | ZBH Zimmer Biomet Holdings, Inc. |
| Sector: Health Care | |
| SubSector: Medical Appliances & Equipment | |
| MarketCap: 19339.4 Millions | |
| Recent Price: 120.42 Smart Investing & Trading Score: 0 | |
| Day Percent Change: -0.73% Day Change: -0.88 | |
| Week Change: -3.26% Year-to-date Change: -1.1% | |
| ZBH Links: Profile News Message Board | |
| Charts:- Daily , Weekly | |
| Add ZBH to Watchlist: View: Get ZBH Trend Analysis ➞ | |
 | CBOE Cboe Global Markets, Inc. |
| Sector: Financials | |
| SubSector: Diversified Investments | |
| MarketCap: 8834.5 Millions | |
| Recent Price: 176.63 Smart Investing & Trading Score: 25 | |
| Day Percent Change: -0.05% Day Change: -0.09 | |
| Week Change: -1.05% Year-to-date Change: -1.1% | |
| CBOE Links: Profile News Message Board | |
| Charts:- Daily , Weekly | |
| Add CBOE to Watchlist: View: Get CBOE Trend Analysis ➞ | |
 | ED Consolidated Edison, Inc. |
| Sector: Utilities | |
| SubSector: Electric Utilities | |
| MarketCap: 25012.3 Millions | |
| Recent Price: 89.78 Smart Investing & Trading Score: 45 | |
| Day Percent Change: -0.60% Day Change: -0.55 | |
| Week Change: 1.3% Year-to-date Change: -1.3% | |
| ED Links: Profile News Message Board | |
| Charts:- Daily , Weekly | |
| Add ED to Watchlist: View: Get ED Trend Analysis ➞ | |
 | NWSA News Corporation |
| Sector: Services & Goods | |
| SubSector: Broadcasting - TV | |
| MarketCap: 5857.53 Millions | |
| Recent Price: 24.23 Smart Investing & Trading Score: 25 | |
| Day Percent Change: 0.33% Day Change: 0.08 | |
| Week Change: -0.53% Year-to-date Change: -1.3% | |
| NWSA Links: Profile News Message Board | |
| Charts:- Daily , Weekly | |
| Add NWSA to Watchlist: View: Get NWSA Trend Analysis ➞ | |
 | CSGP CoStar Group, Inc. |
| Sector: Financials | |
| SubSector: Property Management | |
| MarketCap: 21454.4 Millions | |
| Recent Price: 86.19 Smart Investing & Trading Score: 36 | |
| Day Percent Change: 0.86% Day Change: 0.73 | |
| Week Change: -4.59% Year-to-date Change: -1.4% | |
| CSGP Links: Profile News Message Board | |
| Charts:- Daily , Weekly | |
| Add CSGP to Watchlist: View: Get CSGP Trend Analysis ➞ | |
 | RF Regions Financial Corporation |
| Sector: Financials | |
| SubSector: Regional - Southeast Banks | |
| MarketCap: 8936.25 Millions | |
| Recent Price: 19.10 Smart Investing & Trading Score: 61 | |
| Day Percent Change: 1.27% Day Change: 0.24 | |
| Week Change: -0.47% Year-to-date Change: -1.4% | |
| RF Links: Profile News Message Board | |
| Charts:- Daily , Weekly | |
| Add RF to Watchlist: View: Get RF Trend Analysis ➞ | |
 | ATO Atmos Energy Corporation |
| Sector: Utilities | |
| SubSector: Gas Utilities | |
| MarketCap: 11449 Millions | |
| Recent Price: 114.18 Smart Investing & Trading Score: 55 | |
| Day Percent Change: -0.33% Day Change: -0.38 | |
| Week Change: 0.17% Year-to-date Change: -1.5% | |
| ATO Links: Profile News Message Board | |
| Charts:- Daily , Weekly | |
| Add ATO to Watchlist: View: Get ATO Trend Analysis ➞ | |
 | BBY Best Buy Co., Inc. |
| Sector: Services & Goods | |
| SubSector: Electronics Stores | |
| MarketCap: 15771.3 Millions | |
| Recent Price: 77.12 Smart Investing & Trading Score: 63 | |
| Day Percent Change: 1.17% Day Change: 0.89 | |
| Week Change: -1.13% Year-to-date Change: -1.5% | |
| BBY Links: Profile News Message Board | |
| Charts:- Daily , Weekly | |
| Add BBY to Watchlist: View: Get BBY Trend Analysis ➞ | |
 | HSY The Hershey Company |
| Sector: Consumer Staples | |
| SubSector: Confectioners | |
| MarketCap: 27648.8 Millions | |
| Recent Price: 183.33 Smart Investing & Trading Score: 28 | |
| Day Percent Change: 0.48% Day Change: 0.88 | |
| Week Change: -1.33% Year-to-date Change: -1.7% | |
| HSY Links: Profile News Message Board | |
| Charts:- Daily , Weekly | |
| Add HSY to Watchlist: View: Get HSY Trend Analysis ➞ | |
 | AFL Aflac Incorporated |
| Sector: Financials | |
| SubSector: Accident & Health Insurance | |
| MarketCap: 22706 Millions | |
| Recent Price: 81.04 Smart Investing & Trading Score: 32 | |
| Day Percent Change: 0.97% Day Change: 0.78 | |
| Week Change: 0.95% Year-to-date Change: -1.8% | |
| AFL Links: Profile News Message Board | |
| Charts:- Daily , Weekly | |
| Add AFL to Watchlist: View: Get AFL Trend Analysis ➞ | |
 | INTU Intuit Inc. |
| Sector: Technology | |
| SubSector: Application Software | |
| MarketCap: 577035 Millions | |
| Recent Price: 613.79 Smart Investing & Trading Score: 18 | |
| Day Percent Change: 0.10% Day Change: 0.58 | |
| Week Change: -1.18% Year-to-date Change: -1.8% | |
| INTU Links: Profile News Message Board | |
| Charts:- Daily , Weekly | |
| Add INTU to Watchlist: View: Get INTU Trend Analysis ➞ | |
 | BKNG Booking Holdings Inc. |
| Sector: Services & Goods | |
| SubSector: Business Services | |
| MarketCap: 54467.9 Millions | |
| Recent Price: 3475.30 Smart Investing & Trading Score: 18 | |
| Day Percent Change: 0.91% Day Change: 31.39 | |
| Week Change: -1.6% Year-to-date Change: -2.0% | |
| BKNG Links: Profile News Message Board | |
| Charts:- Daily , Weekly | |
| Add BKNG to Watchlist: View: Get BKNG Trend Analysis ➞ | |
 | LYV Live Nation Entertainment, Inc. |
| Sector: Services & Goods | |
| SubSector: Entertainment - Diversified | |
| MarketCap: 8457.17 Millions | |
| Recent Price: 91.69 Smart Investing & Trading Score: 26 | |
| Day Percent Change: -0.14% Day Change: -0.13 | |
| Week Change: -9.25% Year-to-date Change: -2.0% | |
| LYV Links: Profile News Message Board | |
| Charts:- Daily , Weekly | |
| Add LYV to Watchlist: View: Get LYV Trend Analysis ➞ | |
 | CRL Charles River Laboratories International, Inc. |
| Sector: Health Care | |
| SubSector: Medical Laboratories & Research | |
| MarketCap: 5700.5 Millions | |
| Recent Price: 231.19 Smart Investing & Trading Score: 36 | |
| Day Percent Change: 0.48% Day Change: 1.10 | |
| Week Change: -4.2% Year-to-date Change: -2.2% | |
| CRL Links: Profile News Message Board | |
| Charts:- Daily , Weekly | |
| Add CRL to Watchlist: View: Get CRL Trend Analysis ➞ | |
 | ROL Rollins, Inc. |
| Sector: Services & Goods | |
| SubSector: Business Services | |
| MarketCap: 12827.4 Millions | |
| Recent Price: 42.67 Smart Investing & Trading Score: 10 | |
| Day Percent Change: -0.78% Day Change: -0.34 | |
| Week Change: -3.78% Year-to-date Change: -2.3% | |
| ROL Links: Profile News Message Board | |
| Charts:- Daily , Weekly | |
| Add ROL to Watchlist: View: Get ROL Trend Analysis ➞ | |
 | INVH Invitation Homes Inc. |
| Sector: Financials | |
| SubSector: Real Estate Development | |
| MarketCap: 9782.89 Millions | |
| Recent Price: 33.32 Smart Investing & Trading Score: 61 | |
| Day Percent Change: 0.76% Day Change: 0.25 | |
| Week Change: -1.77% Year-to-date Change: -2.3% | |
| INVH Links: Profile News Message Board | |
| Charts:- Daily , Weekly | |
| Add INVH to Watchlist: View: Get INVH Trend Analysis ➞ | |
 | IP International Paper Company |
| Sector: Consumer Staples | |
| SubSector: Packaging & Containers | |
| MarketCap: 13031.3 Millions | |
| Recent Price: 35.27 Smart Investing & Trading Score: 10 | |
| Day Percent Change: 0.61% Day Change: 0.21 | |
| Week Change: -5.02% Year-to-date Change: -2.4% | |
| IP Links: Profile News Message Board | |
| Charts:- Daily , Weekly | |
| Add IP to Watchlist: View: Get IP Trend Analysis ➞ | |
 | PPL PPL Corporation |
| Sector: Utilities | |
| SubSector: Electric Utilities | |
| MarketCap: 16588.8 Millions | |
| Recent Price: 26.41 Smart Investing & Trading Score: 61 | |
| Day Percent Change: -0.04% Day Change: -0.01 | |
| Week Change: -0.83% Year-to-date Change: -2.6% | |
| PPL Links: Profile News Message Board | |
| Charts:- Daily , Weekly | |
| Add PPL to Watchlist: View: Get PPL Trend Analysis ➞ | |
 | MS Morgan Stanley |
| Sector: Financials | |
| SubSector: Investment Brokerage - National | |
| MarketCap: 55876.7 Millions | |
| Recent Price: 90.79 Smart Investing & Trading Score: 73 | |
| Day Percent Change: 0.79% Day Change: 0.71 | |
| Week Change: 5.34% Year-to-date Change: -2.6% | |
| MS Links: Profile News Message Board | |
| Charts:- Daily , Weekly | |
| Add MS to Watchlist: View: Get MS Trend Analysis ➞ | |
 | DUK Duke Energy Corporation |
| Sector: Utilities | |
| SubSector: Electric Utilities | |
| MarketCap: 56678.2 Millions | |
| Recent Price: 94.41 Smart Investing & Trading Score: 35 | |
| Day Percent Change: -0.10% Day Change: -0.09 | |
| Week Change: -0.52% Year-to-date Change: -2.7% | |
| DUK Links: Profile News Message Board | |
| Charts:- Daily , Weekly | |
| Add DUK to Watchlist: View: Get DUK Trend Analysis ➞ | |
 | AVB AvalonBay Communities, Inc. |
| Sector: Financials | |
| SubSector: REIT - Residential | |
| MarketCap: 19921.9 Millions | |
| Recent Price: 182.09 Smart Investing & Trading Score: 61 | |
| Day Percent Change: 0.63% Day Change: 1.14 | |
| Week Change: -0.92% Year-to-date Change: -2.7% | |
| AVB Links: Profile News Message Board | |
| Charts:- Daily , Weekly | |
| Add AVB to Watchlist: View: Get AVB Trend Analysis ➞ | |
 | GPN Global Payments Inc. |
| Sector: Services & Goods | |
| SubSector: Business Services | |
| MarketCap: 39068.8 Millions | |
| Recent Price: 123.45 Smart Investing & Trading Score: 18 | |
| Day Percent Change: 0.41% Day Change: 0.50 | |
| Week Change: -0.23% Year-to-date Change: -2.8% | |
| GPN Links: Profile News Message Board | |
| Charts:- Daily , Weekly | |
| Add GPN to Watchlist: View: Get GPN Trend Analysis ➞ | |
 | NOC Northrop Grumman Corporation |
| Sector: Industrials | |
| SubSector: Aerospace/Defense - Major Diversified | |
| MarketCap: 52094.9 Millions | |
| Recent Price: 454.68 Smart Investing & Trading Score: 61 | |
| Day Percent Change: 0.58% Day Change: 2.63 | |
| Week Change: -0.31% Year-to-date Change: -2.9% | |
| NOC Links: Profile News Message Board | |
| Charts:- Daily , Weekly | |
| Add NOC to Watchlist: View: Get NOC Trend Analysis ➞ | |
 | QRVO Qorvo, Inc. |
| Sector: Technology | |
| SubSector: Semiconductor - Broad Line | |
| MarketCap: 9524.32 Millions | |
| Recent Price: 109.36 Smart Investing & Trading Score: 39 | |
| Day Percent Change: -0.54% Day Change: -0.59 | |
| Week Change: -1.8% Year-to-date Change: -2.9% | |
| QRVO Links: Profile News Message Board | |
| Charts:- Daily , Weekly | |
| Add QRVO to Watchlist: View: Get QRVO Trend Analysis ➞ | |
 | MCO Moody s Corporation |
| Sector: Services & Goods | |
| SubSector: Business Services | |
| MarketCap: 35998.5 Millions | |
| Recent Price: 379.15 Smart Investing & Trading Score: 32 | |
| Day Percent Change: 1.00% Day Change: 3.74 | |
| Week Change: 0.53% Year-to-date Change: -2.9% | |
| MCO Links: Profile News Message Board | |
| Charts:- Daily , Weekly | |
| Add MCO to Watchlist: View: Get MCO Trend Analysis ➞ | |
| For tabular summary view of above stock list: Summary View ➞ 0 - 25 , 25 - 50 , 50 - 75 , 75 - 100 , 100 - 125 , 125 - 150 , 150 - 175 , 175 - 200 , 200 - 225 , 225 - 250 , 250 - 275 , 275 - 300 , 300 - 325 , 325 - 350 , 350 - 375 , 375 - 400 , 400 - 425 , 425 - 450 , 450 - 475 | ||
| Click To Change The Sort Order: By Market Cap or Company Size Performance: Year-to-date, Week and Day | |
| Select Chart Type: | ||
|
Best Stocks Today 12Stocks.com |
© 2024 12Stocks.com Terms & Conditions Privacy Contact Us
All Information Provided Only For Education And Not To Be Used For Investing or Trading. See Terms & Conditions


One More Thing ... Get Best Stocks Delivered Daily!
Never Ever Miss A Move With Our Top Ten Stocks Lists
Find Best Stocks In Any Market - Bull or Bear Market
Take A Peek At Our Top Ten Stocks Lists: Daily, Weekly, Year-to-Date & Top Trends
Find Best Stocks In Any Market - Bull or Bear Market
Take A Peek At Our Top Ten Stocks Lists: Daily, Weekly, Year-to-Date & Top Trends
S&P 500 Stocks With Best Up Trends [0-bearish to 100-bullish]: Genuine Parts[100], United Airlines[100], Generac Holdings[93], Delta Air[93], Charles Schwab[93], Bunge [93], Lockheed Martin[93], Wells Fargo[90], Google [90], Google [90], Freeport-McMoRan [88]
Best S&P 500 Stocks Year-to-Date:
NVIDIA [72.44%], Constellation [59.78%], Meta Platforms[44.17%], NRG [40.48%], Micron [35.16%], Western Digital[34.81%], Marathon [33.15%], Progressive [31.69%], Eaton [30.68%], Diamondback [29.89%], Targa Resources[29.2%] Best S&P 500 Stocks This Week:
United Airlines[21.81%], UnitedHealth [13.06%], Genuine Parts[10.85%], American Airlines[7.91%], Southwest Airlines[6.57%], Morgan Stanley[5.34%], Charles Schwab[4.84%], Norwegian Cruise[4.7%], ProShares UltraPro[4.68%], Centene [4.64%], Humana [4.57%] Best S&P 500 Stocks Daily:
Genuine Parts[11.86%], United Airlines[4.46%], Capital One[4.24%], Discover Financial[3.95%], Fair Isaac[3.70%], UnitedHealth [3.67%], Marsh & McLennan[3.63%], Allstate [3.62%], Builders FirstSource[3.39%], Synchrony Financial[3.35%], D.R. Horton[3.31%]