
 Login Sign Up


| |||||
 |  | ||||

| 12Stocks.com Market Intelligence |
Best S&P 500 Stocks
|
On this page, you will find the most comprehensive analysis of S&P 500 stocks and ETFs - from latest trends to performances to charts ➞. First, here are the year-to-date (YTD) performances of the most requested S&P 500 stocks at 12Stocks.com (click stock for review):
| NVIDIA 61% | ||
| Caterpillar 21% | ||
| Amazon.com 17% | ||
| Merck 16% | ||
| Walmart 14% | ||
| Google 12% | ||
| JPMorgan Chase 11% | ||
| Chevron 9% | ||
| Goldman Sachs 8% | ||
| Microsoft 7% | ||
| Johnson & Johnson -5% | ||
| McDonald s -7% | ||
| Starbucks -8% | ||
| Apple -14% | ||
| Gilead -17% | ||
| Intel -32% | ||
| Boeing -35% | ||
| Quick: S&P 500 Stocks Lists: Performances & Trends, S&P 500 Stock Charts
Sort S&P 500 stocks: Daily, Weekly, Year-to-Date, Market Cap & Trends. Filter S&P 500 stocks list by sector: Show all, Tech, Finance, Energy, Staples, Retail, Industrial, Materials, Utilities and HealthCare |
| 12Stocks.com S&P 500 Stocks Performances & Trends Daily Report | |||||||||
|
| 
The overall Smart Investing & Trading Score is 51 (0-bearish to 100-bullish) which puts S&P 500 index in short term neutral trend. The Smart Investing & Trading Score from previous trading session is 26 and hence an improvement of trend. | ||||||||
Here are the Smart Investing & Trading Scores of the most requested S&P 500 stocks at 12Stocks.com (click stock name for detailed review):
|


| 12Stocks.com: Top Performing S&P 500 Index Stocks | ||||||||||||||||||||||||||||||||||||||||||||||||
 The top performing S&P 500 Index stocks year to date are
Now, more recently, over last week, the top performing S&P 500 Index stocks on the move are


|
||||||||||||||||||||||||||||||||||||||||||||||||
| 12Stocks.com: Investing in S&P 500 Index with Stocks | |
|
The following table helps investors and traders sort through current performance and trends (as measured by Smart Investing & Trading Score) of various
stocks in the S&P 500 Index. Quick View: Move mouse or cursor over stock symbol (ticker) to view short-term technical chart and over stock name to view long term chart. Click on  to add stock symbol to your watchlist and to add stock symbol to your watchlist and  to view watchlist. Click on any ticker or stock name for detailed market intelligence report for that stock. to view watchlist. Click on any ticker or stock name for detailed market intelligence report for that stock. |
12Stocks.com Performance of Stocks in S&P 500 Index
| Ticker | Stock Name | Watchlist | Category | Recent Price | Smart Investing & Trading Score | Change % | YTD Change% |
| MTB | M&T Bank |   | Financials | 145.68 | 100 | 1.60% | 6.27% |
| MHK | Mohawk Industries | | Consumer Staples | 109.95 | 63 | 0.98% | 6.23% |
| ETR | Entergy | | Utilities | 107.45 | 100 | 0.64% | 6.19% |
| KMB | Kimberly-Clark | | Consumer Staples | 128.93 | 100 | 1.66% | 6.11% |
| DXCM | DexCom | | Health Care | 131.52 | 46 | 0.62% | 5.99% |
| FITB | Fifth Third | | Financials | 36.55 | 100 | 0.83% | 5.97% |
| IEX | IDEX | | Industrials | 229.89 | 63 | 1.26% | 5.89% |
| FOXA | Fox | | Services & Goods | 31.40 | 74 | 0.03% | 5.83% |
| LYB | LyondellBasell Industries | | Materials | 100.59 | 63 | -0.15% | 5.80% |
| AAL | American Airlines | | Transports | 14.53 | 95 | 2.98% | 5.75% |
| SYY | Sysco | | Consumer Staples | 77.32 | 54 | 0.77% | 5.73% |
| ADP | Automatic Data | | Technology | 246.31 | 80 | 1.23% | 5.73% |
| HII | Huntington Ingalls | | Industrials | 274.49 | 58 | 1.04% | 5.72% |
| UHS | Universal Health | | Health Care | 161.13 | 51 | 2.32% | 5.70% |
| F | Ford Motor | | Consumer Staples | 12.88 | 80 | 6.10% | 5.66% |
| AJG | Arthur J. | | Financials | 237.52 | 65 | 0.40% | 5.62% |
| MO | Altria | | Consumer Staples | 42.57 | 95 | 1.14% | 5.53% |
| TAP | Molson Coors | | Consumer Staples | 64.52 | 58 | 0.45% | 5.41% |
| AOS | A. O. | | Industrials | 86.90 | 70 | 0.96% | 5.41% |
| MAR | Marriott | | Services & Goods | 237.41 | 18 | 0.60% | 5.28% |
| NDAQ | Nasdaq | | Financials | 61.20 | 68 | 1.41% | 5.26% |
| SPY | SPDR S&P | | Utilities | 499.72 | 51 | 0.92% | 5.14% |
| NI | NiSource | | Utilities | 27.91 | 100 | 1.20% | 5.12% |
| DG | Dollar General | | Services & Goods | 142.85 | 46 | -1.36% | 5.08% |
| MRNA | Moderna | | Health Care | 104.46 | 83 | 2.98% | 5.04% |
| For chart view version of above stock list: Chart View ➞ 0 - 25 , 25 - 50 , 50 - 75 , 75 - 100 , 100 - 125 , 125 - 150 , 150 - 175 , 175 - 200 , 200 - 225 , 225 - 250 , 250 - 275 , 275 - 300 , 300 - 325 , 325 - 350 , 350 - 375 , 375 - 400 , 400 - 425 , 425 - 450 , 450 - 475 , 475 - 500 | ||
 | Click To Change The Sort Order: By Market Cap or Company Size Performance: Year-to-date, Week and Day |  |
|
Get the most comprehensive stock market coverage daily at 12Stocks.com ➞ Best Stocks Today ➞ Best Stocks Weekly ➞ Best Stocks Year-to-Date ➞ Best Stocks Trends ➞  Best Stocks Today 12Stocks.com Best Nasdaq Stocks ➞ Best S&P 500 Stocks ➞ Best Tech Stocks ➞ Best Biotech Stocks ➞ |
| Detailed Overview of S&P 500 Stocks |
| S&P 500 Technical Overview, Leaders & Laggards, Top S&P 500 ETF Funds & Detailed S&P 500 Stocks List, Charts, Trends & More |
| S&P 500: Technical Analysis, Trends & YTD Performance | |
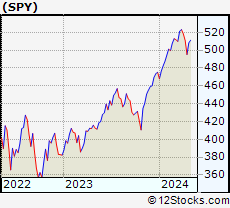
| S&P 500 index as represented by
SPY, an exchange-traded fund [ETF], holds basket of five hundred (mostly largecap) stocks from across all major sectors of the US stock market. The S&P 500 index (contains stocks like Apple and Exxon) is up by 5.14% and is currently outperforming the overall market by 0.75% year-to-date. Below is a quick view of technical charts and trends: | |
 SPY Weekly Chart |
|
| Long Term Trend: Good | |
| Medium Term Trend: Not Good | |
 SPY Daily Chart |
|
| Short Term Trend: Deteriorating | |
| Overall Trend Score: 51 | |
| YTD Performance: 5.14% | |
| **Trend Scores & Views Are Only For Educational Purposes And Not For Investing | |
| 12Stocks.com: Investing in S&P 500 Index using Exchange Traded Funds | |
|
The following table shows list of key exchange traded funds (ETF) that
help investors track S&P 500 index. The following list also includes leveraged ETF funds that track twice or thrice the daily returns of S&P 500 indices. Short or inverse ETF funds move in the opposite direction to the index they track and are useful during market pullbacks or during bear markets. Quick View: Move mouse or cursor over ETF symbol (ticker) to view short-term technical chart and over ETF name to view long term chart. Click on ticker or stock name for detailed view. Click on to add stock symbol to your watchlist and to view watchlist. |
12Stocks.com List of ETFs that track S&P 500 Index
| Ticker | ETF Name | Watchlist | Recent Price | Smart Investing & Trading Score | Change % | Week % | Year-to-date % |
| SPY | SPDR S&P 500 ETF | | 499.72 | 51 | 0.92 | 0.92 | 5.14% |
| IVV | iShares Core S&P 500 ETF | | 498.19 | 36 | 0.13 | 0.13 | 4.3% |
| VOO | Vanguard 500 ETF | | 455.61 | 36 | 0.11 | 0.11 | 4.31% |
| OEF | iShares S&P 100 | | 236.81 | 51 | 0.91 | 0.91 | 6.01% |
| SSO | ProShares Ultra S&P500 | | 70.33 | 51 | 1.77 | 1.77 | 8.08% |
| UPRO | ProShares UltraPro S&P500 | | 60.75 | 43 | 2.69 | 2.69 | 10.98% |
| SPXL | Direxion Daily S&P500 Bull 3X ETF | | 115.45 | 43 | 2.58 | 2.58 | 11.02% |
| SH | ProShares Short S&P500 | | 12.49 | 50 | -0.79 | -0.79 | -3.85% |
| SDS | ProShares UltraShort S&P500 | | 27.41 | 50 | -1.76 | -1.76 | -8.39% |
| SPXU | ProShares UltraPro Short S&P500 | | 37.34 | 50 | -2.58 | -2.58 | -13.16% |
| SPXS | Direxion Daily S&P 500 Bear 3X ETF | | 10.31 | 64 | -0.48 | -0.48 | -10.74% |
| 12Stocks.com: Charts, Trends, Fundamental Data and Performances of S&P 500 Stocks | |
|
We now take in-depth look at all S&P 500 stocks including charts, multi-period performances and overall trends (as measured by Smart Investing & Trading Score). One can sort S&P 500 stocks (click link to choose) by Daily, Weekly and by Year-to-Date performances. Also, one can sort by size of the company or by market capitalization. |
| Select Your Default Chart Type: | |||||
| |||||
| Click on stock symbol or name for detailed view. Click on to add stock symbol to your watchlist and to view watchlist. Quick View: Move mouse or cursor over "Daily" to quickly view daily technical stock chart and over "Weekly" to view weekly technical stock chart. | |||||
 | MTB M&T Bank Corporation |
| Sector: Financials | |
| SubSector: Regional - Northeast Banks | |
| MarketCap: 13950.9 Millions | |
| Recent Price: 145.68 Smart Investing & Trading Score: 100 | |
| Day Percent Change: 1.60% Day Change: 2.30 | |
| Week Change: 1.6% Year-to-date Change: 6.3% | |
| MTB Links: Profile News Message Board | |
| Charts:- Daily , Weekly | |
| Add MTB to Watchlist: View: Get MTB Trend Analysis ➞ | |
 | MHK Mohawk Industries, Inc. |
| Sector: Consumer Staples | |
| SubSector: Home Furnishings & Fixtures | |
| MarketCap: 4682.25 Millions | |
| Recent Price: 109.95 Smart Investing & Trading Score: 63 | |
| Day Percent Change: 0.98% Day Change: 1.07 | |
| Week Change: 0.98% Year-to-date Change: 6.2% | |
| MHK Links: Profile News Message Board | |
| Charts:- Daily , Weekly | |
| Add MHK to Watchlist: View: Get MHK Trend Analysis ➞ | |
 | ETR Entergy Corporation |
| Sector: Utilities | |
| SubSector: Electric Utilities | |
| MarketCap: 17545 Millions | |
| Recent Price: 107.45 Smart Investing & Trading Score: 100 | |
| Day Percent Change: 0.64% Day Change: 0.68 | |
| Week Change: 0.64% Year-to-date Change: 6.2% | |
| ETR Links: Profile News Message Board | |
| Charts:- Daily , Weekly | |
| Add ETR to Watchlist: View: Get ETR Trend Analysis ➞ | |
 | KMB Kimberly-Clark Corporation |
| Sector: Consumer Staples | |
| SubSector: Personal Products | |
| MarketCap: 44300.5 Millions | |
| Recent Price: 128.93 Smart Investing & Trading Score: 100 | |
| Day Percent Change: 1.66% Day Change: 2.10 | |
| Week Change: 1.66% Year-to-date Change: 6.1% | |
| KMB Links: Profile News Message Board | |
| Charts:- Daily , Weekly | |
| Add KMB to Watchlist: View: Get KMB Trend Analysis ➞ | |
 | DXCM DexCom, Inc. |
| Sector: Health Care | |
| SubSector: Medical Laboratories & Research | |
| MarketCap: 19559 Millions | |
| Recent Price: 131.52 Smart Investing & Trading Score: 46 | |
| Day Percent Change: 0.62% Day Change: 0.81 | |
| Week Change: 0.62% Year-to-date Change: 6.0% | |
| DXCM Links: Profile News Message Board | |
| Charts:- Daily , Weekly | |
| Add DXCM to Watchlist: View: Get DXCM Trend Analysis ➞ | |
 | FITB Fifth Third Bancorp |
| Sector: Financials | |
| SubSector: Regional - Midwest Banks | |
| MarketCap: 10197 Millions | |
| Recent Price: 36.55 Smart Investing & Trading Score: 100 | |
| Day Percent Change: 0.83% Day Change: 0.30 | |
| Week Change: 0.83% Year-to-date Change: 6.0% | |
| FITB Links: Profile News Message Board | |
| Charts:- Daily , Weekly | |
| Add FITB to Watchlist: View: Get FITB Trend Analysis ➞ | |
 | IEX IDEX Corporation |
| Sector: Industrials | |
| SubSector: Diversified Machinery | |
| MarketCap: 9721.46 Millions | |
| Recent Price: 229.89 Smart Investing & Trading Score: 63 | |
| Day Percent Change: 1.26% Day Change: 2.85 | |
| Week Change: 1.26% Year-to-date Change: 5.9% | |
| IEX Links: Profile News Message Board | |
| Charts:- Daily , Weekly | |
| Add IEX to Watchlist: View: Get IEX Trend Analysis ➞ | |
 | FOXA Fox Corporation |
| Sector: Services & Goods | |
| SubSector: Entertainment - Diversified | |
| MarketCap: 13440.7 Millions | |
| Recent Price: 31.40 Smart Investing & Trading Score: 74 | |
| Day Percent Change: 0.03% Day Change: 0.01 | |
| Week Change: 0.03% Year-to-date Change: 5.8% | |
| FOXA Links: Profile News Message Board | |
| Charts:- Daily , Weekly | |
| Add FOXA to Watchlist: View: Get FOXA Trend Analysis ➞ | |
 | LYB LyondellBasell Industries N.V. |
| Sector: Materials | |
| SubSector: Specialty Chemicals | |
| MarketCap: 16420.7 Millions | |
| Recent Price: 100.59 Smart Investing & Trading Score: 63 | |
| Day Percent Change: -0.15% Day Change: -0.15 | |
| Week Change: -0.15% Year-to-date Change: 5.8% | |
| LYB Links: Profile News Message Board | |
| Charts:- Daily , Weekly | |
| Add LYB to Watchlist: View: Get LYB Trend Analysis ➞ | |
 | AAL American Airlines Group Inc. |
| Sector: Transports | |
| SubSector: Major Airlines | |
| MarketCap: 5346.45 Millions | |
| Recent Price: 14.53 Smart Investing & Trading Score: 95 | |
| Day Percent Change: 2.98% Day Change: 0.42 | |
| Week Change: 2.98% Year-to-date Change: 5.8% | |
| AAL Links: Profile News Message Board | |
| Charts:- Daily , Weekly | |
| Add AAL to Watchlist: View: Get AAL Trend Analysis ➞ | |
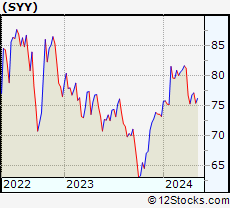 | SYY Sysco Corporation |
| Sector: Consumer Staples | |
| SubSector: Food Wholesale | |
| MarketCap: 22771.9 Millions | |
| Recent Price: 77.32 Smart Investing & Trading Score: 54 | |
| Day Percent Change: 0.77% Day Change: 0.59 | |
| Week Change: 0.77% Year-to-date Change: 5.7% | |
| SYY Links: Profile News Message Board | |
| Charts:- Daily , Weekly | |
| Add SYY to Watchlist: View: Get SYY Trend Analysis ➞ | |
 | ADP Automatic Data Processing, Inc. |
| Sector: Technology | |
| SubSector: Business Software & Services | |
| MarketCap: 54966.5 Millions | |
| Recent Price: 246.31 Smart Investing & Trading Score: 80 | |
| Day Percent Change: 1.23% Day Change: 3.00 | |
| Week Change: 1.23% Year-to-date Change: 5.7% | |
| ADP Links: Profile News Message Board | |
| Charts:- Daily , Weekly | |
| Add ADP to Watchlist: View: Get ADP Trend Analysis ➞ | |
 | HII Huntington Ingalls Industries, Inc. |
| Sector: Industrials | |
| SubSector: Aerospace/Defense Products & Services | |
| MarketCap: 7276.11 Millions | |
| Recent Price: 274.49 Smart Investing & Trading Score: 58 | |
| Day Percent Change: 1.04% Day Change: 2.83 | |
| Week Change: 1.04% Year-to-date Change: 5.7% | |
| HII Links: Profile News Message Board | |
| Charts:- Daily , Weekly | |
| Add HII to Watchlist: View: Get HII Trend Analysis ➞ | |
 | UHS Universal Health Services, Inc. |
| Sector: Health Care | |
| SubSector: Hospitals | |
| MarketCap: 7217.66 Millions | |
| Recent Price: 161.13 Smart Investing & Trading Score: 51 | |
| Day Percent Change: 2.32% Day Change: 3.66 | |
| Week Change: 2.32% Year-to-date Change: 5.7% | |
| UHS Links: Profile News Message Board | |
| Charts:- Daily , Weekly | |
| Add UHS to Watchlist: View: Get UHS Trend Analysis ➞ | |
 | F Ford Motor Company |
| Sector: Consumer Staples | |
| SubSector: Auto Manufacturers - Major | |
| MarketCap: 19052.1 Millions | |
| Recent Price: 12.88 Smart Investing & Trading Score: 80 | |
| Day Percent Change: 6.10% Day Change: 0.74 | |
| Week Change: 6.1% Year-to-date Change: 5.7% | |
| F Links: Profile News Message Board | |
| Charts:- Daily , Weekly | |
| Add F to Watchlist: View: Get F Trend Analysis ➞ | |
 | AJG Arthur J. Gallagher & Co. |
| Sector: Financials | |
| SubSector: Insurance Brokers | |
| MarketCap: 14852.2 Millions | |
| Recent Price: 237.52 Smart Investing & Trading Score: 65 | |
| Day Percent Change: 0.40% Day Change: 0.95 | |
| Week Change: 0.4% Year-to-date Change: 5.6% | |
| AJG Links: Profile News Message Board | |
| Charts:- Daily , Weekly | |
| Add AJG to Watchlist: View: Get AJG Trend Analysis ➞ | |
 | MO Altria Group, Inc. |
| Sector: Consumer Staples | |
| SubSector: Cigarettes | |
| MarketCap: 70806.3 Millions | |
| Recent Price: 42.57 Smart Investing & Trading Score: 95 | |
| Day Percent Change: 1.14% Day Change: 0.48 | |
| Week Change: 1.14% Year-to-date Change: 5.5% | |
| MO Links: Profile News Message Board | |
| Charts:- Daily , Weekly | |
| Add MO to Watchlist: View: Get MO Trend Analysis ➞ | |
 | TAP Molson Coors Beverage Company |
| Sector: Consumer Staples | |
| SubSector: Beverages - Brewers | |
| MarketCap: 8619.97 Millions | |
| Recent Price: 64.52 Smart Investing & Trading Score: 58 | |
| Day Percent Change: 0.45% Day Change: 0.29 | |
| Week Change: 0.45% Year-to-date Change: 5.4% | |
| TAP Links: Profile News Message Board | |
| Charts:- Daily , Weekly | |
| Add TAP to Watchlist: View: Get TAP Trend Analysis ➞ | |
 | AOS A. O. Smith Corporation |
| Sector: Industrials | |
| SubSector: Industrial Electrical Equipment | |
| MarketCap: 5809.89 Millions | |
| Recent Price: 86.90 Smart Investing & Trading Score: 70 | |
| Day Percent Change: 0.96% Day Change: 0.83 | |
| Week Change: 0.96% Year-to-date Change: 5.4% | |
| AOS Links: Profile News Message Board | |
| Charts:- Daily , Weekly | |
| Add AOS to Watchlist: View: Get AOS Trend Analysis ➞ | |
 | MAR Marriott International, Inc. |
| Sector: Services & Goods | |
| SubSector: Lodging | |
| MarketCap: 25831.6 Millions | |
| Recent Price: 237.41 Smart Investing & Trading Score: 18 | |
| Day Percent Change: 0.60% Day Change: 1.41 | |
| Week Change: 0.6% Year-to-date Change: 5.3% | |
| MAR Links: Profile News Message Board | |
| Charts:- Daily , Weekly | |
| Add MAR to Watchlist: View: Get MAR Trend Analysis ➞ | |
 | NDAQ Nasdaq, Inc. |
| Sector: Financials | |
| SubSector: Diversified Investments | |
| MarketCap: 14885.2 Millions | |
| Recent Price: 61.20 Smart Investing & Trading Score: 68 | |
| Day Percent Change: 1.41% Day Change: 0.85 | |
| Week Change: 1.41% Year-to-date Change: 5.3% | |
| NDAQ Links: Profile News Message Board | |
| Charts:- Daily , Weekly | |
| Add NDAQ to Watchlist: View: Get NDAQ Trend Analysis ➞ | |
 | SPY SPDR S&P 500 ETF |
| Sector: Utilities | |
| SubSector: Exchange Traded Fund | |
| MarketCap: 0 Millions | |
| Recent Price: 499.72 Smart Investing & Trading Score: 51 | |
| Day Percent Change: 0.92% Day Change: 4.56 | |
| Week Change: 0.92% Year-to-date Change: 5.1% | |
| SPY Links: Profile News Message Board | |
| Charts:- Daily , Weekly | |
| Add SPY to Watchlist: View: Get SPY Trend Analysis ➞ | |
 | NI NiSource Inc. |
| Sector: Utilities | |
| SubSector: Diversified Utilities | |
| MarketCap: 9056.8 Millions | |
| Recent Price: 27.91 Smart Investing & Trading Score: 100 | |
| Day Percent Change: 1.20% Day Change: 0.33 | |
| Week Change: 1.2% Year-to-date Change: 5.1% | |
| NI Links: Profile News Message Board | |
| Charts:- Daily , Weekly | |
| Add NI to Watchlist: View: Get NI Trend Analysis ➞ | |
 | DG Dollar General Corporation |
| Sector: Services & Goods | |
| SubSector: Discount, Variety Stores | |
| MarketCap: 39611.9 Millions | |
| Recent Price: 142.85 Smart Investing & Trading Score: 46 | |
| Day Percent Change: -1.36% Day Change: -1.97 | |
| Week Change: -1.36% Year-to-date Change: 5.1% | |
| DG Links: Profile News Message Board | |
| Charts:- Daily , Weekly | |
| Add DG to Watchlist: View: Get DG Trend Analysis ➞ | |
 | MRNA Moderna, Inc. |
| Sector: Health Care | |
| SubSector: Biotechnology | |
| MarketCap: 11006.4 Millions | |
| Recent Price: 104.46 Smart Investing & Trading Score: 83 | |
| Day Percent Change: 2.98% Day Change: 3.02 | |
| Week Change: 2.98% Year-to-date Change: 5.0% | |
| MRNA Links: Profile News Message Board | |
| Charts:- Daily , Weekly | |
| Add MRNA to Watchlist: View: Get MRNA Trend Analysis ➞ | |
| For tabular summary view of above stock list: Summary View ➞ 0 - 25 , 25 - 50 , 50 - 75 , 75 - 100 , 100 - 125 , 125 - 150 , 150 - 175 , 175 - 200 , 200 - 225 , 225 - 250 , 250 - 275 , 275 - 300 , 300 - 325 , 325 - 350 , 350 - 375 , 375 - 400 , 400 - 425 , 425 - 450 , 450 - 475 , 475 - 500 | ||
| Click To Change The Sort Order: By Market Cap or Company Size Performance: Year-to-date, Week and Day | |
| Select Chart Type: | ||
|
Best Stocks Today 12Stocks.com |
© 2024 12Stocks.com Terms & Conditions Privacy Contact Us
All Information Provided Only For Education And Not To Be Used For Investing or Trading. See Terms & Conditions


One More Thing ... Get Best Stocks Delivered Daily!
Never Ever Miss A Move With Our Top Ten Stocks Lists
Find Best Stocks In Any Market - Bull or Bear Market
Take A Peek At Our Top Ten Stocks Lists: Daily, Weekly, Year-to-Date & Top Trends
Find Best Stocks In Any Market - Bull or Bear Market
Take A Peek At Our Top Ten Stocks Lists: Daily, Weekly, Year-to-Date & Top Trends
S&P 500 Stocks With Best Up Trends [0-bearish to 100-bullish]: United Airlines[100], EQT [100], Goldman Sachs[100], Capital One[100], Campbell Soup[100], Northrop Grumman[100], UDR [100], Kimberly-Clark [100], M&T Bank[100], Dominion [100], Church & Dwight Co[100]
Best S&P 500 Stocks Year-to-Date:
NVIDIA [60.57%], Constellation [56.45%], NRG [36.15%], Meta Platforms[36.08%], Progressive [33.73%], Marathon [33.63%], Targa Resources[31.01%], United Airlines[30.73%], Diamondback [30.63%], Western Digital[28.03%], Eaton [27.93%] Best S&P 500 Stocks This Week:
Ford Motor[6.1%], United Airlines[4.98%], NVIDIA [4.35%], Enphase [3.78%], DaVita [3.68%], EQT [3.6%], Zions Ban[3.51%], Truist Financial[3.42%], Goldman Sachs[3.3%], Seagate [3.3%], Blackstone [3.12%] Best S&P 500 Stocks Daily:
Ford Motor[6.10%], United Airlines[4.98%], NVIDIA [4.35%], Enphase [3.78%], DaVita [3.68%], EQT [3.60%], Zions Ban[3.51%], Truist Financial[3.42%], Goldman Sachs[3.30%], Seagate [3.30%], Blackstone [3.12%]