
 Login Sign Up


| |||||
 |  | ||||

| 12Stocks.com Market Intelligence |
Best S&P 500 Stocks
|
On this page, you will find the most comprehensive analysis of S&P 500 stocks and ETFs - from latest trends to performances to charts ➞. First, here are the year-to-date (YTD) performances of the most requested S&P 500 stocks at 12Stocks.com (click stock for review):
| NVIDIA 61% | ||
| Caterpillar 23% | ||
| Merck 16% | ||
| Amazon.com 16% | ||
| Walmart 14% | ||
| Google 14% | ||
| JPMorgan Chase 14% | ||
| Chevron 10% | ||
| Goldman Sachs 10% | ||
| Microsoft 9% | ||
| Johnson & Johnson -5% | ||
| McDonald s -7% | ||
| Starbucks -8% | ||
| Apple -12% | ||
| Gilead -17% | ||
| Intel -31% | ||
| Boeing -37% | ||
| Quick: S&P 500 Stocks Lists: Performances & Trends, S&P 500 Stock Charts
Sort S&P 500 stocks: Daily, Weekly, Year-to-Date, Market Cap & Trends. Filter S&P 500 stocks list by sector: Show all, Tech, Finance, Energy, Staples, Retail, Industrial, Materials, Utilities and HealthCare |
| 12Stocks.com S&P 500 Stocks Performances & Trends Daily Report | |||||||||
|
| 
The overall Smart Investing & Trading Score is 58 (0-bearish to 100-bullish) which puts S&P 500 index in short term neutral trend. The Smart Investing & Trading Score from previous trading session is 51 and an improvement of trend continues. | ||||||||
Here are the Smart Investing & Trading Scores of the most requested S&P 500 stocks at 12Stocks.com (click stock name for detailed review):
|


| 12Stocks.com: Top Performing S&P 500 Index Stocks | ||||||||||||||||||||||||||||||||||||||||||||||||
 The top performing S&P 500 Index stocks year to date are
Now, more recently, over last week, the top performing S&P 500 Index stocks on the move are


|
||||||||||||||||||||||||||||||||||||||||||||||||
| 12Stocks.com: Investing in S&P 500 Index with Stocks | |
|
The following table helps investors and traders sort through current performance and trends (as measured by Smart Investing & Trading Score) of various
stocks in the S&P 500 Index. Quick View: Move mouse or cursor over stock symbol (ticker) to view short-term technical chart and over stock name to view long term chart. Click on  to add stock symbol to your watchlist and to add stock symbol to your watchlist and  to view watchlist. Click on any ticker or stock name for detailed market intelligence report for that stock. to view watchlist. Click on any ticker or stock name for detailed market intelligence report for that stock. |
12Stocks.com Performance of Stocks in S&P 500 Index
| Ticker | Stock Name | Watchlist | Category | Recent Price | Smart Investing & Trading Score | Change % | YTD Change% |
| NVDA | NVIDIA |   | Technology | 796.77 | 56 | -3.33% | 60.89% |
| CEG | Constellation | | Utilities | 186.68 | 61 | -0.84% | 59.40% |
| NRG | NRG | | Utilities | 72.61 | 76 | 1.57% | 40.44% |
| META | Meta Platforms | | Technology | 493.50 | 56 | -0.49% | 39.40% |
| TRGP | Targa Resources | | Energy | 116.90 | 90 | 0.77% | 34.57% |
| MPC | Marathon | | Energy | 199.14 | 68 | -0.26% | 34.23% |
| PGR | Progressive | | Financials | 212.20 | 51 | -0.85% | 33.22% |
| WDC | Western Digital | | Technology | 69.55 | 68 | -0.53% | 32.81% |
| ETN | Eaton | | Industrials | 318.79 | 75 | 1.90% | 32.38% |
| FANG | Diamondback | | Energy | 205.24 | 76 | 0.43% | 32.34% |
| MU | Micron | | Technology | 111.78 | 68 | -0.60% | 30.98% |
| WAB | Wabtec | | Transports | 163.38 | 100 | 10.04% | 28.75% |
| VLO | Valero | | Energy | 167.00 | 68 | -0.32% | 28.46% |
| CMG | Chipotle Mexican | | Services & Goods | 2926.76 | 76 | 0.40% | 27.98% |
| UAL | United Airlines | | Transports | 52.67 | 83 | -2.52% | 27.65% |
| AXP | American Express | | Financials | 239.12 | 100 | 0.07% | 27.64% |
| HAS | Hasbro | | Consumer Staples | 65.03 | 100 | 11.85% | 27.36% |
| DVA | DaVita | | Health Care | 132.74 | 76 | -0.87% | 26.71% |
| DIS | Walt Disney | | Services & Goods | 113.92 | 68 | 0.18% | 26.17% |
| BSX | Boston Scientific | | Health Care | 72.91 | 100 | 5.68% | 26.12% |
| LLY | Eli Lilly | | Health Care | 732.20 | 51 | -1.81% | 25.61% |
| GM | General Motors | | Consumer Staples | 45.08 | 95 | -0.04% | 25.50% |
| ACGL | Arch Capital | | Financials | 93.19 | 61 | -0.63% | 25.47% |
| GE | General Electric | | Industrials | 159.19 | 80 | -2.11% | 24.73% |
| CTLT | Catalent | | Health Care | 55.95 | 61 | -0.14% | 24.53% |
| For chart view version of above stock list: Chart View ➞ 0 - 25 , 25 - 50 , 50 - 75 , 75 - 100 , 100 - 125 , 125 - 150 , 150 - 175 , 175 - 200 , 200 - 225 , 225 - 250 , 250 - 275 , 275 - 300 , 300 - 325 , 325 - 350 , 350 - 375 , 375 - 400 , 400 - 425 , 425 - 450 , 450 - 475 , 475 - 500 | ||
 | Click To Change The Sort Order: By Market Cap or Company Size Performance: Year-to-date, Week and Day |  |
|
Get the most comprehensive stock market coverage daily at 12Stocks.com ➞ Best Stocks Today ➞ Best Stocks Weekly ➞ Best Stocks Year-to-Date ➞ Best Stocks Trends ➞  Best Stocks Today 12Stocks.com Best Nasdaq Stocks ➞ Best S&P 500 Stocks ➞ Best Tech Stocks ➞ Best Biotech Stocks ➞ |
| Detailed Overview of S&P 500 Stocks |
| S&P 500 Technical Overview, Leaders & Laggards, Top S&P 500 ETF Funds & Detailed S&P 500 Stocks List, Charts, Trends & More |
| S&P 500: Technical Analysis, Trends & YTD Performance | |
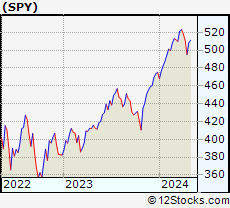
| S&P 500 index as represented by
SPY, an exchange-traded fund [ETF], holds basket of five hundred (mostly largecap) stocks from across all major sectors of the US stock market. The S&P 500 index (contains stocks like Apple and Exxon) is up by 6.33% and is currently outperforming the overall market by 0.67% year-to-date. Below is a quick view of technical charts and trends: | |
 SPY Weekly Chart |
|
| Long Term Trend: Good | |
| Medium Term Trend: Not Good | |
 SPY Daily Chart |
|
| Short Term Trend: Very Good | |
| Overall Trend Score: 58 | |
| YTD Performance: 6.33% | |
| **Trend Scores & Views Are Only For Educational Purposes And Not For Investing | |
| 12Stocks.com: Investing in S&P 500 Index using Exchange Traded Funds | |
|
The following table shows list of key exchange traded funds (ETF) that
help investors track S&P 500 index. The following list also includes leveraged ETF funds that track twice or thrice the daily returns of S&P 500 indices. Short or inverse ETF funds move in the opposite direction to the index they track and are useful during market pullbacks or during bear markets. Quick View: Move mouse or cursor over ETF symbol (ticker) to view short-term technical chart and over ETF name to view long term chart. Click on ticker or stock name for detailed view. Click on to add stock symbol to your watchlist and to view watchlist. |
12Stocks.com List of ETFs that track S&P 500 Index
| Ticker | ETF Name | Watchlist | Recent Price | Smart Investing & Trading Score | Change % | Week % | Year-to-date % |
| SPY | SPDR S&P 500 ETF | | 505.41 | 58 | -0.05 | 2.07 | 6.33% |
| IVV | iShares Core S&P 500 ETF | | 507.97 | 63 | -0.04 | 2.1 | 6.35% |
| VOO | Vanguard 500 ETF | | 464.50 | 63 | -0.07 | 2.07 | 6.34% |
| OEF | iShares S&P 100 | | 239.79 | 58 | -0.07 | 2.18 | 7.34% |
| SSO | ProShares Ultra S&P500 | | 71.95 | 58 | -0.12 | 4.11 | 10.57% |
| UPRO | ProShares UltraPro S&P500 | | 62.88 | 58 | -0.08 | 6.29 | 14.87% |
| SPXL | Direxion Daily S&P500 Bull 3X ETF | | 119.35 | 63 | -0.13 | 6.04 | 14.77% |
| SH | ProShares Short S&P500 | | 12.33 | 42 | -0.08 | -2.07 | -5.08% |
| SDS | ProShares UltraShort S&P500 | | 26.80 | 37 | 0.07 | -3.94 | -10.43% |
| SPXU | ProShares UltraPro Short S&P500 | | 36.04 | 42 | 0.14 | -5.97 | -16.19% |
| SPXS | Direxion Daily S&P 500 Bear 3X ETF | | 9.75 | 32 | 0.00 | -5.89 | -15.58% |
| 12Stocks.com: Charts, Trends, Fundamental Data and Performances of S&P 500 Stocks | |
|
We now take in-depth look at all S&P 500 stocks including charts, multi-period performances and overall trends (as measured by Smart Investing & Trading Score). One can sort S&P 500 stocks (click link to choose) by Daily, Weekly and by Year-to-Date performances. Also, one can sort by size of the company or by market capitalization. |
| Select Your Default Chart Type: | |||||
| |||||
| Click on stock symbol or name for detailed view. Click on to add stock symbol to your watchlist and to view watchlist. Quick View: Move mouse or cursor over "Daily" to quickly view daily technical stock chart and over "Weekly" to view weekly technical stock chart. | |||||

 | NVDA NVIDIA Corporation |
| Sector: Technology | |
| SubSector: Semiconductor - Specialized | |
| MarketCap: 143476 Millions | |
| Recent Price: 796.77 Smart Investing & Trading Score: 56 | |
| Day Percent Change: -3.33% Day Change: -27.46 | |
| Week Change: 4.56% Year-to-date Change: 60.9% | |
| NVDA Links: Profile News Message Board | |
| Charts:- Daily , Weekly | |
| Add NVDA to Watchlist: View: Get NVDA Trend Analysis ➞ | |
 | CEG Constellation Energy Corporation |
| Sector: Utilities | |
| SubSector: Utilities - Renewable | |
| MarketCap: 29600 Millions | |
| Recent Price: 186.68 Smart Investing & Trading Score: 61 | |
| Day Percent Change: -0.84% Day Change: -1.57 | |
| Week Change: 3.19% Year-to-date Change: 59.4% | |
| CEG Links: Profile News Message Board | |
| Charts:- Daily , Weekly | |
| Add CEG to Watchlist: View: Get CEG Trend Analysis ➞ | |
 | NRG NRG Energy, Inc. |
| Sector: Utilities | |
| SubSector: Diversified Utilities | |
| MarketCap: 6510.7 Millions | |
| Recent Price: 72.61 Smart Investing & Trading Score: 76 | |
| Day Percent Change: 1.57% Day Change: 1.12 | |
| Week Change: 3.77% Year-to-date Change: 40.4% | |
| NRG Links: Profile News Message Board | |
| Charts:- Daily , Weekly | |
| Add NRG to Watchlist: View: Get NRG Trend Analysis ➞ | |
 | META Meta Platforms, Inc. |
| Sector: Technology | |
| SubSector: Internet Content & Information | |
| MarketCap: 732990 Millions | |
| Recent Price: 493.50 Smart Investing & Trading Score: 56 | |
| Day Percent Change: -0.49% Day Change: -2.44 | |
| Week Change: 2.58% Year-to-date Change: 39.4% | |
| META Links: Profile News Message Board | |
| Charts:- Daily , Weekly | |
| Add META to Watchlist: View: Get META Trend Analysis ➞ | |
 | TRGP Targa Resources Corp. |
| Sector: Energy | |
| SubSector: Oil & Gas Pipelines | |
| MarketCap: 2210.65 Millions | |
| Recent Price: 116.90 Smart Investing & Trading Score: 90 | |
| Day Percent Change: 0.77% Day Change: 0.89 | |
| Week Change: 3.52% Year-to-date Change: 34.6% | |
| TRGP Links: Profile News Message Board | |
| Charts:- Daily , Weekly | |
| Add TRGP to Watchlist: View: Get TRGP Trend Analysis ➞ | |
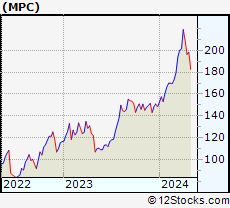 | MPC Marathon Petroleum Corporation |
| Sector: Energy | |
| SubSector: Oil & Gas Refining & Marketing | |
| MarketCap: 16862.4 Millions | |
| Recent Price: 199.14 Smart Investing & Trading Score: 68 | |
| Day Percent Change: -0.26% Day Change: -0.51 | |
| Week Change: 1.41% Year-to-date Change: 34.2% | |
| MPC Links: Profile News Message Board | |
| Charts:- Daily , Weekly | |
| Add MPC to Watchlist: View: Get MPC Trend Analysis ➞ | |
 | PGR The Progressive Corporation |
| Sector: Financials | |
| SubSector: Property & Casualty Insurance | |
| MarketCap: 43112 Millions | |
| Recent Price: 212.20 Smart Investing & Trading Score: 51 | |
| Day Percent Change: -0.85% Day Change: -1.82 | |
| Week Change: -1.16% Year-to-date Change: 33.2% | |
| PGR Links: Profile News Message Board | |
| Charts:- Daily , Weekly | |
| Add PGR to Watchlist: View: Get PGR Trend Analysis ➞ | |
 | WDC Western Digital Corporation |
| Sector: Technology | |
| SubSector: Data Storage Devices | |
| MarketCap: 10712.9 Millions | |
| Recent Price: 69.55 Smart Investing & Trading Score: 68 | |
| Day Percent Change: -0.53% Day Change: -0.37 | |
| Week Change: 5.3% Year-to-date Change: 32.8% | |
| WDC Links: Profile News Message Board | |
| Charts:- Daily , Weekly | |
| Add WDC to Watchlist: View: Get WDC Trend Analysis ➞ | |
 | ETN Eaton Corporation plc |
| Sector: Industrials | |
| SubSector: Diversified Machinery | |
| MarketCap: 29829.4 Millions | |
| Recent Price: 318.79 Smart Investing & Trading Score: 75 | |
| Day Percent Change: 1.90% Day Change: 5.95 | |
| Week Change: 5.2% Year-to-date Change: 32.4% | |
| ETN Links: Profile News Message Board | |
| Charts:- Daily , Weekly | |
| Add ETN to Watchlist: View: Get ETN Trend Analysis ➞ | |
 | FANG Diamondback Energy, Inc. |
| Sector: Energy | |
| SubSector: Independent Oil & Gas | |
| MarketCap: 3009.13 Millions | |
| Recent Price: 205.24 Smart Investing & Trading Score: 76 | |
| Day Percent Change: 0.43% Day Change: 0.87 | |
| Week Change: 2.24% Year-to-date Change: 32.3% | |
| FANG Links: Profile News Message Board | |
| Charts:- Daily , Weekly | |
| Add FANG to Watchlist: View: Get FANG Trend Analysis ➞ | |
 | MU Micron Technology, Inc. |
| Sector: Technology | |
| SubSector: Semiconductor- Memory Chips | |
| MarketCap: 45188.4 Millions | |
| Recent Price: 111.78 Smart Investing & Trading Score: 68 | |
| Day Percent Change: -0.60% Day Change: -0.68 | |
| Week Change: 4.69% Year-to-date Change: 31.0% | |
| MU Links: Profile News Message Board | |
| Charts:- Daily , Weekly | |
| Add MU to Watchlist: View: Get MU Trend Analysis ➞ | |
 | WAB Wabtec Corporation |
| Sector: Transports | |
| SubSector: Railroads | |
| MarketCap: 8230.22 Millions | |
| Recent Price: 163.38 Smart Investing & Trading Score: 100 | |
| Day Percent Change: 10.04% Day Change: 14.90 | |
| Week Change: 13.32% Year-to-date Change: 28.8% | |
| WAB Links: Profile News Message Board | |
| Charts:- Daily , Weekly | |
| Add WAB to Watchlist: View: Get WAB Trend Analysis ➞ | |
 | VLO Valero Energy Corporation |
| Sector: Energy | |
| SubSector: Oil & Gas Refining & Marketing | |
| MarketCap: 19590.5 Millions | |
| Recent Price: 167.00 Smart Investing & Trading Score: 68 | |
| Day Percent Change: -0.32% Day Change: -0.54 | |
| Week Change: 1.9% Year-to-date Change: 28.5% | |
| VLO Links: Profile News Message Board | |
| Charts:- Daily , Weekly | |
| Add VLO to Watchlist: View: Get VLO Trend Analysis ➞ | |
 | CMG Chipotle Mexican Grill, Inc. |
| Sector: Services & Goods | |
| SubSector: Restaurants | |
| MarketCap: 16849.9 Millions | |
| Recent Price: 2926.76 Smart Investing & Trading Score: 76 | |
| Day Percent Change: 0.40% Day Change: 11.76 | |
| Week Change: 2.01% Year-to-date Change: 28.0% | |
| CMG Links: Profile News Message Board | |
| Charts:- Daily , Weekly | |
| Add CMG to Watchlist: View: Get CMG Trend Analysis ➞ | |
 | UAL United Airlines Holdings, Inc. |
| Sector: Transports | |
| SubSector: Major Airlines | |
| MarketCap: 8083.25 Millions | |
| Recent Price: 52.67 Smart Investing & Trading Score: 83 | |
| Day Percent Change: -2.52% Day Change: -1.36 | |
| Week Change: 2.51% Year-to-date Change: 27.7% | |
| UAL Links: Profile News Message Board | |
| Charts:- Daily , Weekly | |
| Add UAL to Watchlist: View: Get UAL Trend Analysis ➞ | |
 | AXP American Express Company |
| Sector: Financials | |
| SubSector: Credit Services | |
| MarketCap: 68388 Millions | |
| Recent Price: 239.12 Smart Investing & Trading Score: 100 | |
| Day Percent Change: 0.07% Day Change: 0.16 | |
| Week Change: 3.5% Year-to-date Change: 27.6% | |
| AXP Links: Profile News Message Board | |
| Charts:- Daily , Weekly | |
| Add AXP to Watchlist: View: Get AXP Trend Analysis ➞ | |
 | HAS Hasbro, Inc. |
| Sector: Consumer Staples | |
| SubSector: Toys & Games | |
| MarketCap: 7389.5 Millions | |
| Recent Price: 65.03 Smart Investing & Trading Score: 100 | |
| Day Percent Change: 11.85% Day Change: 6.89 | |
| Week Change: 17.66% Year-to-date Change: 27.4% | |
| HAS Links: Profile News Message Board | |
| Charts:- Daily , Weekly | |
| Add HAS to Watchlist: View: Get HAS Trend Analysis ➞ | |
 | DVA DaVita Inc. |
| Sector: Health Care | |
| SubSector: Specialized Health Services | |
| MarketCap: 8954.36 Millions | |
| Recent Price: 132.74 Smart Investing & Trading Score: 76 | |
| Day Percent Change: -0.87% Day Change: -1.17 | |
| Week Change: 3.85% Year-to-date Change: 26.7% | |
| DVA Links: Profile News Message Board | |
| Charts:- Daily , Weekly | |
| Add DVA to Watchlist: View: Get DVA Trend Analysis ➞ | |
 | DIS The Walt Disney Company |
| Sector: Services & Goods | |
| SubSector: Entertainment - Diversified | |
| MarketCap: 178396 Millions | |
| Recent Price: 113.92 Smart Investing & Trading Score: 68 | |
| Day Percent Change: 0.18% Day Change: 0.21 | |
| Week Change: 1.16% Year-to-date Change: 26.2% | |
| DIS Links: Profile News Message Board | |
| Charts:- Daily , Weekly | |
| Add DIS to Watchlist: View: Get DIS Trend Analysis ➞ | |
 | BSX Boston Scientific Corporation |
| Sector: Health Care | |
| SubSector: Medical Appliances & Equipment | |
| MarketCap: 41541.2 Millions | |
| Recent Price: 72.91 Smart Investing & Trading Score: 100 | |
| Day Percent Change: 5.68% Day Change: 3.92 | |
| Week Change: 8.29% Year-to-date Change: 26.1% | |
| BSX Links: Profile News Message Board | |
| Charts:- Daily , Weekly | |
| Add BSX to Watchlist: View: Get BSX Trend Analysis ➞ | |
 | LLY Eli Lilly and Company |
| Sector: Health Care | |
| SubSector: Drug Manufacturers - Major | |
| MarketCap: 130066 Millions | |
| Recent Price: 732.20 Smart Investing & Trading Score: 51 | |
| Day Percent Change: -1.81% Day Change: -13.49 | |
| Week Change: 0.81% Year-to-date Change: 25.6% | |
| LLY Links: Profile News Message Board | |
| Charts:- Daily , Weekly | |
| Add LLY to Watchlist: View: Get LLY Trend Analysis ➞ | |
 | GM General Motors Company |
| Sector: Consumer Staples | |
| SubSector: Auto Manufacturers - Major | |
| MarketCap: 29252.4 Millions | |
| Recent Price: 45.08 Smart Investing & Trading Score: 95 | |
| Day Percent Change: -0.04% Day Change: -0.02 | |
| Week Change: 6.4% Year-to-date Change: 25.5% | |
| GM Links: Profile News Message Board | |
| Charts:- Daily , Weekly | |
| Add GM to Watchlist: View: Get GM Trend Analysis ➞ | |
 | ACGL Arch Capital Group Ltd. |
| Sector: Financials | |
| SubSector: Property & Casualty Insurance | |
| MarketCap: 12350.9 Millions | |
| Recent Price: 93.19 Smart Investing & Trading Score: 61 | |
| Day Percent Change: -0.63% Day Change: -0.59 | |
| Week Change: 0.28% Year-to-date Change: 25.5% | |
| ACGL Links: Profile News Message Board | |
| Charts:- Daily , Weekly | |
| Add ACGL to Watchlist: View: Get ACGL Trend Analysis ➞ | |
 | GE General Electric Company |
| Sector: Industrials | |
| SubSector: Diversified Machinery | |
| MarketCap: 64710.6 Millions | |
| Recent Price: 159.19 Smart Investing & Trading Score: 80 | |
| Day Percent Change: -2.11% Day Change: -3.43 | |
| Week Change: 7.52% Year-to-date Change: 24.7% | |
| GE Links: Profile News Message Board | |
| Charts:- Daily , Weekly | |
| Add GE to Watchlist: View: Get GE Trend Analysis ➞ | |
 | CTLT Catalent, Inc. |
| Sector: Health Care | |
| SubSector: Drugs - Generic | |
| MarketCap: 6351.95 Millions | |
| Recent Price: 55.95 Smart Investing & Trading Score: 61 | |
| Day Percent Change: -0.14% Day Change: -0.08 | |
| Week Change: 0.85% Year-to-date Change: 24.5% | |
| CTLT Links: Profile News Message Board | |
| Charts:- Daily , Weekly | |
| Add CTLT to Watchlist: View: Get CTLT Trend Analysis ➞ | |
| For tabular summary view of above stock list: Summary View ➞ 0 - 25 , 25 - 50 , 50 - 75 , 75 - 100 , 100 - 125 , 125 - 150 , 150 - 175 , 175 - 200 , 200 - 225 , 225 - 250 , 250 - 275 , 275 - 300 , 300 - 325 , 325 - 350 , 350 - 375 , 375 - 400 , 400 - 425 , 425 - 450 , 450 - 475 , 475 - 500 | ||
| Click To Change The Sort Order: By Market Cap or Company Size Performance: Year-to-date, Week and Day | |
| Select Chart Type: | ||
|
Best Stocks Today 12Stocks.com |
© 2024 12Stocks.com Terms & Conditions Privacy Contact Us
All Information Provided Only For Education And Not To Be Used For Investing or Trading. See Terms & Conditions


One More Thing ... Get Best Stocks Delivered Daily!
Never Ever Miss A Move With Our Top Ten Stocks Lists
Find Best Stocks In Any Market - Bull or Bear Market
Take A Peek At Our Top Ten Stocks Lists: Daily, Weekly, Year-to-Date & Top Trends
Find Best Stocks In Any Market - Bull or Bear Market
Take A Peek At Our Top Ten Stocks Lists: Daily, Weekly, Year-to-Date & Top Trends
S&P 500 Stocks With Best Up Trends [0-bearish to 100-bullish]: Hasbro [100], Wabtec [100], Boston Scientific[100], Texas Instruments[100], Microchip [100], Synchrony Financial[100], EQT [100], PepsiCo [100], Analog Devices[100], Equity Residential[100], Essex Property[100]
Best S&P 500 Stocks Year-to-Date:
NVIDIA [60.89%], Constellation [59.4%], NRG [40.44%], Meta Platforms[39.4%], Targa Resources[34.57%], Marathon [34.23%], Progressive [33.22%], Western Digital[32.81%], Eaton [32.38%], Diamondback [32.34%], Micron [30.98%] Best S&P 500 Stocks This Week:
Globe Life[17.77%], Hasbro [17.66%], Wabtec [13.32%], Microchip [11.02%], Tesla [10.26%], Texas Instruments[9.48%], NXP Semiconductors[9.26%], CoStar [9.13%], Kimberly-Clark [8.63%], Monolithic Power[8.57%], Synchrony Financial[8.3%] Best S&P 500 Stocks Daily:
Tesla [12.06%], Hasbro [11.85%], Wabtec [10.04%], CoStar [8.66%], ON Semiconductor[6.24%], Boston Scientific[5.68%], Texas Instruments[5.64%], Microchip [5.21%], Monolithic Power[5.04%], Synchrony Financial[5.04%], Biogen [4.56%]