
 Login Sign Up


| |||||
 |  | ||||

| 12Stocks.com Market Intelligence |
Best S&P 500 Stocks
|
On this page, you will find the most comprehensive analysis of S&P 500 stocks and ETFs - from latest trends to performances to charts ➞. First, here are the year-to-date (YTD) performances of the most requested S&P 500 stocks at 12Stocks.com (click stock for review):
| NVIDIA 74% | ||
| Caterpillar 21% | ||
| Amazon.com 21% | ||
| Merck 15% | ||
| Walmart 14% | ||
| Google 12% | ||
| Microsoft 11% | ||
| JPMorgan Chase 6% | ||
| Chevron 5% | ||
| Goldman Sachs 5% | ||
| Johnson & Johnson -8% | ||
| McDonald s -10% | ||
| Starbucks -11% | ||
| Apple -12% | ||
| Gilead -17% | ||
| Intel -29% | ||
| Boeing -35% | ||
| Quick: S&P 500 Stocks Lists: Performances & Trends, S&P 500 Stock Charts
Sort S&P 500 stocks: Daily, Weekly, Year-to-Date, Market Cap & Trends. Filter S&P 500 stocks list by sector: Show all, Tech, Finance, Energy, Staples, Retail, Industrial, Materials, Utilities and HealthCare |
| 12Stocks.com S&P 500 Stocks Performances & Trends Daily Report | |||||||||
|
| 
The overall Smart Investing & Trading Score is 36 (0-bearish to 100-bullish) which puts S&P 500 index in short term bearish to neutral trend. The Smart Investing & Trading Score from previous trading session is 26 and hence an improvement of trend. | ||||||||
Here are the Smart Investing & Trading Scores of the most requested S&P 500 stocks at 12Stocks.com (click stock name for detailed review):
|


| 12Stocks.com: Top Performing S&P 500 Index Stocks | ||||||||||||||||||||||||||||||||||||||||||||||||
 The top performing S&P 500 Index stocks year to date are
Now, more recently, over last week, the top performing S&P 500 Index stocks on the move are


|
||||||||||||||||||||||||||||||||||||||||||||||||
| 12Stocks.com: Investing in S&P 500 Index with Stocks | |
|
The following table helps investors and traders sort through current performance and trends (as measured by Smart Investing & Trading Score) of various
stocks in the S&P 500 Index. Quick View: Move mouse or cursor over stock symbol (ticker) to view short-term technical chart and over stock name to view long term chart. Click on  to add stock symbol to your watchlist and to add stock symbol to your watchlist and  to view watchlist. Click on any ticker or stock name for detailed market intelligence report for that stock. to view watchlist. Click on any ticker or stock name for detailed market intelligence report for that stock. |
12Stocks.com Performance of Stocks in S&P 500 Index
| Ticker | Stock Name | Watchlist | Category | Recent Price | Smart Investing & Trading Score | Change % | Weekly Change% |
| AON | Aon |   | Financials | 307.70 | 51 | 1.20% | -0.10% |
| DRI | Darden Restaurants | | Services & Goods | 152.87 | 25 | -0.83% | -0.12% |
| VRTX | Vertex | | Health Care | 396.05 | 18 | 0.48% | -0.13% |
| DIS | Walt Disney | | Services & Goods | 113.85 | 54 | -0.03% | -0.14% |
| SO | Southern | | Utilities | 68.63 | 35 | 1.27% | -0.15% |
| MCD | McDonald s | | Services & Goods | 266.93 | 25 | 0.56% | -0.17% |
| VZ | Verizon | | Technology | 39.65 | 23 | -0.30% | -0.18% |
| AMP | Ameriprise Financial | | Financials | 412.94 | 51 | 0.51% | -0.18% |
| YUM | Yum! Brands | | Services & Goods | 137.55 | 58 | -0.33% | -0.18% |
| CFG | Citizens Financial | | Financials | 33.08 | 61 | 2.07% | -0.18% |
| ED | Consolidated Edison | | Utilities | 88.46 | 28 | 1.19% | -0.19% |
| AVY | Avery Dennison | | Consumer Staples | 210.81 | 51 | -0.13% | -0.20% |
| MGM | MGM Resorts | | Services & Goods | 42.39 | 18 | -0.73% | -0.21% |
| FIS | Fidelity National | | Technology | 70.80 | 54 | 0.14% | -0.21% |
| MMC | Marsh & McLennan | | Financials | 197.63 | 44 | 0.69% | -0.22% |
| DFS | Discover Financial | | Financials | 120.64 | 61 | 0.89% | -0.22% |
| TEL | TE Connectivity | | Technology | 142.66 | 26 | -0.13% | -0.22% |
| HRL | Hormel Foods | | Consumer Staples | 33.84 | 61 | 0.10% | -0.25% |
| EL | Estee Lauder | | Consumer Staples | 138.42 | 61 | 1.09% | -0.27% |
| WM | Waste Management | | Industrials | 204.79 | 49 | -0.09% | -0.28% |
| MMM | 3M | | Industrials | 91.05 | 25 | 0.00% | -0.28% |
| WST | West Pharmaceutical | | Health Care | 378.93 | 61 | -0.14% | -0.28% |
| CVS | CVS Health | | Health Care | 68.44 | 18 | -0.86% | -0.30% |
| TGT | Target | | Services & Goods | 165.57 | 61 | 1.38% | -0.33% |
| GPN | Global Payments | | Services & Goods | 123.33 | 25 | -0.08% | -0.33% |
| For chart view version of above stock list: Chart View ➞ 0 - 25 , 25 - 50 , 50 - 75 , 75 - 100 , 100 - 125 , 125 - 150 , 150 - 175 , 175 - 200 , 200 - 225 , 225 - 250 , 250 - 275 , 275 - 300 , 300 - 325 , 325 - 350 , 350 - 375 , 375 - 400 , 400 - 425 , 425 - 450 , 450 - 475 | ||
 | Click To Change The Sort Order: By Market Cap or Company Size Performance: Year-to-date, Week and Day |  |
|
Get the most comprehensive stock market coverage daily at 12Stocks.com ➞ Best Stocks Today ➞ Best Stocks Weekly ➞ Best Stocks Year-to-Date ➞ Best Stocks Trends ➞  Best Stocks Today 12Stocks.com Best Nasdaq Stocks ➞ Best S&P 500 Stocks ➞ Best Tech Stocks ➞ Best Biotech Stocks ➞ |
| Detailed Overview of S&P 500 Stocks |
| S&P 500 Technical Overview, Leaders & Laggards, Top S&P 500 ETF Funds & Detailed S&P 500 Stocks List, Charts, Trends & More |
| S&P 500: Technical Analysis, Trends & YTD Performance | |
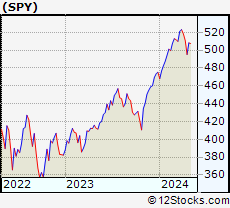
| S&P 500 index as represented by
SPY, an exchange-traded fund [ETF], holds basket of five hundred (mostly largecap) stocks from across all major sectors of the US stock market. The S&P 500 index (contains stocks like Apple and Exxon) is up by 5.86% and is currently outperforming the overall market by 0.89% year-to-date. Below is a quick view of technical charts and trends: | |
 SPY Weekly Chart |
|
| Long Term Trend: Good | |
| Medium Term Trend: Not Good | |
 SPY Daily Chart |
|
| Short Term Trend: Not Good | |
| Overall Trend Score: 36 | |
| YTD Performance: 5.86% | |
| **Trend Scores & Views Are Only For Educational Purposes And Not For Investing | |
| 12Stocks.com: Investing in S&P 500 Index using Exchange Traded Funds | |
|
The following table shows list of key exchange traded funds (ETF) that
help investors track S&P 500 index. The following list also includes leveraged ETF funds that track twice or thrice the daily returns of S&P 500 indices. Short or inverse ETF funds move in the opposite direction to the index they track and are useful during market pullbacks or during bear markets. Quick View: Move mouse or cursor over ETF symbol (ticker) to view short-term technical chart and over ETF name to view long term chart. Click on ticker or stock name for detailed view. Click on to add stock symbol to your watchlist and to view watchlist. |
12Stocks.com List of ETFs that track S&P 500 Index
| Ticker | ETF Name | Watchlist | Recent Price | Smart Investing & Trading Score | Change % | Week % | Year-to-date % |
| SPY | SPDR S&P 500 ETF | | 503.18 | 36 | -0.07 | -1.5 | 5.86% |
| IVV | iShares Core S&P 500 ETF | | 505.60 | 33 | -0.12 | -1.5 | 5.85% |
| VOO | Vanguard 500 ETF | | 462.39 | 33 | -0.13 | -1.53 | 5.86% |
| OEF | iShares S&P 100 | | 239.46 | 43 | 0.03 | -1.51 | 7.19% |
| SSO | ProShares Ultra S&P500 | | 71.44 | 36 | -0.15 | -3.01 | 9.79% |
| UPRO | ProShares UltraPro S&P500 | | 62.25 | 36 | -0.19 | -4.52 | 13.72% |
| SPXL | Direxion Daily S&P500 Bull 3X ETF | | 118.27 | 43 | -0.35 | -4.5 | 13.73% |
| SH | ProShares Short S&P500 | | 12.38 | 69 | 0.08 | 1.56 | -4.7% |
| SDS | ProShares UltraShort S&P500 | | 26.99 | 69 | 0.22 | 3.13 | -9.79% |
| SPXU | ProShares UltraPro Short S&P500 | | 36.46 | 69 | 0.22 | 4.59 | -15.21% |
| SPXS | Direxion Daily S&P 500 Bear 3X ETF | | 9.87 | 57 | 0.41 | 4.78 | -14.55% |
| 12Stocks.com: Charts, Trends, Fundamental Data and Performances of S&P 500 Stocks | |
|
We now take in-depth look at all S&P 500 stocks including charts, multi-period performances and overall trends (as measured by Smart Investing & Trading Score). One can sort S&P 500 stocks (click link to choose) by Daily, Weekly and by Year-to-Date performances. Also, one can sort by size of the company or by market capitalization. |
| Select Your Default Chart Type: | |||||
| |||||
| Click on stock symbol or name for detailed view. Click on to add stock symbol to your watchlist and to view watchlist. Quick View: Move mouse or cursor over "Daily" to quickly view daily technical stock chart and over "Weekly" to view weekly technical stock chart. | |||||

 | AON Aon plc |
| Sector: Financials | |
| SubSector: Insurance Brokers | |
| MarketCap: 36870.1 Millions | |
| Recent Price: 307.70 Smart Investing & Trading Score: 51 | |
| Day Percent Change: 1.20% Day Change: 3.65 | |
| Week Change: -0.1% Year-to-date Change: 5.7% | |
| AON Links: Profile News Message Board | |
| Charts:- Daily , Weekly | |
| Add AON to Watchlist: View: Get AON Trend Analysis ➞ | |
 | DRI Darden Restaurants, Inc. |
| Sector: Services & Goods | |
| SubSector: Restaurants | |
| MarketCap: 5623.1 Millions | |
| Recent Price: 152.87 Smart Investing & Trading Score: 25 | |
| Day Percent Change: -0.83% Day Change: -1.27 | |
| Week Change: -0.12% Year-to-date Change: -7.0% | |
| DRI Links: Profile News Message Board | |
| Charts:- Daily , Weekly | |
| Add DRI to Watchlist: View: Get DRI Trend Analysis ➞ | |
 | VRTX Vertex Pharmaceuticals Incorporated |
| Sector: Health Care | |
| SubSector: Biotechnology | |
| MarketCap: 57669.6 Millions | |
| Recent Price: 396.05 Smart Investing & Trading Score: 18 | |
| Day Percent Change: 0.48% Day Change: 1.88 | |
| Week Change: -0.13% Year-to-date Change: -2.7% | |
| VRTX Links: Profile News Message Board | |
| Charts:- Daily , Weekly | |
| Add VRTX to Watchlist: View: Get VRTX Trend Analysis ➞ | |
 | DIS The Walt Disney Company |
| Sector: Services & Goods | |
| SubSector: Entertainment - Diversified | |
| MarketCap: 178396 Millions | |
| Recent Price: 113.85 Smart Investing & Trading Score: 54 | |
| Day Percent Change: -0.03% Day Change: -0.03 | |
| Week Change: -0.14% Year-to-date Change: 26.1% | |
| DIS Links: Profile News Message Board | |
| Charts:- Daily , Weekly | |
| Add DIS to Watchlist: View: Get DIS Trend Analysis ➞ | |
 | SO The Southern Company |
| Sector: Utilities | |
| SubSector: Electric Utilities | |
| MarketCap: 54483.6 Millions | |
| Recent Price: 68.63 Smart Investing & Trading Score: 35 | |
| Day Percent Change: 1.27% Day Change: 0.86 | |
| Week Change: -0.15% Year-to-date Change: -2.1% | |
| SO Links: Profile News Message Board | |
| Charts:- Daily , Weekly | |
| Add SO to Watchlist: View: Get SO Trend Analysis ➞ | |
 | MCD McDonald s Corporation |
| Sector: Services & Goods | |
| SubSector: Restaurants | |
| MarketCap: 122481 Millions | |
| Recent Price: 266.93 Smart Investing & Trading Score: 25 | |
| Day Percent Change: 0.56% Day Change: 1.50 | |
| Week Change: -0.17% Year-to-date Change: -10.0% | |
| MCD Links: Profile News Message Board | |
| Charts:- Daily , Weekly | |
| Add MCD to Watchlist: View: Get MCD Trend Analysis ➞ | |
 | VZ Verizon Communications Inc. |
| Sector: Technology | |
| SubSector: Telecom Services - Domestic | |
| MarketCap: 229427 Millions | |
| Recent Price: 39.65 Smart Investing & Trading Score: 23 | |
| Day Percent Change: -0.30% Day Change: -0.12 | |
| Week Change: -0.18% Year-to-date Change: 5.2% | |
| VZ Links: Profile News Message Board | |
| Charts:- Daily , Weekly | |
| Add VZ to Watchlist: View: Get VZ Trend Analysis ➞ | |
 | AMP Ameriprise Financial, Inc. |
| Sector: Financials | |
| SubSector: Asset Management | |
| MarketCap: 13270.5 Millions | |
| Recent Price: 412.94 Smart Investing & Trading Score: 51 | |
| Day Percent Change: 0.51% Day Change: 2.09 | |
| Week Change: -0.18% Year-to-date Change: 8.7% | |
| AMP Links: Profile News Message Board | |
| Charts:- Daily , Weekly | |
| Add AMP to Watchlist: View: Get AMP Trend Analysis ➞ | |
 | YUM Yum! Brands, Inc. |
| Sector: Services & Goods | |
| SubSector: Restaurants | |
| MarketCap: 18033.3 Millions | |
| Recent Price: 137.55 Smart Investing & Trading Score: 58 | |
| Day Percent Change: -0.33% Day Change: -0.45 | |
| Week Change: -0.18% Year-to-date Change: 5.3% | |
| YUM Links: Profile News Message Board | |
| Charts:- Daily , Weekly | |
| Add YUM to Watchlist: View: Get YUM Trend Analysis ➞ | |
 | CFG Citizens Financial Group, Inc. |
| Sector: Financials | |
| SubSector: Regional - Mid-Atlantic Banks | |
| MarketCap: 8225.19 Millions | |
| Recent Price: 33.08 Smart Investing & Trading Score: 61 | |
| Day Percent Change: 2.07% Day Change: 0.67 | |
| Week Change: -0.18% Year-to-date Change: -0.2% | |
| CFG Links: Profile News Message Board | |
| Charts:- Daily , Weekly | |
| Add CFG to Watchlist: View: Get CFG Trend Analysis ➞ | |
 | ED Consolidated Edison, Inc. |
| Sector: Utilities | |
| SubSector: Electric Utilities | |
| MarketCap: 25012.3 Millions | |
| Recent Price: 88.46 Smart Investing & Trading Score: 28 | |
| Day Percent Change: 1.19% Day Change: 1.04 | |
| Week Change: -0.19% Year-to-date Change: -2.8% | |
| ED Links: Profile News Message Board | |
| Charts:- Daily , Weekly | |
| Add ED to Watchlist: View: Get ED Trend Analysis ➞ | |
 | AVY Avery Dennison Corporation |
| Sector: Consumer Staples | |
| SubSector: Business Equipment | |
| MarketCap: 8051.27 Millions | |
| Recent Price: 210.81 Smart Investing & Trading Score: 51 | |
| Day Percent Change: -0.13% Day Change: -0.28 | |
| Week Change: -0.2% Year-to-date Change: 4.3% | |
| AVY Links: Profile News Message Board | |
| Charts:- Daily , Weekly | |
| Add AVY to Watchlist: View: Get AVY Trend Analysis ➞ | |
 | MGM MGM Resorts International |
| Sector: Services & Goods | |
| SubSector: Resorts & Casinos | |
| MarketCap: 5315.04 Millions | |
| Recent Price: 42.39 Smart Investing & Trading Score: 18 | |
| Day Percent Change: -0.73% Day Change: -0.31 | |
| Week Change: -0.21% Year-to-date Change: -5.1% | |
| MGM Links: Profile News Message Board | |
| Charts:- Daily , Weekly | |
| Add MGM to Watchlist: View: Get MGM Trend Analysis ➞ | |
 | FIS Fidelity National Information Services, Inc. |
| Sector: Technology | |
| SubSector: Information Technology Services | |
| MarketCap: 71126.8 Millions | |
| Recent Price: 70.80 Smart Investing & Trading Score: 54 | |
| Day Percent Change: 0.14% Day Change: 0.10 | |
| Week Change: -0.21% Year-to-date Change: 17.9% | |
| FIS Links: Profile News Message Board | |
| Charts:- Daily , Weekly | |
| Add FIS to Watchlist: View: Get FIS Trend Analysis ➞ | |
 | MMC Marsh & McLennan Companies, Inc. |
| Sector: Financials | |
| SubSector: Insurance Brokers | |
| MarketCap: 42821.8 Millions | |
| Recent Price: 197.63 Smart Investing & Trading Score: 44 | |
| Day Percent Change: 0.69% Day Change: 1.34 | |
| Week Change: -0.22% Year-to-date Change: 4.3% | |
| MMC Links: Profile News Message Board | |
| Charts:- Daily , Weekly | |
| Add MMC to Watchlist: View: Get MMC Trend Analysis ➞ | |
 | DFS Discover Financial Services |
| Sector: Financials | |
| SubSector: Credit Services | |
| MarketCap: 9228.88 Millions | |
| Recent Price: 120.64 Smart Investing & Trading Score: 61 | |
| Day Percent Change: 0.89% Day Change: 1.07 | |
| Week Change: -0.22% Year-to-date Change: 7.3% | |
| DFS Links: Profile News Message Board | |
| Charts:- Daily , Weekly | |
| Add DFS to Watchlist: View: Get DFS Trend Analysis ➞ | |
 | TEL TE Connectivity Ltd. |
| Sector: Technology | |
| SubSector: Diversified Electronics | |
| MarketCap: 20044.9 Millions | |
| Recent Price: 142.66 Smart Investing & Trading Score: 26 | |
| Day Percent Change: -0.13% Day Change: -0.19 | |
| Week Change: -0.22% Year-to-date Change: 1.5% | |
| TEL Links: Profile News Message Board | |
| Charts:- Daily , Weekly | |
| Add TEL to Watchlist: View: Get TEL Trend Analysis ➞ | |
 | HRL Hormel Foods Corporation |
| Sector: Consumer Staples | |
| SubSector: Meat Products | |
| MarketCap: 25590.2 Millions | |
| Recent Price: 33.84 Smart Investing & Trading Score: 61 | |
| Day Percent Change: 0.10% Day Change: 0.03 | |
| Week Change: -0.25% Year-to-date Change: 5.4% | |
| HRL Links: Profile News Message Board | |
| Charts:- Daily , Weekly | |
| Add HRL to Watchlist: View: Get HRL Trend Analysis ➞ | |
 | EL The Estee Lauder Companies Inc. |
| Sector: Consumer Staples | |
| SubSector: Personal Products | |
| MarketCap: 59521.1 Millions | |
| Recent Price: 138.42 Smart Investing & Trading Score: 61 | |
| Day Percent Change: 1.09% Day Change: 1.49 | |
| Week Change: -0.27% Year-to-date Change: -5.4% | |
| EL Links: Profile News Message Board | |
| Charts:- Daily , Weekly | |
| Add EL to Watchlist: View: Get EL Trend Analysis ➞ | |
 | WM Waste Management, Inc. |
| Sector: Industrials | |
| SubSector: Waste Management | |
| MarketCap: 46977.4 Millions | |
| Recent Price: 204.79 Smart Investing & Trading Score: 49 | |
| Day Percent Change: -0.09% Day Change: -0.19 | |
| Week Change: -0.28% Year-to-date Change: 14.4% | |
| WM Links: Profile News Message Board | |
| Charts:- Daily , Weekly | |
| Add WM to Watchlist: View: Get WM Trend Analysis ➞ | |
 | MMM 3M Company |
| Sector: Industrials | |
| SubSector: Diversified Machinery | |
| MarketCap: 79237.7 Millions | |
| Recent Price: 91.05 Smart Investing & Trading Score: 25 | |
| Day Percent Change: 0.00% Day Change: 0.00 | |
| Week Change: -0.28% Year-to-date Change: -16.7% | |
| MMM Links: Profile News Message Board | |
| Charts:- Daily , Weekly | |
| Add MMM to Watchlist: View: Get MMM Trend Analysis ➞ | |
 | WST West Pharmaceutical Services, Inc. |
| Sector: Health Care | |
| SubSector: Medical Instruments & Supplies | |
| MarketCap: 9989 Millions | |
| Recent Price: 378.93 Smart Investing & Trading Score: 61 | |
| Day Percent Change: -0.14% Day Change: -0.55 | |
| Week Change: -0.28% Year-to-date Change: 7.6% | |
| WST Links: Profile News Message Board | |
| Charts:- Daily , Weekly | |
| Add WST to Watchlist: View: Get WST Trend Analysis ➞ | |
 | CVS CVS Health Corporation |
| Sector: Health Care | |
| SubSector: Health Care Plans | |
| MarketCap: 80104.3 Millions | |
| Recent Price: 68.44 Smart Investing & Trading Score: 18 | |
| Day Percent Change: -0.86% Day Change: -0.59 | |
| Week Change: -0.3% Year-to-date Change: -13.3% | |
| CVS Links: Profile News Message Board | |
| Charts:- Daily , Weekly | |
| Add CVS to Watchlist: View: Get CVS Trend Analysis ➞ | |
 | TGT Target Corporation |
| Sector: Services & Goods | |
| SubSector: Discount, Variety Stores | |
| MarketCap: 55980.6 Millions | |
| Recent Price: 165.57 Smart Investing & Trading Score: 61 | |
| Day Percent Change: 1.38% Day Change: 2.25 | |
| Week Change: -0.33% Year-to-date Change: 16.3% | |
| TGT Links: Profile News Message Board | |
| Charts:- Daily , Weekly | |
| Add TGT to Watchlist: View: Get TGT Trend Analysis ➞ | |
 | GPN Global Payments Inc. |
| Sector: Services & Goods | |
| SubSector: Business Services | |
| MarketCap: 39068.8 Millions | |
| Recent Price: 123.33 Smart Investing & Trading Score: 25 | |
| Day Percent Change: -0.08% Day Change: -0.10 | |
| Week Change: -0.33% Year-to-date Change: -2.9% | |
| GPN Links: Profile News Message Board | |
| Charts:- Daily , Weekly | |
| Add GPN to Watchlist: View: Get GPN Trend Analysis ➞ | |
| For tabular summary view of above stock list: Summary View ➞ 0 - 25 , 25 - 50 , 50 - 75 , 75 - 100 , 100 - 125 , 125 - 150 , 150 - 175 , 175 - 200 , 200 - 225 , 225 - 250 , 250 - 275 , 275 - 300 , 300 - 325 , 325 - 350 , 350 - 375 , 375 - 400 , 400 - 425 , 425 - 450 , 450 - 475 | ||
| Click To Change The Sort Order: By Market Cap or Company Size Performance: Year-to-date, Week and Day | |
| Select Chart Type: | ||
|
Best Stocks Today 12Stocks.com |
© 2024 12Stocks.com Terms & Conditions Privacy Contact Us
All Information Provided Only For Education And Not To Be Used For Investing or Trading. See Terms & Conditions


One More Thing ... Get Best Stocks Delivered Daily!
Never Ever Miss A Move With Our Top Ten Stocks Lists
Find Best Stocks In Any Market - Bull or Bear Market
Take A Peek At Our Top Ten Stocks Lists: Daily, Weekly, Year-to-Date & Top Trends
Find Best Stocks In Any Market - Bull or Bear Market
Take A Peek At Our Top Ten Stocks Lists: Daily, Weekly, Year-to-Date & Top Trends
S&P 500 Stocks With Best Up Trends [0-bearish to 100-bullish]: Charles Schwab[100], Conagra Brands[95], United Airlines[85], Freeport-McMoRan [83], Bunge [83], Progressive [83], Google [83], Newmont [76], Tyson Foods[76], Google [75], Delta Air[73]
Best S&P 500 Stocks Year-to-Date:
NVIDIA [74.27%], Constellation [58.07%], Micron [41.15%], Meta Platforms[40.52%], NRG [39.52%], Marathon [37.73%], Western Digital[36.91%], Progressive [31.55%], Diamondback [30.91%], Targa Resources[30.77%], Valero [30.32%] Best S&P 500 Stocks This Week:
United Airlines[10.97%], UnitedHealth [8.33%], Morgan Stanley[5.06%], ProShares UltraPro[4.59%], Southwest Airlines[4.18%], Charles Schwab[4.1%], Goldman Sachs[3.6%], General Mills[3.1%], Conagra Brands[2.88%], Progressive [2.76%], M&T Bank[2.71%] Best S&P 500 Stocks Daily:
United Airlines[11.77%], American Airlines[3.30%], Southwest Airlines[2.28%], Freeport-McMoRan [2.27%], Northern Trust[2.15%], Citi [2.10%], Citizens Financial[2.07%], Norwegian Cruise[2.06%], Bank of America[1.95%], Delta Air[1.94%], First Solar[1.81%]