
 Login Sign Up


| |||||
 |  | ||||

| 12Stocks.com Market Intelligence |
Best S&P 500 Stocks
|
On this page, you will find the most comprehensive analysis of S&P 500 stocks and ETFs - from latest trends to performances to charts ➞. First, here are the year-to-date (YTD) performances of the most requested S&P 500 stocks at 12Stocks.com (click stock for review):
| NVIDIA 70% | ||
| Caterpillar 21% | ||
| Amazon.com 19% | ||
| Merck 15% | ||
| Walmart 14% | ||
| Google 11% | ||
| Microsoft 10% | ||
| JPMorgan Chase 6% | ||
| Chevron 5% | ||
| Goldman Sachs 5% | ||
| Johnson & Johnson -8% | ||
| McDonald s -9% | ||
| Starbucks -10% | ||
| Apple -13% | ||
| Gilead -17% | ||
| Intel -29% | ||
| Boeing -35% | ||
| Quick: S&P 500 Stocks Lists: Performances & Trends, S&P 500 Stock Charts
Sort S&P 500 stocks: Daily, Weekly, Year-to-Date, Market Cap & Trends. Filter S&P 500 stocks list by sector: Show all, Tech, Finance, Energy, Staples, Retail, Industrial, Materials, Utilities and HealthCare |
| 12Stocks.com S&P 500 Stocks Performances & Trends Daily Report | |||||||||
|
| 
The overall Smart Investing & Trading Score is 26 (0-bearish to 100-bullish) which puts S&P 500 index in short term bearish to neutral trend. The Smart Investing & Trading Score from previous trading session is 31 and a deterioration of trend continues. | ||||||||
Here are the Smart Investing & Trading Scores of the most requested S&P 500 stocks at 12Stocks.com (click stock name for detailed review):
|


| 12Stocks.com: Top Performing S&P 500 Index Stocks | ||||||||||||||||||||||||||||||||||||||||||||||||
 The top performing S&P 500 Index stocks year to date are
Now, more recently, over last week, the top performing S&P 500 Index stocks on the move are


|
||||||||||||||||||||||||||||||||||||||||||||||||
| 12Stocks.com: Investing in S&P 500 Index with Stocks | |
|
The following table helps investors and traders sort through current performance and trends (as measured by Smart Investing & Trading Score) of various
stocks in the S&P 500 Index. Quick View: Move mouse or cursor over stock symbol (ticker) to view short-term technical chart and over stock name to view long term chart. Click on  to add stock symbol to your watchlist and to add stock symbol to your watchlist and  to view watchlist. Click on any ticker or stock name for detailed market intelligence report for that stock. to view watchlist. Click on any ticker or stock name for detailed market intelligence report for that stock. |
12Stocks.com Performance of Stocks in S&P 500 Index
| Ticker | Stock Name | Watchlist | Category | Recent Price | Smart Investing & Trading Score | Change % | Weekly Change% |
| BWA | BorgWarner |   | Consumer Staples | 31.86 | 10 | -1.79% | -4.90% |
| USB | U.S. Bancorp | | Financials | 39.52 | 0 | -3.61% | -4.95% |
| MTD | Mettler-Toledo | | Health Care | 1198.03 | 23 | -2.46% | -5.00% |
| LEN | Lennar | | Industrials | 151.88 | 33 | -0.46% | -5.02% |
| MAR | Marriott | | Services & Goods | 238.46 | 13 | -2.92% | -5.02% |
| MU | Micron | | Technology | 116.33 | 36 | -4.47% | -5.05% |
| EQIX | Equinix | | Financials | 734.56 | 0 | -1.02% | -5.07% |
| PODD | Insulet | | Health Care | 166.26 | 17 | -3.73% | -5.11% |
| WY | Weyerhaeuser | | Industrials | 31.52 | 0 | -1.41% | -5.17% |
| MKTX | MarketAxess Holdings | | Financials | 201.93 | 0 | -0.41% | -5.20% |
| FTNT | Fortinet | | Technology | 64.66 | 23 | 0.28% | -5.22% |
| SNPS | Synopsys | | Technology | 527.58 | 0 | -2.50% | -5.31% |
| BLDR | Builders FirstSource | | Industrials | 179.31 | 43 | -1.53% | -5.39% |
| CSGP | CoStar | | Financials | 85.46 | 36 | -0.96% | -5.40% |
| IP | Paper | | Consumer Staples | 35.06 | 0 | -2.37% | -5.60% |
| FFIV | F5 Networks | | Technology | 181.30 | 0 | -0.96% | -5.62% |
| PAYC | Paycom Software | | Technology | 186.86 | 10 | -1.73% | -5.63% |
| AMD | Advanced Micro | | Technology | 154.02 | 0 | -5.78% | -5.67% |
| URI | United Rentals | | Transports | 636.22 | 26 | -3.01% | -5.72% |
| WAT | Waters | | Health Care | 304.18 | 0 | -3.04% | -5.73% |
| TECH | Bio-Techne | | Health Care | 62.73 | 10 | -2.00% | -5.99% |
| UPRO | ProShares UltraPro | | Utilities | 61.26 | 26 | -1.78% | -6.04% |
| CRM | salesforce.com | | Technology | 276.32 | 0 | -0.39% | -6.12% |
| HST | Host Hotels | | Financials | 18.74 | 0 | -1.78% | -6.30% |
| RMD | ResMed | | Health Care | 173.83 | 10 | -5.97% | -6.47% |
| For chart view version of above stock list: Chart View ➞ 0 - 25 , 25 - 50 , 50 - 75 , 75 - 100 , 100 - 125 , 125 - 150 , 150 - 175 , 175 - 200 , 200 - 225 , 225 - 250 , 250 - 275 , 275 - 300 , 300 - 325 , 325 - 350 , 350 - 375 , 375 - 400 , 400 - 425 , 425 - 450 , 450 - 475 , 475 - 500 | ||
 | Click To Change The Sort Order: By Market Cap or Company Size Performance: Year-to-date, Week and Day |  |
|
Get the most comprehensive stock market coverage daily at 12Stocks.com ➞ Best Stocks Today ➞ Best Stocks Weekly ➞ Best Stocks Year-to-Date ➞ Best Stocks Trends ➞  Best Stocks Today 12Stocks.com Best Nasdaq Stocks ➞ Best S&P 500 Stocks ➞ Best Tech Stocks ➞ Best Biotech Stocks ➞ |
| Detailed Overview of S&P 500 Stocks |
| S&P 500 Technical Overview, Leaders & Laggards, Top S&P 500 ETF Funds & Detailed S&P 500 Stocks List, Charts, Trends & More |
| S&P 500: Technical Analysis, Trends & YTD Performance | |
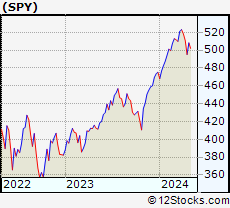
| S&P 500 index as represented by
SPY, an exchange-traded fund [ETF], holds basket of five hundred (mostly largecap) stocks from across all major sectors of the US stock market. The S&P 500 index (contains stocks like Apple and Exxon) is up by 5.31% and is currently outperforming the overall market by 0.9% year-to-date. Below is a quick view of technical charts and trends: | |
 SPY Weekly Chart |
|
| Long Term Trend: Good | |
| Medium Term Trend: Not Good | |
 SPY Daily Chart |
|
| Short Term Trend: Not Good | |
| Overall Trend Score: 26 | |
| YTD Performance: 5.31% | |
| **Trend Scores & Views Are Only For Educational Purposes And Not For Investing | |
| 12Stocks.com: Investing in S&P 500 Index using Exchange Traded Funds | |
|
The following table shows list of key exchange traded funds (ETF) that
help investors track S&P 500 index. The following list also includes leveraged ETF funds that track twice or thrice the daily returns of S&P 500 indices. Short or inverse ETF funds move in the opposite direction to the index they track and are useful during market pullbacks or during bear markets. Quick View: Move mouse or cursor over ETF symbol (ticker) to view short-term technical chart and over ETF name to view long term chart. Click on ticker or stock name for detailed view. Click on to add stock symbol to your watchlist and to view watchlist. |
12Stocks.com List of ETFs that track S&P 500 Index
| Ticker | ETF Name | Watchlist | Recent Price | Smart Investing & Trading Score | Change % | Week % | Year-to-date % |
| SPY | SPDR S&P 500 ETF | | 500.55 | 26 | -0.59 | -2.02 | 5.31% |
| IVV | iShares Core S&P 500 ETF | | 503.04 | 26 | -0.62 | -2 | 5.32% |
| VOO | Vanguard 500 ETF | | 459.99 | 26 | -0.65 | -2.04 | 5.31% |
| OEF | iShares S&P 100 | | 237.92 | 26 | -0.62 | -2.15 | 6.5% |
| SSO | ProShares Ultra S&P500 | | 70.66 | 26 | -1.24 | -4.07 | 8.59% |
| UPRO | ProShares UltraPro S&P500 | | 61.26 | 26 | -1.78 | -6.04 | 11.91% |
| SPXL | Direxion Daily S&P500 Bull 3X ETF | | 116.35 | 36 | -1.96 | -6.05 | 11.89% |
| SH | ProShares Short S&P500 | | 12.44 | 74 | 0.57 | 2.05 | -4.23% |
| SDS | ProShares UltraShort S&P500 | | 27.27 | 74 | 1.26 | 4.2 | -8.86% |
| SPXU | ProShares UltraPro Short S&P500 | | 37.07 | 74 | 1.90 | 6.34 | -13.79% |
| SPXS | Direxion Daily S&P 500 Bear 3X ETF | | 10.01 | 64 | 1.83 | 6.26 | -13.33% |
| 12Stocks.com: Charts, Trends, Fundamental Data and Performances of S&P 500 Stocks | |
|
We now take in-depth look at all S&P 500 stocks including charts, multi-period performances and overall trends (as measured by Smart Investing & Trading Score). One can sort S&P 500 stocks (click link to choose) by Daily, Weekly and by Year-to-Date performances. Also, one can sort by size of the company or by market capitalization. |
| Select Your Default Chart Type: | |||||
| |||||
| Click on stock symbol or name for detailed view. Click on to add stock symbol to your watchlist and to view watchlist. Quick View: Move mouse or cursor over "Daily" to quickly view daily technical stock chart and over "Weekly" to view weekly technical stock chart. | |||||

 | BWA BorgWarner Inc. |
| Sector: Consumer Staples | |
| SubSector: Auto Parts | |
| MarketCap: 4604.09 Millions | |
| Recent Price: 31.86 Smart Investing & Trading Score: 10 | |
| Day Percent Change: -1.79% Day Change: -0.58 | |
| Week Change: -4.9% Year-to-date Change: -11.1% | |
| BWA Links: Profile News Message Board | |
| Charts:- Daily , Weekly | |
| Add BWA to Watchlist: View: Get BWA Trend Analysis ➞ | |
 | USB U.S. Bancorp |
| Sector: Financials | |
| SubSector: Regional - Midwest Banks | |
| MarketCap: 56757.8 Millions | |
| Recent Price: 39.52 Smart Investing & Trading Score: 0 | |
| Day Percent Change: -3.61% Day Change: -1.48 | |
| Week Change: -4.95% Year-to-date Change: -8.7% | |
| USB Links: Profile News Message Board | |
| Charts:- Daily , Weekly | |
| Add USB to Watchlist: View: Get USB Trend Analysis ➞ | |
 | MTD Mettler-Toledo International Inc. |
| Sector: Health Care | |
| SubSector: Medical Instruments & Supplies | |
| MarketCap: 15973.1 Millions | |
| Recent Price: 1198.03 Smart Investing & Trading Score: 23 | |
| Day Percent Change: -2.46% Day Change: -30.27 | |
| Week Change: -5% Year-to-date Change: -1.2% | |
| MTD Links: Profile News Message Board | |
| Charts:- Daily , Weekly | |
| Add MTD to Watchlist: View: Get MTD Trend Analysis ➞ | |
 | LEN Lennar Corporation |
| Sector: Industrials | |
| SubSector: Residential Construction | |
| MarketCap: 11926.6 Millions | |
| Recent Price: 151.88 Smart Investing & Trading Score: 33 | |
| Day Percent Change: -0.46% Day Change: -0.70 | |
| Week Change: -5.02% Year-to-date Change: 1.9% | |
| LEN Links: Profile News Message Board | |
| Charts:- Daily , Weekly | |
| Add LEN to Watchlist: View: Get LEN Trend Analysis ➞ | |
 | MAR Marriott International, Inc. |
| Sector: Services & Goods | |
| SubSector: Lodging | |
| MarketCap: 25831.6 Millions | |
| Recent Price: 238.46 Smart Investing & Trading Score: 13 | |
| Day Percent Change: -2.92% Day Change: -7.16 | |
| Week Change: -5.02% Year-to-date Change: 5.7% | |
| MAR Links: Profile News Message Board | |
| Charts:- Daily , Weekly | |
| Add MAR to Watchlist: View: Get MAR Trend Analysis ➞ | |
 | MU Micron Technology, Inc. |
| Sector: Technology | |
| SubSector: Semiconductor- Memory Chips | |
| MarketCap: 45188.4 Millions | |
| Recent Price: 116.33 Smart Investing & Trading Score: 36 | |
| Day Percent Change: -4.47% Day Change: -5.44 | |
| Week Change: -5.05% Year-to-date Change: 36.3% | |
| MU Links: Profile News Message Board | |
| Charts:- Daily , Weekly | |
| Add MU to Watchlist: View: Get MU Trend Analysis ➞ | |
 | EQIX Equinix, Inc. (REIT) |
| Sector: Financials | |
| SubSector: REIT - Diversified | |
| MarketCap: 45855.3 Millions | |
| Recent Price: 734.56 Smart Investing & Trading Score: 0 | |
| Day Percent Change: -1.02% Day Change: -7.58 | |
| Week Change: -5.07% Year-to-date Change: -8.8% | |
| EQIX Links: Profile News Message Board | |
| Charts:- Daily , Weekly | |
| Add EQIX to Watchlist: View: Get EQIX Trend Analysis ➞ | |
 | PODD Insulet Corporation |
| Sector: Health Care | |
| SubSector: Medical Instruments & Supplies | |
| MarketCap: 9313.2 Millions | |
| Recent Price: 166.26 Smart Investing & Trading Score: 17 | |
| Day Percent Change: -3.73% Day Change: -6.45 | |
| Week Change: -5.11% Year-to-date Change: -23.4% | |
| PODD Links: Profile News Message Board | |
| Charts:- Daily , Weekly | |
| Add PODD to Watchlist: View: Get PODD Trend Analysis ➞ | |
 | WY Weyerhaeuser Company |
| Sector: Industrials | |
| SubSector: Lumber, Wood Production | |
| MarketCap: 13244.8 Millions | |
| Recent Price: 31.52 Smart Investing & Trading Score: 0 | |
| Day Percent Change: -1.41% Day Change: -0.45 | |
| Week Change: -5.17% Year-to-date Change: -9.4% | |
| WY Links: Profile News Message Board | |
| Charts:- Daily , Weekly | |
| Add WY to Watchlist: View: Get WY Trend Analysis ➞ | |
 | MKTX MarketAxess Holdings Inc. |
| Sector: Financials | |
| SubSector: Investment Brokerage - National | |
| MarketCap: 12431.5 Millions | |
| Recent Price: 201.93 Smart Investing & Trading Score: 0 | |
| Day Percent Change: -0.41% Day Change: -0.84 | |
| Week Change: -5.2% Year-to-date Change: -31.1% | |
| MKTX Links: Profile News Message Board | |
| Charts:- Daily , Weekly | |
| Add MKTX to Watchlist: View: Get MKTX Trend Analysis ➞ | |
 | FTNT Fortinet, Inc. |
| Sector: Technology | |
| SubSector: Application Software | |
| MarketCap: 16993.8 Millions | |
| Recent Price: 64.66 Smart Investing & Trading Score: 23 | |
| Day Percent Change: 0.28% Day Change: 0.18 | |
| Week Change: -5.22% Year-to-date Change: 10.5% | |
| FTNT Links: Profile News Message Board | |
| Charts:- Daily , Weekly | |
| Add FTNT to Watchlist: View: Get FTNT Trend Analysis ➞ | |
 | SNPS Synopsys, Inc. |
| Sector: Technology | |
| SubSector: Semiconductor Equipment & Materials | |
| MarketCap: 18273.8 Millions | |
| Recent Price: 527.58 Smart Investing & Trading Score: 0 | |
| Day Percent Change: -2.50% Day Change: -13.51 | |
| Week Change: -5.31% Year-to-date Change: 2.5% | |
| SNPS Links: Profile News Message Board | |
| Charts:- Daily , Weekly | |
| Add SNPS to Watchlist: View: Get SNPS Trend Analysis ➞ | |
 | BLDR Builders FirstSource, Inc. |
| Sector: Industrials | |
| SubSector: General Building Materials | |
| MarketCap: 1714.63 Millions | |
| Recent Price: 179.31 Smart Investing & Trading Score: 43 | |
| Day Percent Change: -1.53% Day Change: -2.78 | |
| Week Change: -5.39% Year-to-date Change: 7.4% | |
| BLDR Links: Profile News Message Board | |
| Charts:- Daily , Weekly | |
| Add BLDR to Watchlist: View: Get BLDR Trend Analysis ➞ | |
 | CSGP CoStar Group, Inc. |
| Sector: Financials | |
| SubSector: Property Management | |
| MarketCap: 21454.4 Millions | |
| Recent Price: 85.46 Smart Investing & Trading Score: 36 | |
| Day Percent Change: -0.96% Day Change: -0.83 | |
| Week Change: -5.4% Year-to-date Change: -2.2% | |
| CSGP Links: Profile News Message Board | |
| Charts:- Daily , Weekly | |
| Add CSGP to Watchlist: View: Get CSGP Trend Analysis ➞ | |
 | IP International Paper Company |
| Sector: Consumer Staples | |
| SubSector: Packaging & Containers | |
| MarketCap: 13031.3 Millions | |
| Recent Price: 35.06 Smart Investing & Trading Score: 0 | |
| Day Percent Change: -2.37% Day Change: -0.85 | |
| Week Change: -5.6% Year-to-date Change: -3.0% | |
| IP Links: Profile News Message Board | |
| Charts:- Daily , Weekly | |
| Add IP to Watchlist: View: Get IP Trend Analysis ➞ | |
 | FFIV F5 Networks, Inc. |
| Sector: Technology | |
| SubSector: Business Software & Services | |
| MarketCap: 6675.38 Millions | |
| Recent Price: 181.30 Smart Investing & Trading Score: 0 | |
| Day Percent Change: -0.96% Day Change: -1.76 | |
| Week Change: -5.62% Year-to-date Change: 1.3% | |
| FFIV Links: Profile News Message Board | |
| Charts:- Daily , Weekly | |
| Add FFIV to Watchlist: View: Get FFIV Trend Analysis ➞ | |
 | PAYC Paycom Software, Inc. |
| Sector: Technology | |
| SubSector: Application Software | |
| MarketCap: 13041.6 Millions | |
| Recent Price: 186.86 Smart Investing & Trading Score: 10 | |
| Day Percent Change: -1.73% Day Change: -3.29 | |
| Week Change: -5.63% Year-to-date Change: -9.6% | |
| PAYC Links: Profile News Message Board | |
| Charts:- Daily , Weekly | |
| Add PAYC to Watchlist: View: Get PAYC Trend Analysis ➞ | |
 | AMD Advanced Micro Devices, Inc. |
| Sector: Technology | |
| SubSector: Semiconductor - Broad Line | |
| MarketCap: 54275.1 Millions | |
| Recent Price: 154.02 Smart Investing & Trading Score: 0 | |
| Day Percent Change: -5.78% Day Change: -9.44 | |
| Week Change: -5.67% Year-to-date Change: 4.5% | |
| AMD Links: Profile News Message Board | |
| Charts:- Daily , Weekly | |
| Add AMD to Watchlist: View: Get AMD Trend Analysis ➞ | |
 | URI United Rentals, Inc. |
| Sector: Transports | |
| SubSector: Rental & Leasing Services | |
| MarketCap: 6246.64 Millions | |
| Recent Price: 636.22 Smart Investing & Trading Score: 26 | |
| Day Percent Change: -3.01% Day Change: -19.75 | |
| Week Change: -5.72% Year-to-date Change: 11.0% | |
| URI Links: Profile News Message Board | |
| Charts:- Daily , Weekly | |
| Add URI to Watchlist: View: Get URI Trend Analysis ➞ | |
 | WAT Waters Corporation |
| Sector: Health Care | |
| SubSector: Medical Instruments & Supplies | |
| MarketCap: 11882 Millions | |
| Recent Price: 304.18 Smart Investing & Trading Score: 0 | |
| Day Percent Change: -3.04% Day Change: -9.54 | |
| Week Change: -5.73% Year-to-date Change: -7.6% | |
| WAT Links: Profile News Message Board | |
| Charts:- Daily , Weekly | |
| Add WAT to Watchlist: View: Get WAT Trend Analysis ➞ | |
 | TECH Bio-Techne Corporation |
| Sector: Health Care | |
| SubSector: Biotechnology | |
| MarketCap: 6958.05 Millions | |
| Recent Price: 62.73 Smart Investing & Trading Score: 10 | |
| Day Percent Change: -2.00% Day Change: -1.28 | |
| Week Change: -5.99% Year-to-date Change: -18.7% | |
| TECH Links: Profile News Message Board | |
| Charts:- Daily , Weekly | |
| Add TECH to Watchlist: View: Get TECH Trend Analysis ➞ | |
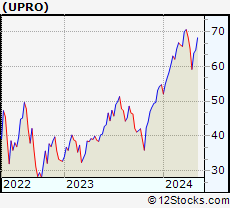 | UPRO ProShares UltraPro S&P500 |
| Sector: Utilities | |
| SubSector: Exchange Traded Fund | |
| MarketCap: 0 Millions | |
| Recent Price: 61.26 Smart Investing & Trading Score: 26 | |
| Day Percent Change: -1.78% Day Change: -1.11 | |
| Week Change: -6.04% Year-to-date Change: 11.9% | |
| UPRO Links: Profile News Message Board | |
| Charts:- Daily , Weekly | |
| Add UPRO to Watchlist: View: Get UPRO Trend Analysis ➞ | |
 | CRM salesforce.com, inc. |
| Sector: Technology | |
| SubSector: Application Software | |
| MarketCap: 137120 Millions | |
| Recent Price: 276.32 Smart Investing & Trading Score: 0 | |
| Day Percent Change: -0.39% Day Change: -1.09 | |
| Week Change: -6.12% Year-to-date Change: 5.0% | |
| CRM Links: Profile News Message Board | |
| Charts:- Daily , Weekly | |
| Add CRM to Watchlist: View: Get CRM Trend Analysis ➞ | |
 | HST Host Hotels & Resorts, Inc. |
| Sector: Financials | |
| SubSector: REIT - Hotel/Motel | |
| MarketCap: 8253.74 Millions | |
| Recent Price: 18.74 Smart Investing & Trading Score: 0 | |
| Day Percent Change: -1.78% Day Change: -0.34 | |
| Week Change: -6.3% Year-to-date Change: -3.8% | |
| HST Links: Profile News Message Board | |
| Charts:- Daily , Weekly | |
| Add HST to Watchlist: View: Get HST Trend Analysis ➞ | |
 | RMD ResMed Inc. |
| Sector: Health Care | |
| SubSector: Medical Instruments & Supplies | |
| MarketCap: 18660.2 Millions | |
| Recent Price: 173.83 Smart Investing & Trading Score: 10 | |
| Day Percent Change: -5.97% Day Change: -11.03 | |
| Week Change: -6.47% Year-to-date Change: 1.1% | |
| RMD Links: Profile News Message Board | |
| Charts:- Daily , Weekly | |
| Add RMD to Watchlist: View: Get RMD Trend Analysis ➞ | |
| For tabular summary view of above stock list: Summary View ➞ 0 - 25 , 25 - 50 , 50 - 75 , 75 - 100 , 100 - 125 , 125 - 150 , 150 - 175 , 175 - 200 , 200 - 225 , 225 - 250 , 250 - 275 , 275 - 300 , 300 - 325 , 325 - 350 , 350 - 375 , 375 - 400 , 400 - 425 , 425 - 450 , 450 - 475 , 475 - 500 | ||
| Click To Change The Sort Order: By Market Cap or Company Size Performance: Year-to-date, Week and Day | |
| Select Chart Type: | ||
|
Best Stocks Today 12Stocks.com |
© 2024 12Stocks.com Terms & Conditions Privacy Contact Us
All Information Provided Only For Education And Not To Be Used For Investing or Trading. See Terms & Conditions


One More Thing ... Get Best Stocks Delivered Daily!
Never Ever Miss A Move With Our Top Ten Stocks Lists
Find Best Stocks In Any Market - Bull or Bear Market
Take A Peek At Our Top Ten Stocks Lists: Daily, Weekly, Year-to-Date & Top Trends
Find Best Stocks In Any Market - Bull or Bear Market
Take A Peek At Our Top Ten Stocks Lists: Daily, Weekly, Year-to-Date & Top Trends
S&P 500 Stocks With Best Up Trends [0-bearish to 100-bullish]: United Airlines[100], Conagra Brands[95], Bunge [93], Charles Schwab[88], Lockheed Martin[86], Progressive [83], NextEra [81], Newmont [76], Google [75], Google [75], Yum! Brands[75]
Best S&P 500 Stocks Year-to-Date:
NVIDIA [69.69%], Constellation [58.3%], NRG [42.01%], Meta Platforms[39.59%], Marathon [36.47%], Micron [36.31%], Western Digital[33.99%], Progressive [31.29%], Diamondback [29.71%], Targa Resources[29.19%], Eaton [28.8%] Best S&P 500 Stocks This Week:
United Airlines[16.6%], UnitedHealth [9.06%], Globe Life[7.01%], ProShares UltraPro[6.34%], American Airlines[5.63%], Morgan Stanley[4.51%], Southwest Airlines[4.5%], Goldman Sachs[3.7%], Charles Schwab[3.53%], General Mills[3.49%], Humana [3.48%] Best S&P 500 Stocks Daily:
United Airlines[17.45%], American Airlines[6.60%], Globe Life[5.44%], NextEra [3.39%], Consolidated Edison[3.33%], Norwegian Cruise[3.15%], Dominion [3.12%], Southern [3.00%], Delta Air[2.86%], First Solar[2.85%], Southwest Airlines[2.60%]