
 Login Sign Up


| |||||
 |  | ||||

| 12Stocks.com Market Intelligence |
Best S&P 500 Stocks
|
On this page, you will find the most comprehensive analysis of S&P 500 stocks and ETFs - from latest trends to performances to charts ➞. First, here are the year-to-date (YTD) performances of the most requested S&P 500 stocks at 12Stocks.com (click stock for review):
| NVIDIA 71% | ||
| Caterpillar 21% | ||
| Amazon.com 18% | ||
| Merck 15% | ||
| Walmart 13% | ||
| Google 12% | ||
| Microsoft 8% | ||
| JPMorgan Chase 7% | ||
| Chevron 6% | ||
| Goldman Sachs 4% | ||
| Johnson & Johnson -7% | ||
| McDonald s -9% | ||
| Starbucks -9% | ||
| Apple -13% | ||
| Gilead -18% | ||
| Intel -30% | ||
| Boeing -35% | ||
| Quick: S&P 500 Stocks Lists: Performances & Trends, S&P 500 Stock Charts
Sort S&P 500 stocks: Daily, Weekly, Year-to-Date, Market Cap & Trends. Filter S&P 500 stocks list by sector: Show all, Tech, Finance, Energy, Staples, Retail, Industrial, Materials, Utilities and HealthCare |
| 12Stocks.com S&P 500 Stocks Performances & Trends Daily Report | |||||||||
|
| 
The overall Smart Investing & Trading Score is 36 (0-bearish to 100-bullish) which puts S&P 500 index in short term bearish to neutral trend. The Smart Investing & Trading Score from previous trading session is 26 and hence an improvement of trend. | ||||||||
Here are the Smart Investing & Trading Scores of the most requested S&P 500 stocks at 12Stocks.com (click stock name for detailed review):
|


| 12Stocks.com: Top Performing S&P 500 Index Stocks | ||||||||||||||||||||||||||||||||||||||||||||||||
 The top performing S&P 500 Index stocks year to date are
Now, more recently, over last week, the top performing S&P 500 Index stocks on the move are


|
||||||||||||||||||||||||||||||||||||||||||||||||
| 12Stocks.com: Investing in S&P 500 Index with Stocks | |
|
The following table helps investors and traders sort through current performance and trends (as measured by Smart Investing & Trading Score) of various
stocks in the S&P 500 Index. Quick View: Move mouse or cursor over stock symbol (ticker) to view short-term technical chart and over stock name to view long term chart. Click on  to add stock symbol to your watchlist and to add stock symbol to your watchlist and  to view watchlist. Click on any ticker or stock name for detailed market intelligence report for that stock. to view watchlist. Click on any ticker or stock name for detailed market intelligence report for that stock. |
12Stocks.com Performance of Stocks in S&P 500 Index
| Ticker | Stock Name | Watchlist | Category | Recent Price | Smart Investing & Trading Score | Change % | Weekly Change% |
| ROL | Rollins |   | Services & Goods | 42.44 | 0 | -1.33% | -4.31% |
| ALGN | Align | | Health Care | 301.34 | 53 | 0.40% | -4.33% |
| F | Ford Motor | | Consumer Staples | 12.06 | 46 | 0.17% | -4.36% |
| PSA | Public Storage | | Financials | 260.28 | 10 | -0.58% | -4.36% |
| ARE | Alexandria Real | | Financials | 116.51 | 20 | 0.05% | -4.37% |
| EQIX | Equinix | | Financials | 739.85 | 25 | 0.72% | -4.39% |
| TRMB | Trimble | | Technology | 57.86 | 31 | -1.08% | -4.43% |
| RMD | ResMed | | Health Care | 177.61 | 10 | 2.17% | -4.44% |
| PHM | Pulte | | Industrials | 105.96 | 36 | -0.18% | -4.45% |
| TTWO | Take-Two Interactive | | Technology | 140.64 | 0 | -1.76% | -4.50% |
| MHK | Mohawk Industries | | Consumer Staples | 108.08 | 36 | -0.18% | -4.50% |
| POOL | Pool | | Consumer Staples | 362.91 | 10 | -0.34% | -4.55% |
| AMT | American Tower | | Financials | 171.00 | 10 | -0.59% | -4.58% |
| NRG | NRG | | Utilities | 70.52 | 51 | -3.95% | -4.61% |
| EXR | Extra Space | | Financials | 134.20 | 10 | -1.40% | -4.61% |
| EPAM | EPAM Systems | | Technology | 247.22 | 0 | -0.71% | -4.61% |
| MKTX | MarketAxess Holdings | | Financials | 203.15 | 10 | 0.60% | -4.62% |
| LEN | Lennar | | Industrials | 152.49 | 43 | 0.40% | -4.63% |
| CBRE | CBRE | | Financials | 85.14 | 10 | 0.00% | -4.75% |
| TRV | Travelers | | Financials | 210.42 | 20 | 1.86% | -4.83% |
| NOW | ServiceNow | | Technology | 731.36 | 8 | -0.69% | -4.86% |
| KMX | CarMax | | Services & Goods | 67.91 | 10 | -0.90% | -4.90% |
| WYNN | Wynn Resorts | | Services & Goods | 96.10 | 26 | -1.42% | -5.02% |
| AMD | Advanced Micro | | Technology | 155.08 | 10 | 0.69% | -5.02% |
| IP | Paper | | Consumer Staples | 35.26 | 10 | 0.57% | -5.06% |
| For chart view version of above stock list: Chart View ➞ 0 - 25 , 25 - 50 , 50 - 75 , 75 - 100 , 100 - 125 , 125 - 150 , 150 - 175 , 175 - 200 , 200 - 225 , 225 - 250 , 250 - 275 , 275 - 300 , 300 - 325 , 325 - 350 , 350 - 375 , 375 - 400 , 400 - 425 , 425 - 450 , 450 - 475 , 475 - 500 | ||
 | Click To Change The Sort Order: By Market Cap or Company Size Performance: Year-to-date, Week and Day |  |
|
Get the most comprehensive stock market coverage daily at 12Stocks.com ➞ Best Stocks Today ➞ Best Stocks Weekly ➞ Best Stocks Year-to-Date ➞ Best Stocks Trends ➞  Best Stocks Today 12Stocks.com Best Nasdaq Stocks ➞ Best S&P 500 Stocks ➞ Best Tech Stocks ➞ Best Biotech Stocks ➞ |
| Detailed Overview of S&P 500 Stocks |
| S&P 500 Technical Overview, Leaders & Laggards, Top S&P 500 ETF Funds & Detailed S&P 500 Stocks List, Charts, Trends & More |
| S&P 500: Technical Analysis, Trends & YTD Performance | |
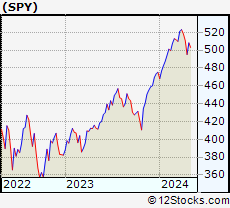
| S&P 500 index as represented by
SPY, an exchange-traded fund [ETF], holds basket of five hundred (mostly largecap) stocks from across all major sectors of the US stock market. The S&P 500 index (contains stocks like Apple and Exxon) is up by 5.09% and is currently outperforming the overall market by 0.9% year-to-date. Below is a quick view of technical charts and trends: | |
 SPY Weekly Chart |
|
| Long Term Trend: Good | |
| Medium Term Trend: Not Good | |
 SPY Daily Chart |
|
| Short Term Trend: Not Good | |
| Overall Trend Score: 36 | |
| YTD Performance: 5.09% | |
| **Trend Scores & Views Are Only For Educational Purposes And Not For Investing | |
| 12Stocks.com: Investing in S&P 500 Index using Exchange Traded Funds | |
|
The following table shows list of key exchange traded funds (ETF) that
help investors track S&P 500 index. The following list also includes leveraged ETF funds that track twice or thrice the daily returns of S&P 500 indices. Short or inverse ETF funds move in the opposite direction to the index they track and are useful during market pullbacks or during bear markets. Quick View: Move mouse or cursor over ETF symbol (ticker) to view short-term technical chart and over ETF name to view long term chart. Click on ticker or stock name for detailed view. Click on to add stock symbol to your watchlist and to view watchlist. |
12Stocks.com List of ETFs that track S&P 500 Index
| Ticker | ETF Name | Watchlist | Recent Price | Smart Investing & Trading Score | Change % | Week % | Year-to-date % |
| SPY | SPDR S&P 500 ETF | | 499.52 | 36 | -0.21 | -2.22 | 5.09% |
| IVV | iShares Core S&P 500 ETF | | 501.88 | 36 | -0.23 | -2.23 | 5.08% |
| VOO | Vanguard 500 ETF | | 458.94 | 36 | -0.23 | -2.26 | 5.07% |
| OEF | iShares S&P 100 | | 237.62 | 36 | -0.13 | -2.27 | 6.37% |
| SSO | ProShares Ultra S&P500 | | 70.33 | 36 | -0.47 | -4.52 | 8.08% |
| UPRO | ProShares UltraPro S&P500 | | 60.78 | 36 | -0.78 | -6.78 | 11.03% |
| SPXL | Direxion Daily S&P500 Bull 3X ETF | | 115.53 | 36 | -0.70 | -6.71 | 11.1% |
| SH | ProShares Short S&P500 | | 12.47 | 74 | 0.24 | 2.3 | -4% |
| SDS | ProShares UltraShort S&P500 | | 27.41 | 74 | 0.51 | 4.74 | -8.39% |
| SPXU | ProShares UltraPro Short S&P500 | | 37.33 | 69 | 0.70 | 7.09 | -13.19% |
| SPXS | Direxion Daily S&P 500 Bear 3X ETF | | 10.11 | 69 | 1.00 | 7.32 | -12.47% |
| 12Stocks.com: Charts, Trends, Fundamental Data and Performances of S&P 500 Stocks | |
|
We now take in-depth look at all S&P 500 stocks including charts, multi-period performances and overall trends (as measured by Smart Investing & Trading Score). One can sort S&P 500 stocks (click link to choose) by Daily, Weekly and by Year-to-Date performances. Also, one can sort by size of the company or by market capitalization. |
| Select Your Default Chart Type: | |||||
| |||||
| Click on stock symbol or name for detailed view. Click on to add stock symbol to your watchlist and to view watchlist. Quick View: Move mouse or cursor over "Daily" to quickly view daily technical stock chart and over "Weekly" to view weekly technical stock chart. | |||||

 | ROL Rollins, Inc. |
| Sector: Services & Goods | |
| SubSector: Business Services | |
| MarketCap: 12827.4 Millions | |
| Recent Price: 42.44 Smart Investing & Trading Score: 0 | |
| Day Percent Change: -1.33% Day Change: -0.57 | |
| Week Change: -4.31% Year-to-date Change: -2.8% | |
| ROL Links: Profile News Message Board | |
| Charts:- Daily , Weekly | |
| Add ROL to Watchlist: View: Get ROL Trend Analysis ➞ | |
 | ALGN Align Technology, Inc. |
| Sector: Health Care | |
| SubSector: Medical Appliances & Equipment | |
| MarketCap: 12802 Millions | |
| Recent Price: 301.34 Smart Investing & Trading Score: 53 | |
| Day Percent Change: 0.40% Day Change: 1.20 | |
| Week Change: -4.33% Year-to-date Change: 10.0% | |
| ALGN Links: Profile News Message Board | |
| Charts:- Daily , Weekly | |
| Add ALGN to Watchlist: View: Get ALGN Trend Analysis ➞ | |
 | F Ford Motor Company |
| Sector: Consumer Staples | |
| SubSector: Auto Manufacturers - Major | |
| MarketCap: 19052.1 Millions | |
| Recent Price: 12.06 Smart Investing & Trading Score: 46 | |
| Day Percent Change: 0.17% Day Change: 0.02 | |
| Week Change: -4.36% Year-to-date Change: -1.1% | |
| F Links: Profile News Message Board | |
| Charts:- Daily , Weekly | |
| Add F to Watchlist: View: Get F Trend Analysis ➞ | |
 | PSA Public Storage |
| Sector: Financials | |
| SubSector: REIT - Industrial | |
| MarketCap: 32733.9 Millions | |
| Recent Price: 260.28 Smart Investing & Trading Score: 10 | |
| Day Percent Change: -0.58% Day Change: -1.53 | |
| Week Change: -4.36% Year-to-date Change: -14.7% | |
| PSA Links: Profile News Message Board | |
| Charts:- Daily , Weekly | |
| Add PSA to Watchlist: View: Get PSA Trend Analysis ➞ | |
 | ARE Alexandria Real Estate Equities, Inc. |
| Sector: Financials | |
| SubSector: REIT - Office | |
| MarketCap: 16793.6 Millions | |
| Recent Price: 116.51 Smart Investing & Trading Score: 20 | |
| Day Percent Change: 0.05% Day Change: 0.06 | |
| Week Change: -4.37% Year-to-date Change: -8.1% | |
| ARE Links: Profile News Message Board | |
| Charts:- Daily , Weekly | |
| Add ARE to Watchlist: View: Get ARE Trend Analysis ➞ | |
 | EQIX Equinix, Inc. (REIT) |
| Sector: Financials | |
| SubSector: REIT - Diversified | |
| MarketCap: 45855.3 Millions | |
| Recent Price: 739.85 Smart Investing & Trading Score: 25 | |
| Day Percent Change: 0.72% Day Change: 5.29 | |
| Week Change: -4.39% Year-to-date Change: -8.1% | |
| EQIX Links: Profile News Message Board | |
| Charts:- Daily , Weekly | |
| Add EQIX to Watchlist: View: Get EQIX Trend Analysis ➞ | |
 | TRMB Trimble Inc. |
| Sector: Technology | |
| SubSector: Scientific & Technical Instruments | |
| MarketCap: 7990.33 Millions | |
| Recent Price: 57.86 Smart Investing & Trading Score: 31 | |
| Day Percent Change: -1.08% Day Change: -0.63 | |
| Week Change: -4.43% Year-to-date Change: 8.8% | |
| TRMB Links: Profile News Message Board | |
| Charts:- Daily , Weekly | |
| Add TRMB to Watchlist: View: Get TRMB Trend Analysis ➞ | |
 | RMD ResMed Inc. |
| Sector: Health Care | |
| SubSector: Medical Instruments & Supplies | |
| MarketCap: 18660.2 Millions | |
| Recent Price: 177.61 Smart Investing & Trading Score: 10 | |
| Day Percent Change: 2.17% Day Change: 3.78 | |
| Week Change: -4.44% Year-to-date Change: 3.3% | |
| RMD Links: Profile News Message Board | |
| Charts:- Daily , Weekly | |
| Add RMD to Watchlist: View: Get RMD Trend Analysis ➞ | |
 | PHM PulteGroup, Inc. |
| Sector: Industrials | |
| SubSector: Residential Construction | |
| MarketCap: 6186.46 Millions | |
| Recent Price: 105.96 Smart Investing & Trading Score: 36 | |
| Day Percent Change: -0.18% Day Change: -0.19 | |
| Week Change: -4.45% Year-to-date Change: 2.7% | |
| PHM Links: Profile News Message Board | |
| Charts:- Daily , Weekly | |
| Add PHM to Watchlist: View: Get PHM Trend Analysis ➞ | |
 | TTWO Take-Two Interactive Software, Inc. |
| Sector: Technology | |
| SubSector: Multimedia & Graphics Software | |
| MarketCap: 12479.6 Millions | |
| Recent Price: 140.64 Smart Investing & Trading Score: 0 | |
| Day Percent Change: -1.76% Day Change: -2.52 | |
| Week Change: -4.5% Year-to-date Change: -12.6% | |
| TTWO Links: Profile News Message Board | |
| Charts:- Daily , Weekly | |
| Add TTWO to Watchlist: View: Get TTWO Trend Analysis ➞ | |
 | MHK Mohawk Industries, Inc. |
| Sector: Consumer Staples | |
| SubSector: Home Furnishings & Fixtures | |
| MarketCap: 4682.25 Millions | |
| Recent Price: 108.08 Smart Investing & Trading Score: 36 | |
| Day Percent Change: -0.18% Day Change: -0.19 | |
| Week Change: -4.5% Year-to-date Change: 4.4% | |
| MHK Links: Profile News Message Board | |
| Charts:- Daily , Weekly | |
| Add MHK to Watchlist: View: Get MHK Trend Analysis ➞ | |
 | POOL Pool Corporation |
| Sector: Consumer Staples | |
| SubSector: Sporting Goods | |
| MarketCap: 7479.64 Millions | |
| Recent Price: 362.91 Smart Investing & Trading Score: 10 | |
| Day Percent Change: -0.34% Day Change: -1.24 | |
| Week Change: -4.55% Year-to-date Change: -9.0% | |
| POOL Links: Profile News Message Board | |
| Charts:- Daily , Weekly | |
| Add POOL to Watchlist: View: Get POOL Trend Analysis ➞ | |
 | AMT American Tower Corporation (REIT) |
| Sector: Financials | |
| SubSector: REIT - Diversified | |
| MarketCap: 92527 Millions | |
| Recent Price: 171.00 Smart Investing & Trading Score: 10 | |
| Day Percent Change: -0.59% Day Change: -1.02 | |
| Week Change: -4.58% Year-to-date Change: -20.8% | |
| AMT Links: Profile News Message Board | |
| Charts:- Daily , Weekly | |
| Add AMT to Watchlist: View: Get AMT Trend Analysis ➞ | |
 | NRG NRG Energy, Inc. |
| Sector: Utilities | |
| SubSector: Diversified Utilities | |
| MarketCap: 6510.7 Millions | |
| Recent Price: 70.52 Smart Investing & Trading Score: 51 | |
| Day Percent Change: -3.95% Day Change: -2.90 | |
| Week Change: -4.61% Year-to-date Change: 36.4% | |
| NRG Links: Profile News Message Board | |
| Charts:- Daily , Weekly | |
| Add NRG to Watchlist: View: Get NRG Trend Analysis ➞ | |
 | EXR Extra Space Storage Inc. |
| Sector: Financials | |
| SubSector: REIT - Industrial | |
| MarketCap: 11203.9 Millions | |
| Recent Price: 134.20 Smart Investing & Trading Score: 10 | |
| Day Percent Change: -1.40% Day Change: -1.90 | |
| Week Change: -4.61% Year-to-date Change: -16.3% | |
| EXR Links: Profile News Message Board | |
| Charts:- Daily , Weekly | |
| Add EXR to Watchlist: View: Get EXR Trend Analysis ➞ | |
 | EPAM EPAM Systems, Inc. |
| Sector: Technology | |
| SubSector: Information Technology Services | |
| MarketCap: 11519.6 Millions | |
| Recent Price: 247.22 Smart Investing & Trading Score: 0 | |
| Day Percent Change: -0.71% Day Change: -1.78 | |
| Week Change: -4.61% Year-to-date Change: -16.9% | |
| EPAM Links: Profile News Message Board | |
| Charts:- Daily , Weekly | |
| Add EPAM to Watchlist: View: Get EPAM Trend Analysis ➞ | |
 | MKTX MarketAxess Holdings Inc. |
| Sector: Financials | |
| SubSector: Investment Brokerage - National | |
| MarketCap: 12431.5 Millions | |
| Recent Price: 203.15 Smart Investing & Trading Score: 10 | |
| Day Percent Change: 0.60% Day Change: 1.22 | |
| Week Change: -4.62% Year-to-date Change: -30.6% | |
| MKTX Links: Profile News Message Board | |
| Charts:- Daily , Weekly | |
| Add MKTX to Watchlist: View: Get MKTX Trend Analysis ➞ | |
 | LEN Lennar Corporation |
| Sector: Industrials | |
| SubSector: Residential Construction | |
| MarketCap: 11926.6 Millions | |
| Recent Price: 152.49 Smart Investing & Trading Score: 43 | |
| Day Percent Change: 0.40% Day Change: 0.61 | |
| Week Change: -4.63% Year-to-date Change: 2.3% | |
| LEN Links: Profile News Message Board | |
| Charts:- Daily , Weekly | |
| Add LEN to Watchlist: View: Get LEN Trend Analysis ➞ | |
 | CBRE CBRE Group, Inc. |
| Sector: Financials | |
| SubSector: Property Management | |
| MarketCap: 12799.2 Millions | |
| Recent Price: 85.14 Smart Investing & Trading Score: 10 | |
| Day Percent Change: 0.00% Day Change: 0.00 | |
| Week Change: -4.75% Year-to-date Change: -8.5% | |
| CBRE Links: Profile News Message Board | |
| Charts:- Daily , Weekly | |
| Add CBRE to Watchlist: View: Get CBRE Trend Analysis ➞ | |
 | TRV The Travelers Companies, Inc. |
| Sector: Financials | |
| SubSector: Property & Casualty Insurance | |
| MarketCap: 25155.9 Millions | |
| Recent Price: 210.42 Smart Investing & Trading Score: 20 | |
| Day Percent Change: 1.86% Day Change: 3.84 | |
| Week Change: -4.83% Year-to-date Change: 10.5% | |
| TRV Links: Profile News Message Board | |
| Charts:- Daily , Weekly | |
| Add TRV to Watchlist: View: Get TRV Trend Analysis ➞ | |
 | NOW ServiceNow, Inc. |
| Sector: Technology | |
| SubSector: Information Technology Services | |
| MarketCap: 53599.1 Millions | |
| Recent Price: 731.36 Smart Investing & Trading Score: 8 | |
| Day Percent Change: -0.69% Day Change: -5.09 | |
| Week Change: -4.86% Year-to-date Change: 3.5% | |
| NOW Links: Profile News Message Board | |
| Charts:- Daily , Weekly | |
| Add NOW to Watchlist: View: Get NOW Trend Analysis ➞ | |
 | KMX CarMax, Inc. |
| Sector: Services & Goods | |
| SubSector: Auto Dealerships | |
| MarketCap: 8121.71 Millions | |
| Recent Price: 67.91 Smart Investing & Trading Score: 10 | |
| Day Percent Change: -0.90% Day Change: -0.62 | |
| Week Change: -4.9% Year-to-date Change: -11.5% | |
| KMX Links: Profile News Message Board | |
| Charts:- Daily , Weekly | |
| Add KMX to Watchlist: View: Get KMX Trend Analysis ➞ | |
 | WYNN Wynn Resorts, Limited |
| Sector: Services & Goods | |
| SubSector: Resorts & Casinos | |
| MarketCap: 6643.34 Millions | |
| Recent Price: 96.10 Smart Investing & Trading Score: 26 | |
| Day Percent Change: -1.42% Day Change: -1.38 | |
| Week Change: -5.02% Year-to-date Change: 5.5% | |
| WYNN Links: Profile News Message Board | |
| Charts:- Daily , Weekly | |
| Add WYNN to Watchlist: View: Get WYNN Trend Analysis ➞ | |
 | AMD Advanced Micro Devices, Inc. |
| Sector: Technology | |
| SubSector: Semiconductor - Broad Line | |
| MarketCap: 54275.1 Millions | |
| Recent Price: 155.08 Smart Investing & Trading Score: 10 | |
| Day Percent Change: 0.69% Day Change: 1.06 | |
| Week Change: -5.02% Year-to-date Change: 5.2% | |
| AMD Links: Profile News Message Board | |
| Charts:- Daily , Weekly | |
| Add AMD to Watchlist: View: Get AMD Trend Analysis ➞ | |
 | IP International Paper Company |
| Sector: Consumer Staples | |
| SubSector: Packaging & Containers | |
| MarketCap: 13031.3 Millions | |
| Recent Price: 35.26 Smart Investing & Trading Score: 10 | |
| Day Percent Change: 0.57% Day Change: 0.20 | |
| Week Change: -5.06% Year-to-date Change: -2.5% | |
| IP Links: Profile News Message Board | |
| Charts:- Daily , Weekly | |
| Add IP to Watchlist: View: Get IP Trend Analysis ➞ | |
| For tabular summary view of above stock list: Summary View ➞ 0 - 25 , 25 - 50 , 50 - 75 , 75 - 100 , 100 - 125 , 125 - 150 , 150 - 175 , 175 - 200 , 200 - 225 , 225 - 250 , 250 - 275 , 275 - 300 , 300 - 325 , 325 - 350 , 350 - 375 , 375 - 400 , 400 - 425 , 425 - 450 , 450 - 475 , 475 - 500 | ||
| Click To Change The Sort Order: By Market Cap or Company Size Performance: Year-to-date, Week and Day | |
| Select Chart Type: | ||
|
Best Stocks Today 12Stocks.com |
© 2024 12Stocks.com Terms & Conditions Privacy Contact Us
All Information Provided Only For Education And Not To Be Used For Investing or Trading. See Terms & Conditions


One More Thing ... Get Best Stocks Delivered Daily!
Never Ever Miss A Move With Our Top Ten Stocks Lists
Find Best Stocks In Any Market - Bull or Bear Market
Take A Peek At Our Top Ten Stocks Lists: Daily, Weekly, Year-to-Date & Top Trends
Find Best Stocks In Any Market - Bull or Bear Market
Take A Peek At Our Top Ten Stocks Lists: Daily, Weekly, Year-to-Date & Top Trends
S&P 500 Stocks With Best Up Trends [0-bearish to 100-bullish]: Genuine Parts[100], United Airlines[100], Generac Holdings[93], Bunge [93], Charles Schwab[93], Conagra Brands[93], Wells Fargo[90], PepsiCo [85], Lockheed Martin[85], Constellation [83], Progressive [83]
Best S&P 500 Stocks Year-to-Date:
NVIDIA [70.98%], Constellation [59.78%], Meta Platforms[41.76%], NRG [36.4%], Progressive [31.69%], Marathon [31.45%], Micron [31.16%], Western Digital[30.46%], Diamondback [28.71%], Targa Resources[28.68%], Eaton [28.29%] Best S&P 500 Stocks This Week:
United Airlines[23.01%], UnitedHealth [12.29%], Genuine Parts[10.21%], Globe Life[10%], ProShares UltraPro[7.09%], American Airlines[6.62%], Southwest Airlines[5.52%], Morgan Stanley[4.72%], V.F [4.62%], General Mills[4.37%], Estee Lauder[4.33%] Best S&P 500 Stocks Daily:
Genuine Parts[11.22%], United Airlines[5.50%], Estee Lauder[4.90%], Allstate [3.80%], Discover Financial[3.65%], Capital One[3.55%], V.F [3.43%], UnitedHealth [2.96%], Synchrony Financial[2.82%], Globe Life[2.80%], Wells Fargo[2.73%]