
 Login Sign Up


| |||||
 |  | ||||

| 12Stocks.com Market Intelligence |
Best S&P 500 Stocks
|
On this page, you will find the most comprehensive analysis of S&P 500 stocks and ETFs - from latest trends to performances to charts ➞. First, here are the year-to-date (YTD) performances of the most requested S&P 500 stocks at 12Stocks.com (click stock for review):
| NVIDIA 67% | ||
| Merck 19% | ||
| Caterpillar 15% | ||
| Walmart 14% | ||
| Amazon.com 13% | ||
| JPMorgan Chase 13% | ||
| Google 11% | ||
| Chevron 10% | ||
| Goldman Sachs 8% | ||
| Microsoft 5% | ||
| Johnson & Johnson -6% | ||
| McDonald s -7% | ||
| Starbucks -9% | ||
| Apple -12% | ||
| Gilead -19% | ||
| Intel -30% | ||
| Boeing -36% | ||
| Quick: S&P 500 Stocks Lists: Performances & Trends, S&P 500 Stock Charts
Sort S&P 500 stocks: Daily, Weekly, Year-to-Date, Market Cap & Trends. Filter S&P 500 stocks list by sector: Show all, Tech, Finance, Energy, Staples, Retail, Industrial, Materials, Utilities and HealthCare |
| 12Stocks.com S&P 500 Stocks Performances & Trends Daily Report | |||||||||
|
| 
The overall Smart Investing & Trading Score is 44 (0-bearish to 100-bullish) which puts S&P 500 index in short term neutral trend. The Smart Investing & Trading Score from previous trading session is 58 and hence a deterioration of trend. | ||||||||
Here are the Smart Investing & Trading Scores of the most requested S&P 500 stocks at 12Stocks.com (click stock name for detailed review):
|


| 12Stocks.com: Top Performing S&P 500 Index Stocks | ||||||||||||||||||||||||||||||||||||||||||||||||
 The top performing S&P 500 Index stocks year to date are
Now, more recently, over last week, the top performing S&P 500 Index stocks on the move are


|
||||||||||||||||||||||||||||||||||||||||||||||||
| 12Stocks.com: Investing in S&P 500 Index with Stocks | |
|
The following table helps investors and traders sort through current performance and trends (as measured by Smart Investing & Trading Score) of various
stocks in the S&P 500 Index. Quick View: Move mouse or cursor over stock symbol (ticker) to view short-term technical chart and over stock name to view long term chart. Click on  to add stock symbol to your watchlist and to add stock symbol to your watchlist and  to view watchlist. Click on any ticker or stock name for detailed market intelligence report for that stock. to view watchlist. Click on any ticker or stock name for detailed market intelligence report for that stock. |
12Stocks.com Performance of Stocks in S&P 500 Index
| Ticker | Stock Name | Watchlist | Category | Recent Price | Smart Investing & Trading Score | Change % | Weekly Change% |
| FIS | Fidelity National |   | Technology | 70.29 | 36 | -0.73% | -0.62% |
| ABT | Abbott | | Health Care | 106.60 | 25 | -0.27% | -0.63% |
| ALL | Allstate | | Financials | 171.87 | 51 | -0.23% | -0.63% |
| MMC | Marsh & McLennan | | Financials | 201.07 | 44 | 0.06% | -0.66% |
| MSFT | Microsoft | | Technology | 396.48 | 13 | -3.08% | -0.66% |
| PSA | Public Storage | | Financials | 258.63 | 10 | -1.35% | -0.67% |
| FDX | FedEx | | Transports | 265.21 | 43 | -0.32% | -0.67% |
| JNJ | Johnson & Johnson | | Health Care | 146.90 | 7 | -1.10% | -0.68% |
| ADSK | Autodesk | | Technology | 215.00 | 10 | 0.00% | -0.69% |
| NKE | NIKE | | Consumer Staples | 93.82 | 40 | -0.87% | -0.75% |
| DLTR | Dollar Tree | | Services & Goods | 121.10 | 18 | -1.05% | -0.76% |
| NOW | ServiceNow | | Technology | 708.45 | 0 | -5.07% | -0.76% |
| HON | Honeywell | | Industrials | 192.76 | 0 | -1.04% | -0.77% |
| SWK | Stanley Black | | Industrials | 88.63 | 10 | -1.82% | -0.77% |
| NSC | Norfolk Southern | | Transports | 239.41 | 41 | 1.35% | -0.78% |
| CDNS | Cadence Design | | Technology | 277.93 | 10 | 0.10% | -0.83% |
| CTVA | Corteva | | Materials | 54.34 | 53 | -0.78% | -0.83% |
| FCX | Freeport-McMoRan | | Materials | 49.19 | 68 | 1.97% | -0.85% |
| DD | DuPont de | | Materials | 73.26 | 46 | -0.95% | -0.85% |
| SLB | Schlumberger | | Energy | 49.41 | 44 | 0.62% | -0.87% |
| ITW | Illinois Tool | | Industrials | 248.23 | 18 | -1.40% | -0.89% |
| FMC | FMC | | Materials | 57.30 | 53 | -1.88% | -0.90% |
| CSX | CSX | | Transports | 34.02 | 10 | 1.04% | -0.93% |
| ROST | Ross Stores | | Services & Goods | 132.00 | 10 | -0.46% | -1.01% |
| EXPD | Expeditors | | Transports | 113.44 | 18 | 0.51% | -1.02% |
| For chart view version of above stock list: Chart View ➞ 0 - 25 , 25 - 50 , 50 - 75 , 75 - 100 , 100 - 125 , 125 - 150 , 150 - 175 , 175 - 200 , 200 - 225 , 225 - 250 , 250 - 275 , 275 - 300 , 300 - 325 , 325 - 350 , 350 - 375 , 375 - 400 , 400 - 425 , 425 - 450 , 450 - 475 , 475 - 500 | ||
 | Click To Change The Sort Order: By Market Cap or Company Size Performance: Year-to-date, Week and Day |  |
|
Get the most comprehensive stock market coverage daily at 12Stocks.com ➞ Best Stocks Today ➞ Best Stocks Weekly ➞ Best Stocks Year-to-Date ➞ Best Stocks Trends ➞  Best Stocks Today 12Stocks.com Best Nasdaq Stocks ➞ Best S&P 500 Stocks ➞ Best Tech Stocks ➞ Best Biotech Stocks ➞ |
| Detailed Overview of S&P 500 Stocks |
| S&P 500 Technical Overview, Leaders & Laggards, Top S&P 500 ETF Funds & Detailed S&P 500 Stocks List, Charts, Trends & More |
| S&P 500: Technical Analysis, Trends & YTD Performance | |
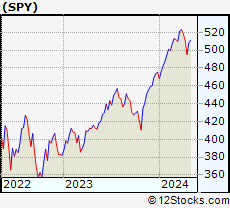
| S&P 500 index as represented by
SPY, an exchange-traded fund [ETF], holds basket of five hundred (mostly largecap) stocks from across all major sectors of the US stock market. The S&P 500 index (contains stocks like Apple and Exxon) is up by 5.58% and is currently outperforming the overall market by 0.73% year-to-date. Below is a quick view of technical charts and trends: | |
 SPY Weekly Chart |
|
| Long Term Trend: Good | |
| Medium Term Trend: Not Good | |
 SPY Daily Chart |
|
| Short Term Trend: Very Good | |
| Overall Trend Score: 44 | |
| YTD Performance: 5.58% | |
| **Trend Scores & Views Are Only For Educational Purposes And Not For Investing | |
| 12Stocks.com: Investing in S&P 500 Index using Exchange Traded Funds | |
|
The following table shows list of key exchange traded funds (ETF) that
help investors track S&P 500 index. The following list also includes leveraged ETF funds that track twice or thrice the daily returns of S&P 500 indices. Short or inverse ETF funds move in the opposite direction to the index they track and are useful during market pullbacks or during bear markets. Quick View: Move mouse or cursor over ETF symbol (ticker) to view short-term technical chart and over ETF name to view long term chart. Click on ticker or stock name for detailed view. Click on to add stock symbol to your watchlist and to view watchlist. |
12Stocks.com List of ETFs that track S&P 500 Index
| Ticker | ETF Name | Watchlist | Recent Price | Smart Investing & Trading Score | Change % | Week % | Year-to-date % |
| SPY | SPDR S&P 500 ETF | | 501.85 | 44 | -0.70 | 1.35 | 5.58% |
| IVV | iShares Core S&P 500 ETF | | 504.31 | 56 | -0.72 | 1.36 | 5.59% |
| VOO | Vanguard 500 ETF | | 461.49 | 56 | -0.65 | 1.4 | 5.65% |
| OEF | iShares S&P 100 | | 237.51 | 44 | -0.95 | 1.21 | 6.32% |
| SSO | ProShares Ultra S&P500 | | 70.96 | 51 | -1.38 | 2.68 | 9.05% |
| UPRO | ProShares UltraPro S&P500 | | 61.44 | 51 | -2.29 | 3.85 | 12.24% |
| SPXL | Direxion Daily S&P500 Bull 3X ETF | | 116.75 | 56 | -2.18 | 3.73 | 12.27% |
| SH | ProShares Short S&P500 | | 12.43 | 57 | 0.81 | -1.27 | -4.31% |
| SDS | ProShares UltraShort S&P500 | | 27.20 | 49 | 1.49 | -2.51 | -9.09% |
| SPXU | ProShares UltraPro Short S&P500 | | 36.82 | 49 | 2.16 | -3.94 | -14.37% |
| SPXS | Direxion Daily S&P 500 Bear 3X ETF | | 9.98 | 32 | 2.36 | -3.67 | -13.59% |
| 12Stocks.com: Charts, Trends, Fundamental Data and Performances of S&P 500 Stocks | |
|
We now take in-depth look at all S&P 500 stocks including charts, multi-period performances and overall trends (as measured by Smart Investing & Trading Score). One can sort S&P 500 stocks (click link to choose) by Daily, Weekly and by Year-to-Date performances. Also, one can sort by size of the company or by market capitalization. |
| Select Your Default Chart Type: | |||||
| |||||
| Click on stock symbol or name for detailed view. Click on to add stock symbol to your watchlist and to view watchlist. Quick View: Move mouse or cursor over "Daily" to quickly view daily technical stock chart and over "Weekly" to view weekly technical stock chart. | |||||

 | FIS Fidelity National Information Services, Inc. |
| Sector: Technology | |
| SubSector: Information Technology Services | |
| MarketCap: 71126.8 Millions | |
| Recent Price: 70.29 Smart Investing & Trading Score: 36 | |
| Day Percent Change: -0.73% Day Change: -0.52 | |
| Week Change: -0.62% Year-to-date Change: 17.0% | |
| FIS Links: Profile News Message Board | |
| Charts:- Daily , Weekly | |
| Add FIS to Watchlist: View: Get FIS Trend Analysis ➞ | |
 | ABT Abbott Laboratories |
| Sector: Health Care | |
| SubSector: Medical Appliances & Equipment | |
| MarketCap: 125288 Millions | |
| Recent Price: 106.60 Smart Investing & Trading Score: 25 | |
| Day Percent Change: -0.27% Day Change: -0.29 | |
| Week Change: -0.63% Year-to-date Change: -3.2% | |
| ABT Links: Profile News Message Board | |
| Charts:- Daily , Weekly | |
| Add ABT to Watchlist: View: Get ABT Trend Analysis ➞ | |
 | ALL The Allstate Corporation |
| Sector: Financials | |
| SubSector: Property & Casualty Insurance | |
| MarketCap: 25916.6 Millions | |
| Recent Price: 171.87 Smart Investing & Trading Score: 51 | |
| Day Percent Change: -0.23% Day Change: -0.40 | |
| Week Change: -0.63% Year-to-date Change: 22.8% | |
| ALL Links: Profile News Message Board | |
| Charts:- Daily , Weekly | |
| Add ALL to Watchlist: View: Get ALL Trend Analysis ➞ | |
 | MMC Marsh & McLennan Companies, Inc. |
| Sector: Financials | |
| SubSector: Insurance Brokers | |
| MarketCap: 42821.8 Millions | |
| Recent Price: 201.07 Smart Investing & Trading Score: 44 | |
| Day Percent Change: 0.06% Day Change: 0.12 | |
| Week Change: -0.66% Year-to-date Change: 6.1% | |
| MMC Links: Profile News Message Board | |
| Charts:- Daily , Weekly | |
| Add MMC to Watchlist: View: Get MMC Trend Analysis ➞ | |
 | MSFT Microsoft Corporation |
| Sector: Technology | |
| SubSector: Business Software & Services | |
| MarketCap: 1154150 Millions | |
| Recent Price: 396.48 Smart Investing & Trading Score: 13 | |
| Day Percent Change: -3.08% Day Change: -12.58 | |
| Week Change: -0.66% Year-to-date Change: 5.4% | |
| MSFT Links: Profile News Message Board | |
| Charts:- Daily , Weekly | |
| Add MSFT to Watchlist: View: Get MSFT Trend Analysis ➞ | |
 | PSA Public Storage |
| Sector: Financials | |
| SubSector: REIT - Industrial | |
| MarketCap: 32733.9 Millions | |
| Recent Price: 258.63 Smart Investing & Trading Score: 10 | |
| Day Percent Change: -1.35% Day Change: -3.54 | |
| Week Change: -0.67% Year-to-date Change: -15.2% | |
| PSA Links: Profile News Message Board | |
| Charts:- Daily , Weekly | |
| Add PSA to Watchlist: View: Get PSA Trend Analysis ➞ | |
 | FDX FedEx Corporation |
| Sector: Transports | |
| SubSector: Air Delivery & Freight Services | |
| MarketCap: 33188 Millions | |
| Recent Price: 265.21 Smart Investing & Trading Score: 43 | |
| Day Percent Change: -0.32% Day Change: -0.86 | |
| Week Change: -0.67% Year-to-date Change: 4.8% | |
| FDX Links: Profile News Message Board | |
| Charts:- Daily , Weekly | |
| Add FDX to Watchlist: View: Get FDX Trend Analysis ➞ | |
 | JNJ Johnson & Johnson |
| Sector: Health Care | |
| SubSector: Drug Manufacturers - Major | |
| MarketCap: 331972 Millions | |
| Recent Price: 146.90 Smart Investing & Trading Score: 7 | |
| Day Percent Change: -1.10% Day Change: -1.63 | |
| Week Change: -0.68% Year-to-date Change: -6.3% | |
| JNJ Links: Profile News Message Board | |
| Charts:- Daily , Weekly | |
| Add JNJ to Watchlist: View: Get JNJ Trend Analysis ➞ | |
 | ADSK Autodesk, Inc. |
| Sector: Technology | |
| SubSector: Technical & System Software | |
| MarketCap: 36975.8 Millions | |
| Recent Price: 215.00 Smart Investing & Trading Score: 10 | |
| Day Percent Change: 0.00% Day Change: 0.00 | |
| Week Change: -0.69% Year-to-date Change: -11.7% | |
| ADSK Links: Profile News Message Board | |
| Charts:- Daily , Weekly | |
| Add ADSK to Watchlist: View: Get ADSK Trend Analysis ➞ | |
 | NKE NIKE, Inc. |
| Sector: Consumer Staples | |
| SubSector: Textile - Apparel Footwear & Accessories | |
| MarketCap: 118918 Millions | |
| Recent Price: 93.82 Smart Investing & Trading Score: 40 | |
| Day Percent Change: -0.87% Day Change: -0.82 | |
| Week Change: -0.75% Year-to-date Change: -13.6% | |
| NKE Links: Profile News Message Board | |
| Charts:- Daily , Weekly | |
| Add NKE to Watchlist: View: Get NKE Trend Analysis ➞ | |
 | DLTR Dollar Tree, Inc. |
| Sector: Services & Goods | |
| SubSector: Discount, Variety Stores | |
| MarketCap: 21383.2 Millions | |
| Recent Price: 121.10 Smart Investing & Trading Score: 18 | |
| Day Percent Change: -1.05% Day Change: -1.29 | |
| Week Change: -0.76% Year-to-date Change: -14.8% | |
| DLTR Links: Profile News Message Board | |
| Charts:- Daily , Weekly | |
| Add DLTR to Watchlist: View: Get DLTR Trend Analysis ➞ | |
 | NOW ServiceNow, Inc. |
| Sector: Technology | |
| SubSector: Information Technology Services | |
| MarketCap: 53599.1 Millions | |
| Recent Price: 708.45 Smart Investing & Trading Score: 0 | |
| Day Percent Change: -5.07% Day Change: -37.84 | |
| Week Change: -0.76% Year-to-date Change: 0.3% | |
| NOW Links: Profile News Message Board | |
| Charts:- Daily , Weekly | |
| Add NOW to Watchlist: View: Get NOW Trend Analysis ➞ | |
 | HON Honeywell International Inc. |
| Sector: Industrials | |
| SubSector: Diversified Machinery | |
| MarketCap: 91189.1 Millions | |
| Recent Price: 192.76 Smart Investing & Trading Score: 0 | |
| Day Percent Change: -1.04% Day Change: -2.03 | |
| Week Change: -0.77% Year-to-date Change: -8.1% | |
| HON Links: Profile News Message Board | |
| Charts:- Daily , Weekly | |
| Add HON to Watchlist: View: Get HON Trend Analysis ➞ | |
 | SWK Stanley Black & Decker, Inc. |
| Sector: Industrials | |
| SubSector: Machine Tools & Accessories | |
| MarketCap: 14274.8 Millions | |
| Recent Price: 88.63 Smart Investing & Trading Score: 10 | |
| Day Percent Change: -1.82% Day Change: -1.64 | |
| Week Change: -0.77% Year-to-date Change: -9.7% | |
| SWK Links: Profile News Message Board | |
| Charts:- Daily , Weekly | |
| Add SWK to Watchlist: View: Get SWK Trend Analysis ➞ | |
 | NSC Norfolk Southern Corporation |
| Sector: Transports | |
| SubSector: Railroads | |
| MarketCap: 36165.4 Millions | |
| Recent Price: 239.41 Smart Investing & Trading Score: 41 | |
| Day Percent Change: 1.35% Day Change: 3.19 | |
| Week Change: -0.78% Year-to-date Change: 1.3% | |
| NSC Links: Profile News Message Board | |
| Charts:- Daily , Weekly | |
| Add NSC to Watchlist: View: Get NSC Trend Analysis ➞ | |
 | CDNS Cadence Design Systems, Inc. |
| Sector: Technology | |
| SubSector: Application Software | |
| MarketCap: 16865.8 Millions | |
| Recent Price: 277.93 Smart Investing & Trading Score: 10 | |
| Day Percent Change: 0.10% Day Change: 0.26 | |
| Week Change: -0.83% Year-to-date Change: 2.0% | |
| CDNS Links: Profile News Message Board | |
| Charts:- Daily , Weekly | |
| Add CDNS to Watchlist: View: Get CDNS Trend Analysis ➞ | |
 | CTVA Corteva, Inc. |
| Sector: Materials | |
| SubSector: Agricultural Chemicals | |
| MarketCap: 18894.3 Millions | |
| Recent Price: 54.34 Smart Investing & Trading Score: 53 | |
| Day Percent Change: -0.78% Day Change: -0.43 | |
| Week Change: -0.83% Year-to-date Change: 13.4% | |
| CTVA Links: Profile News Message Board | |
| Charts:- Daily , Weekly | |
| Add CTVA to Watchlist: View: Get CTVA Trend Analysis ➞ | |
 | FCX Freeport-McMoRan Inc. |
| Sector: Materials | |
| SubSector: Copper | |
| MarketCap: 9070.57 Millions | |
| Recent Price: 49.19 Smart Investing & Trading Score: 68 | |
| Day Percent Change: 1.97% Day Change: 0.95 | |
| Week Change: -0.85% Year-to-date Change: 15.6% | |
| FCX Links: Profile News Message Board | |
| Charts:- Daily , Weekly | |
| Add FCX to Watchlist: View: Get FCX Trend Analysis ➞ | |
 | DD DuPont de Nemours, Inc. |
| Sector: Materials | |
| SubSector: Agricultural Chemicals | |
| MarketCap: 25631.6 Millions | |
| Recent Price: 73.26 Smart Investing & Trading Score: 46 | |
| Day Percent Change: -0.95% Day Change: -0.70 | |
| Week Change: -0.85% Year-to-date Change: -4.8% | |
| DD Links: Profile News Message Board | |
| Charts:- Daily , Weekly | |
| Add DD to Watchlist: View: Get DD Trend Analysis ➞ | |
 | SLB Schlumberger Limited |
| Sector: Energy | |
| SubSector: Oil & Gas Equipment & Services | |
| MarketCap: 23892 Millions | |
| Recent Price: 49.41 Smart Investing & Trading Score: 44 | |
| Day Percent Change: 0.62% Day Change: 0.30 | |
| Week Change: -0.87% Year-to-date Change: -5.0% | |
| SLB Links: Profile News Message Board | |
| Charts:- Daily , Weekly | |
| Add SLB to Watchlist: View: Get SLB Trend Analysis ➞ | |
 | ITW Illinois Tool Works Inc. |
| Sector: Industrials | |
| SubSector: Diversified Machinery | |
| MarketCap: 45324.8 Millions | |
| Recent Price: 248.23 Smart Investing & Trading Score: 18 | |
| Day Percent Change: -1.40% Day Change: -3.53 | |
| Week Change: -0.89% Year-to-date Change: -5.2% | |
| ITW Links: Profile News Message Board | |
| Charts:- Daily , Weekly | |
| Add ITW to Watchlist: View: Get ITW Trend Analysis ➞ | |
 | FMC FMC Corporation |
| Sector: Materials | |
| SubSector: Chemicals - Major Diversified | |
| MarketCap: 9068.36 Millions | |
| Recent Price: 57.30 Smart Investing & Trading Score: 53 | |
| Day Percent Change: -1.88% Day Change: -1.10 | |
| Week Change: -0.9% Year-to-date Change: -9.1% | |
| FMC Links: Profile News Message Board | |
| Charts:- Daily , Weekly | |
| Add FMC to Watchlist: View: Get FMC Trend Analysis ➞ | |
 | CSX CSX Corporation |
| Sector: Transports | |
| SubSector: Railroads | |
| MarketCap: 42131.2 Millions | |
| Recent Price: 34.02 Smart Investing & Trading Score: 10 | |
| Day Percent Change: 1.04% Day Change: 0.35 | |
| Week Change: -0.93% Year-to-date Change: -1.9% | |
| CSX Links: Profile News Message Board | |
| Charts:- Daily , Weekly | |
| Add CSX to Watchlist: View: Get CSX Trend Analysis ➞ | |
 | ROST Ross Stores, Inc. |
| Sector: Services & Goods | |
| SubSector: Apparel Stores | |
| MarketCap: 24938.8 Millions | |
| Recent Price: 132.00 Smart Investing & Trading Score: 10 | |
| Day Percent Change: -0.46% Day Change: -0.62 | |
| Week Change: -1.01% Year-to-date Change: -4.6% | |
| ROST Links: Profile News Message Board | |
| Charts:- Daily , Weekly | |
| Add ROST to Watchlist: View: Get ROST Trend Analysis ➞ | |
 | EXPD Expeditors International of Washington, Inc. |
| Sector: Transports | |
| SubSector: Air Delivery & Freight Services | |
| MarketCap: 10129.8 Millions | |
| Recent Price: 113.44 Smart Investing & Trading Score: 18 | |
| Day Percent Change: 0.51% Day Change: 0.57 | |
| Week Change: -1.02% Year-to-date Change: -10.8% | |
| EXPD Links: Profile News Message Board | |
| Charts:- Daily , Weekly | |
| Add EXPD to Watchlist: View: Get EXPD Trend Analysis ➞ | |
| For tabular summary view of above stock list: Summary View ➞ 0 - 25 , 25 - 50 , 50 - 75 , 75 - 100 , 100 - 125 , 125 - 150 , 150 - 175 , 175 - 200 , 200 - 225 , 225 - 250 , 250 - 275 , 275 - 300 , 300 - 325 , 325 - 350 , 350 - 375 , 375 - 400 , 400 - 425 , 425 - 450 , 450 - 475 , 475 - 500 | ||
| Click To Change The Sort Order: By Market Cap or Company Size Performance: Year-to-date, Week and Day | |
| Select Chart Type: | ||
|
Best Stocks Today 12Stocks.com |
© 2024 12Stocks.com Terms & Conditions Privacy Contact Us
All Information Provided Only For Education And Not To Be Used For Investing or Trading. See Terms & Conditions


One More Thing ... Get Best Stocks Delivered Daily!
Never Ever Miss A Move With Our Top Ten Stocks Lists
Find Best Stocks In Any Market - Bull or Bear Market
Take A Peek At Our Top Ten Stocks Lists: Daily, Weekly, Year-to-Date & Top Trends
Find Best Stocks In Any Market - Bull or Bear Market
Take A Peek At Our Top Ten Stocks Lists: Daily, Weekly, Year-to-Date & Top Trends
S&P 500 Stocks With Best Up Trends [0-bearish to 100-bullish]: Newmont [100], Teradyne [100], Chipotle Mexican[100], Dover [100], Northrop Grumman[100], EQT [100], Merck [100], Tractor Supply[100], Hess [100], General Motors[100], Omnicom [100]
Best S&P 500 Stocks Year-to-Date:
NVIDIA [66.63%], Constellation [61.56%], NRG [40.53%], Chipotle Mexican[36.47%], Targa Resources[35.12%], Marathon [34.21%], Diamondback [33.54%], Western Digital[33%], Progressive [31.85%], Eaton [31.52%], Micron [30.9%] Best S&P 500 Stocks This Week:
Hasbro [17.19%], Tesla [13.13%], Teradyne [13.08%], Wabtec [12.67%], Tyler Technologies[12.33%], Newmont [11.94%], Globe Life[11.9%], Monolithic Power[11.78%], Microchip [11.13%], NXP Semiconductors[10.44%], EQT [10.33%] Best S&P 500 Stocks Daily:
Newmont [13.16%], Tyler Technologies[8.13%], Teradyne [7.77%], Carrier Global[7.19%], Chipotle Mexican[6.63%], United Rentals[5.72%], Dover [5.14%], Arista Networks[4.92%], Union Pacific[4.73%], Keurig Dr[4.07%], Zebra Technologies[3.90%]