
 Login Sign Up


| |||||
 |  | ||||

| 12Stocks.com Market Intelligence |
Best S&P 500 Stocks
|
On this page, you will find the most comprehensive analysis of S&P 500 stocks and ETFs - from latest trends to performances to charts ➞. First, here are the year-to-date (YTD) performances of the most requested S&P 500 stocks at 12Stocks.com (click stock for review):
| NVIDIA 67% | ||
| Merck 19% | ||
| Caterpillar 15% | ||
| Walmart 14% | ||
| Amazon.com 13% | ||
| JPMorgan Chase 13% | ||
| Google 11% | ||
| Chevron 10% | ||
| Goldman Sachs 8% | ||
| Microsoft 5% | ||
| Johnson & Johnson -6% | ||
| McDonald s -7% | ||
| Starbucks -9% | ||
| Apple -12% | ||
| Gilead -19% | ||
| Intel -30% | ||
| Boeing -36% | ||
| Quick: S&P 500 Stocks Lists: Performances & Trends, S&P 500 Stock Charts
Sort S&P 500 stocks: Daily, Weekly, Year-to-Date, Market Cap & Trends. Filter S&P 500 stocks list by sector: Show all, Tech, Finance, Energy, Staples, Retail, Industrial, Materials, Utilities and HealthCare |
| 12Stocks.com S&P 500 Stocks Performances & Trends Daily Report | |||||||||
|
| 
The overall Smart Investing & Trading Score is 44 (0-bearish to 100-bullish) which puts S&P 500 index in short term neutral trend. The Smart Investing & Trading Score from previous trading session is 58 and hence a deterioration of trend. | ||||||||
Here are the Smart Investing & Trading Scores of the most requested S&P 500 stocks at 12Stocks.com (click stock name for detailed review):
|


| 12Stocks.com: Top Performing S&P 500 Index Stocks | ||||||||||||||||||||||||||||||||||||||||||||||||
 The top performing S&P 500 Index stocks year to date are
Now, more recently, over last week, the top performing S&P 500 Index stocks on the move are


|
||||||||||||||||||||||||||||||||||||||||||||||||
| 12Stocks.com: Investing in S&P 500 Index with Stocks | |
|
The following table helps investors and traders sort through current performance and trends (as measured by Smart Investing & Trading Score) of various
stocks in the S&P 500 Index. Quick View: Move mouse or cursor over stock symbol (ticker) to view short-term technical chart and over stock name to view long term chart. Click on  to add stock symbol to your watchlist and to add stock symbol to your watchlist and  to view watchlist. Click on any ticker or stock name for detailed market intelligence report for that stock. to view watchlist. Click on any ticker or stock name for detailed market intelligence report for that stock. |
12Stocks.com Performance of Stocks in S&P 500 Index
| Ticker | Stock Name | Watchlist | Category | Recent Price | Smart Investing & Trading Score | Change % | Weekly Change% |
| MDT | Medtronic |   | Health Care | 79.29 | 0 | -1.36% | -0.24% |
| CSCO | Cisco Systems | | Technology | 48.19 | 25 | -0.33% | -0.27% |
| PLD | Prologis | | Financials | 103.20 | 10 | 0.02% | -0.28% |
| LLY | Eli Lilly | | Health Care | 724.10 | 26 | -1.11% | -0.30% |
| BEN | Franklin Resources | | Financials | 25.07 | 10 | -1.08% | -0.30% |
| ORCL | Oracle | | Technology | 114.54 | 36 | -0.69% | -0.30% |
| CZR | Caesars Entertainment | | Services & Goods | 38.09 | 18 | -1.03% | -0.30% |
| AMCR | Amcor | | Consumer Staples | 8.94 | 59 | -1.32% | -0.33% |
| DIS | Walt Disney | | Services & Goods | 112.22 | 54 | -1.49% | -0.35% |
| MGM | MGM Resorts | | Services & Goods | 42.27 | 18 | -1.04% | -0.37% |
| KEY | KeyCorp | | Financials | 14.57 | 41 | -2.38% | -0.38% |
| MNST | Monster Beverage | | Consumer Staples | 52.93 | 0 | -2.58% | -0.40% |
| XRAY | DENTSPLY SIRONA | | Health Care | 30.37 | 10 | -1.78% | -0.43% |
| CE | Celanese | | Materials | 153.78 | 44 | -1.06% | -0.43% |
| APA | Apache | | Energy | 32.21 | 61 | 0.50% | -0.46% |
| REGN | Regeneron | | Health Care | 892.49 | 10 | -1.55% | -0.48% |
| TEL | TE Connectivity | | Technology | 139.84 | 0 | -0.11% | -0.51% |
| VRSN | VeriSign | | Technology | 183.12 | 10 | -1.31% | -0.55% |
| LIN | Linde | | Materials | 443.86 | 36 | -0.10% | -0.55% |
| COO | Cooper | | Health Care | 89.91 | 18 | -0.32% | -0.56% |
| CF | CF Industries | | Materials | 79.02 | 54 | -0.29% | -0.57% |
| TRV | Travelers | | Financials | 212.85 | 31 | -0.27% | -0.57% |
| WFC | Wells Fargo | | Financials | 60.00 | 58 | -0.99% | -0.58% |
| CTSH | Cognizant | | Technology | 67.04 | 10 | -0.71% | -0.59% |
| EMN | Eastman Chemical | | Materials | 95.82 | 46 | -0.56% | -0.62% |
| For chart view version of above stock list: Chart View ➞ 0 - 25 , 25 - 50 , 50 - 75 , 75 - 100 , 100 - 125 , 125 - 150 , 150 - 175 , 175 - 200 , 200 - 225 , 225 - 250 , 250 - 275 , 275 - 300 , 300 - 325 , 325 - 350 , 350 - 375 , 375 - 400 , 400 - 425 , 425 - 450 , 450 - 475 , 475 - 500 | ||
 | Click To Change The Sort Order: By Market Cap or Company Size Performance: Year-to-date, Week and Day |  |
|
Get the most comprehensive stock market coverage daily at 12Stocks.com ➞ Best Stocks Today ➞ Best Stocks Weekly ➞ Best Stocks Year-to-Date ➞ Best Stocks Trends ➞  Best Stocks Today 12Stocks.com Best Nasdaq Stocks ➞ Best S&P 500 Stocks ➞ Best Tech Stocks ➞ Best Biotech Stocks ➞ |
| Detailed Overview of S&P 500 Stocks |
| S&P 500 Technical Overview, Leaders & Laggards, Top S&P 500 ETF Funds & Detailed S&P 500 Stocks List, Charts, Trends & More |
| S&P 500: Technical Analysis, Trends & YTD Performance | |
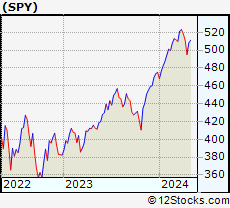
| S&P 500 index as represented by
SPY, an exchange-traded fund [ETF], holds basket of five hundred (mostly largecap) stocks from across all major sectors of the US stock market. The S&P 500 index (contains stocks like Apple and Exxon) is up by 5.58% and is currently outperforming the overall market by 0.73% year-to-date. Below is a quick view of technical charts and trends: | |
 SPY Weekly Chart |
|
| Long Term Trend: Good | |
| Medium Term Trend: Not Good | |
 SPY Daily Chart |
|
| Short Term Trend: Very Good | |
| Overall Trend Score: 44 | |
| YTD Performance: 5.58% | |
| **Trend Scores & Views Are Only For Educational Purposes And Not For Investing | |
| 12Stocks.com: Investing in S&P 500 Index using Exchange Traded Funds | |
|
The following table shows list of key exchange traded funds (ETF) that
help investors track S&P 500 index. The following list also includes leveraged ETF funds that track twice or thrice the daily returns of S&P 500 indices. Short or inverse ETF funds move in the opposite direction to the index they track and are useful during market pullbacks or during bear markets. Quick View: Move mouse or cursor over ETF symbol (ticker) to view short-term technical chart and over ETF name to view long term chart. Click on ticker or stock name for detailed view. Click on to add stock symbol to your watchlist and to view watchlist. |
12Stocks.com List of ETFs that track S&P 500 Index
| Ticker | ETF Name | Watchlist | Recent Price | Smart Investing & Trading Score | Change % | Week % | Year-to-date % |
| SPY | SPDR S&P 500 ETF | | 501.85 | 44 | -0.70 | 1.35 | 5.58% |
| IVV | iShares Core S&P 500 ETF | | 504.31 | 56 | -0.72 | 1.36 | 5.59% |
| VOO | Vanguard 500 ETF | | 461.49 | 56 | -0.65 | 1.4 | 5.65% |
| OEF | iShares S&P 100 | | 237.51 | 44 | -0.95 | 1.21 | 6.32% |
| SSO | ProShares Ultra S&P500 | | 70.96 | 51 | -1.38 | 2.68 | 9.05% |
| UPRO | ProShares UltraPro S&P500 | | 61.44 | 51 | -2.29 | 3.85 | 12.24% |
| SPXL | Direxion Daily S&P500 Bull 3X ETF | | 116.75 | 56 | -2.18 | 3.73 | 12.27% |
| SH | ProShares Short S&P500 | | 12.43 | 57 | 0.81 | -1.27 | -4.31% |
| SDS | ProShares UltraShort S&P500 | | 27.20 | 49 | 1.49 | -2.51 | -9.09% |
| SPXU | ProShares UltraPro Short S&P500 | | 36.82 | 49 | 2.16 | -3.94 | -14.37% |
| SPXS | Direxion Daily S&P 500 Bear 3X ETF | | 9.98 | 32 | 2.36 | -3.67 | -13.59% |
| 12Stocks.com: Charts, Trends, Fundamental Data and Performances of S&P 500 Stocks | |
|
We now take in-depth look at all S&P 500 stocks including charts, multi-period performances and overall trends (as measured by Smart Investing & Trading Score). One can sort S&P 500 stocks (click link to choose) by Daily, Weekly and by Year-to-Date performances. Also, one can sort by size of the company or by market capitalization. |
| Select Your Default Chart Type: | |||||
| |||||
| Click on stock symbol or name for detailed view. Click on to add stock symbol to your watchlist and to view watchlist. Quick View: Move mouse or cursor over "Daily" to quickly view daily technical stock chart and over "Weekly" to view weekly technical stock chart. | |||||

 | MDT Medtronic plc |
| Sector: Health Care | |
| SubSector: Medical Appliances & Equipment | |
| MarketCap: 113698 Millions | |
| Recent Price: 79.29 Smart Investing & Trading Score: 0 | |
| Day Percent Change: -1.36% Day Change: -1.09 | |
| Week Change: -0.24% Year-to-date Change: -3.8% | |
| MDT Links: Profile News Message Board | |
| Charts:- Daily , Weekly | |
| Add MDT to Watchlist: View: Get MDT Trend Analysis ➞ | |
 | CSCO Cisco Systems, Inc. |
| Sector: Technology | |
| SubSector: Communication Equipment | |
| MarketCap: 168483 Millions | |
| Recent Price: 48.19 Smart Investing & Trading Score: 25 | |
| Day Percent Change: -0.33% Day Change: -0.16 | |
| Week Change: -0.27% Year-to-date Change: -4.6% | |
| CSCO Links: Profile News Message Board | |
| Charts:- Daily , Weekly | |
| Add CSCO to Watchlist: View: Get CSCO Trend Analysis ➞ | |
 | PLD Prologis, Inc. |
| Sector: Financials | |
| SubSector: REIT - Industrial | |
| MarketCap: 48728.9 Millions | |
| Recent Price: 103.20 Smart Investing & Trading Score: 10 | |
| Day Percent Change: 0.02% Day Change: 0.02 | |
| Week Change: -0.28% Year-to-date Change: -22.6% | |
| PLD Links: Profile News Message Board | |
| Charts:- Daily , Weekly | |
| Add PLD to Watchlist: View: Get PLD Trend Analysis ➞ | |
 | LLY Eli Lilly and Company |
| Sector: Health Care | |
| SubSector: Drug Manufacturers - Major | |
| MarketCap: 130066 Millions | |
| Recent Price: 724.10 Smart Investing & Trading Score: 26 | |
| Day Percent Change: -1.11% Day Change: -8.11 | |
| Week Change: -0.3% Year-to-date Change: 24.2% | |
| LLY Links: Profile News Message Board | |
| Charts:- Daily , Weekly | |
| Add LLY to Watchlist: View: Get LLY Trend Analysis ➞ | |
 | BEN Franklin Resources, Inc. |
| Sector: Financials | |
| SubSector: Asset Management | |
| MarketCap: 9419.73 Millions | |
| Recent Price: 25.07 Smart Investing & Trading Score: 10 | |
| Day Percent Change: -1.08% Day Change: -0.28 | |
| Week Change: -0.3% Year-to-date Change: -15.8% | |
| BEN Links: Profile News Message Board | |
| Charts:- Daily , Weekly | |
| Add BEN to Watchlist: View: Get BEN Trend Analysis ➞ | |
 | ORCL Oracle Corporation |
| Sector: Technology | |
| SubSector: Application Software | |
| MarketCap: 164530 Millions | |
| Recent Price: 114.54 Smart Investing & Trading Score: 36 | |
| Day Percent Change: -0.69% Day Change: -0.80 | |
| Week Change: -0.3% Year-to-date Change: 8.6% | |
| ORCL Links: Profile News Message Board | |
| Charts:- Daily , Weekly | |
| Add ORCL to Watchlist: View: Get ORCL Trend Analysis ➞ | |
 | CZR Caesars Entertainment Corporation |
| Sector: Services & Goods | |
| SubSector: Resorts & Casinos | |
| MarketCap: 4618.44 Millions | |
| Recent Price: 38.09 Smart Investing & Trading Score: 18 | |
| Day Percent Change: -1.03% Day Change: -0.39 | |
| Week Change: -0.3% Year-to-date Change: -18.8% | |
| CZR Links: Profile News Message Board | |
| Charts:- Daily , Weekly | |
| Add CZR to Watchlist: View: Get CZR Trend Analysis ➞ | |
 | AMCR Amcor plc |
| Sector: Consumer Staples | |
| SubSector: Packaging & Containers | |
| MarketCap: 13964 Millions | |
| Recent Price: 8.94 Smart Investing & Trading Score: 59 | |
| Day Percent Change: -1.32% Day Change: -0.12 | |
| Week Change: -0.33% Year-to-date Change: -7.3% | |
| AMCR Links: Profile News Message Board | |
| Charts:- Daily , Weekly | |
| Add AMCR to Watchlist: View: Get AMCR Trend Analysis ➞ | |
 | DIS The Walt Disney Company |
| Sector: Services & Goods | |
| SubSector: Entertainment - Diversified | |
| MarketCap: 178396 Millions | |
| Recent Price: 112.22 Smart Investing & Trading Score: 54 | |
| Day Percent Change: -1.49% Day Change: -1.70 | |
| Week Change: -0.35% Year-to-date Change: 24.3% | |
| DIS Links: Profile News Message Board | |
| Charts:- Daily , Weekly | |
| Add DIS to Watchlist: View: Get DIS Trend Analysis ➞ | |
 | MGM MGM Resorts International |
| Sector: Services & Goods | |
| SubSector: Resorts & Casinos | |
| MarketCap: 5315.04 Millions | |
| Recent Price: 42.27 Smart Investing & Trading Score: 18 | |
| Day Percent Change: -1.04% Day Change: -0.45 | |
| Week Change: -0.37% Year-to-date Change: -5.4% | |
| MGM Links: Profile News Message Board | |
| Charts:- Daily , Weekly | |
| Add MGM to Watchlist: View: Get MGM Trend Analysis ➞ | |
 | KEY KeyCorp |
| Sector: Financials | |
| SubSector: Regional - Midwest Banks | |
| MarketCap: 10045 Millions | |
| Recent Price: 14.57 Smart Investing & Trading Score: 41 | |
| Day Percent Change: -2.38% Day Change: -0.36 | |
| Week Change: -0.38% Year-to-date Change: 1.2% | |
| KEY Links: Profile News Message Board | |
| Charts:- Daily , Weekly | |
| Add KEY to Watchlist: View: Get KEY Trend Analysis ➞ | |
 | MNST Monster Beverage Corporation |
| Sector: Consumer Staples | |
| SubSector: Beverages - Soft Drinks | |
| MarketCap: 30126.8 Millions | |
| Recent Price: 52.93 Smart Investing & Trading Score: 0 | |
| Day Percent Change: -2.58% Day Change: -1.40 | |
| Week Change: -0.4% Year-to-date Change: -8.1% | |
| MNST Links: Profile News Message Board | |
| Charts:- Daily , Weekly | |
| Add MNST to Watchlist: View: Get MNST Trend Analysis ➞ | |
 | XRAY DENTSPLY SIRONA Inc. |
| Sector: Health Care | |
| SubSector: Medical Instruments & Supplies | |
| MarketCap: 7746.1 Millions | |
| Recent Price: 30.37 Smart Investing & Trading Score: 10 | |
| Day Percent Change: -1.78% Day Change: -0.55 | |
| Week Change: -0.43% Year-to-date Change: -14.7% | |
| XRAY Links: Profile News Message Board | |
| Charts:- Daily , Weekly | |
| Add XRAY to Watchlist: View: Get XRAY Trend Analysis ➞ | |
 | CE Celanese Corporation |
| Sector: Materials | |
| SubSector: Chemicals - Major Diversified | |
| MarketCap: 8521.06 Millions | |
| Recent Price: 153.78 Smart Investing & Trading Score: 44 | |
| Day Percent Change: -1.06% Day Change: -1.65 | |
| Week Change: -0.43% Year-to-date Change: -1.0% | |
| CE Links: Profile News Message Board | |
| Charts:- Daily , Weekly | |
| Add CE to Watchlist: View: Get CE Trend Analysis ➞ | |
 | APA Apache Corporation |
| Sector: Energy | |
| SubSector: Independent Oil & Gas | |
| MarketCap: 1937.53 Millions | |
| Recent Price: 32.21 Smart Investing & Trading Score: 61 | |
| Day Percent Change: 0.50% Day Change: 0.16 | |
| Week Change: -0.46% Year-to-date Change: -10.2% | |
| APA Links: Profile News Message Board | |
| Charts:- Daily , Weekly | |
| Add APA to Watchlist: View: Get APA Trend Analysis ➞ | |
 | REGN Regeneron Pharmaceuticals, Inc. |
| Sector: Health Care | |
| SubSector: Biotechnology | |
| MarketCap: 51903.7 Millions | |
| Recent Price: 892.49 Smart Investing & Trading Score: 10 | |
| Day Percent Change: -1.55% Day Change: -14.05 | |
| Week Change: -0.48% Year-to-date Change: 1.6% | |
| REGN Links: Profile News Message Board | |
| Charts:- Daily , Weekly | |
| Add REGN to Watchlist: View: Get REGN Trend Analysis ➞ | |
 | TEL TE Connectivity Ltd. |
| Sector: Technology | |
| SubSector: Diversified Electronics | |
| MarketCap: 20044.9 Millions | |
| Recent Price: 139.84 Smart Investing & Trading Score: 0 | |
| Day Percent Change: -0.11% Day Change: -0.16 | |
| Week Change: -0.51% Year-to-date Change: -0.5% | |
| TEL Links: Profile News Message Board | |
| Charts:- Daily , Weekly | |
| Add TEL to Watchlist: View: Get TEL Trend Analysis ➞ | |
 | VRSN VeriSign, Inc. |
| Sector: Technology | |
| SubSector: Internet Information Providers | |
| MarketCap: 19657 Millions | |
| Recent Price: 183.12 Smart Investing & Trading Score: 10 | |
| Day Percent Change: -1.31% Day Change: -2.44 | |
| Week Change: -0.55% Year-to-date Change: -11.1% | |
| VRSN Links: Profile News Message Board | |
| Charts:- Daily , Weekly | |
| Add VRSN to Watchlist: View: Get VRSN Trend Analysis ➞ | |
 | LIN Linde plc |
| Sector: Materials | |
| SubSector: Specialty Chemicals | |
| MarketCap: 88539.2 Millions | |
| Recent Price: 443.86 Smart Investing & Trading Score: 36 | |
| Day Percent Change: -0.10% Day Change: -0.46 | |
| Week Change: -0.55% Year-to-date Change: 8.1% | |
| LIN Links: Profile News Message Board | |
| Charts:- Daily , Weekly | |
| Add LIN to Watchlist: View: Get LIN Trend Analysis ➞ | |
 | COO The Cooper Companies, Inc. |
| Sector: Health Care | |
| SubSector: Medical Instruments & Supplies | |
| MarketCap: 15460 Millions | |
| Recent Price: 89.91 Smart Investing & Trading Score: 18 | |
| Day Percent Change: -0.32% Day Change: -0.29 | |
| Week Change: -0.56% Year-to-date Change: -5.0% | |
| COO Links: Profile News Message Board | |
| Charts:- Daily , Weekly | |
| Add COO to Watchlist: View: Get COO Trend Analysis ➞ | |
 | CF CF Industries Holdings, Inc. |
| Sector: Materials | |
| SubSector: Agricultural Chemicals | |
| MarketCap: 5581.89 Millions | |
| Recent Price: 79.02 Smart Investing & Trading Score: 54 | |
| Day Percent Change: -0.29% Day Change: -0.23 | |
| Week Change: -0.57% Year-to-date Change: -0.6% | |
| CF Links: Profile News Message Board | |
| Charts:- Daily , Weekly | |
| Add CF to Watchlist: View: Get CF Trend Analysis ➞ | |
 | TRV The Travelers Companies, Inc. |
| Sector: Financials | |
| SubSector: Property & Casualty Insurance | |
| MarketCap: 25155.9 Millions | |
| Recent Price: 212.85 Smart Investing & Trading Score: 31 | |
| Day Percent Change: -0.27% Day Change: -0.58 | |
| Week Change: -0.57% Year-to-date Change: 11.7% | |
| TRV Links: Profile News Message Board | |
| Charts:- Daily , Weekly | |
| Add TRV to Watchlist: View: Get TRV Trend Analysis ➞ | |
 | WFC Wells Fargo & Company |
| Sector: Financials | |
| SubSector: Money Center Banks | |
| MarketCap: 129138 Millions | |
| Recent Price: 60.00 Smart Investing & Trading Score: 58 | |
| Day Percent Change: -0.99% Day Change: -0.60 | |
| Week Change: -0.58% Year-to-date Change: 21.9% | |
| WFC Links: Profile News Message Board | |
| Charts:- Daily , Weekly | |
| Add WFC to Watchlist: View: Get WFC Trend Analysis ➞ | |
 | CTSH Cognizant Technology Solutions Corporation |
| Sector: Technology | |
| SubSector: Information Technology Services | |
| MarketCap: 26249.7 Millions | |
| Recent Price: 67.04 Smart Investing & Trading Score: 10 | |
| Day Percent Change: -0.71% Day Change: -0.48 | |
| Week Change: -0.59% Year-to-date Change: -11.2% | |
| CTSH Links: Profile News Message Board | |
| Charts:- Daily , Weekly | |
| Add CTSH to Watchlist: View: Get CTSH Trend Analysis ➞ | |
 | EMN Eastman Chemical Company |
| Sector: Materials | |
| SubSector: Chemicals - Major Diversified | |
| MarketCap: 6217.06 Millions | |
| Recent Price: 95.82 Smart Investing & Trading Score: 46 | |
| Day Percent Change: -0.56% Day Change: -0.54 | |
| Week Change: -0.62% Year-to-date Change: 6.7% | |
| EMN Links: Profile News Message Board | |
| Charts:- Daily , Weekly | |
| Add EMN to Watchlist: View: Get EMN Trend Analysis ➞ | |
| For tabular summary view of above stock list: Summary View ➞ 0 - 25 , 25 - 50 , 50 - 75 , 75 - 100 , 100 - 125 , 125 - 150 , 150 - 175 , 175 - 200 , 200 - 225 , 225 - 250 , 250 - 275 , 275 - 300 , 300 - 325 , 325 - 350 , 350 - 375 , 375 - 400 , 400 - 425 , 425 - 450 , 450 - 475 , 475 - 500 | ||
| Click To Change The Sort Order: By Market Cap or Company Size Performance: Year-to-date, Week and Day | |
| Select Chart Type: | ||
|
Best Stocks Today 12Stocks.com |
© 2024 12Stocks.com Terms & Conditions Privacy Contact Us
All Information Provided Only For Education And Not To Be Used For Investing or Trading. See Terms & Conditions


One More Thing ... Get Best Stocks Delivered Daily!
Never Ever Miss A Move With Our Top Ten Stocks Lists
Find Best Stocks In Any Market - Bull or Bear Market
Take A Peek At Our Top Ten Stocks Lists: Daily, Weekly, Year-to-Date & Top Trends
Find Best Stocks In Any Market - Bull or Bear Market
Take A Peek At Our Top Ten Stocks Lists: Daily, Weekly, Year-to-Date & Top Trends
S&P 500 Stocks With Best Up Trends [0-bearish to 100-bullish]: Newmont [100], Teradyne [100], Chipotle Mexican[100], Dover [100], Northrop Grumman[100], EQT [100], Merck [100], Tractor Supply[100], Hess [100], General Motors[100], Omnicom [100]
Best S&P 500 Stocks Year-to-Date:
NVIDIA [66.63%], Constellation [61.56%], NRG [40.53%], Chipotle Mexican[36.47%], Targa Resources[35.12%], Marathon [34.21%], Diamondback [33.54%], Western Digital[33%], Progressive [31.85%], Eaton [31.52%], Micron [30.9%] Best S&P 500 Stocks This Week:
Hasbro [17.19%], Tesla [13.13%], Teradyne [13.08%], Wabtec [12.67%], Tyler Technologies[12.33%], Newmont [11.94%], Globe Life[11.9%], Monolithic Power[11.78%], Microchip [11.13%], NXP Semiconductors[10.44%], EQT [10.33%] Best S&P 500 Stocks Daily:
Newmont [13.16%], Tyler Technologies[8.13%], Teradyne [7.77%], Carrier Global[7.19%], Chipotle Mexican[6.63%], United Rentals[5.72%], Dover [5.14%], Arista Networks[4.92%], Union Pacific[4.73%], Keurig Dr[4.07%], Zebra Technologies[3.90%]