
 Login Sign Up


| |||||
 |  | ||||

| 12Stocks.com Market Intelligence |
Best S&P 500 Stocks
|
On this page, you will find the most comprehensive analysis of S&P 500 stocks and ETFs - from latest trends to performances to charts ➞. First, here are the year-to-date (YTD) performances of the most requested S&P 500 stocks at 12Stocks.com (click stock for review):
| NVIDIA 66% | ||
| Caterpillar 22% | ||
| Amazon.com 17% | ||
| Merck 16% | ||
| Google 13% | ||
| Walmart 13% | ||
| JPMorgan Chase 12% | ||
| Goldman Sachs 9% | ||
| Chevron 9% | ||
| Microsoft 9% | ||
| Johnson & Johnson -6% | ||
| McDonald s -8% | ||
| Starbucks -8% | ||
| Apple -13% | ||
| Gilead -18% | ||
| Intel -31% | ||
| Boeing -35% | ||
| Quick: S&P 500 Stocks Lists: Performances & Trends, S&P 500 Stock Charts
Sort S&P 500 stocks: Daily, Weekly, Year-to-Date, Market Cap & Trends. Filter S&P 500 stocks list by sector: Show all, Tech, Finance, Energy, Staples, Retail, Industrial, Materials, Utilities and HealthCare |
| 12Stocks.com S&P 500 Stocks Performances & Trends Daily Report | |||||||||
|
| 
The overall Smart Investing & Trading Score is 58 (0-bearish to 100-bullish) which puts S&P 500 index in short term neutral trend. The Smart Investing & Trading Score from previous trading session is 51 and an improvement of trend continues. | ||||||||
Here are the Smart Investing & Trading Scores of the most requested S&P 500 stocks at 12Stocks.com (click stock name for detailed review):
|


| 12Stocks.com: Top Performing S&P 500 Index Stocks | ||||||||||||||||||||||||||||||||||||||||||||||||
 The top performing S&P 500 Index stocks year to date are
Now, more recently, over last week, the top performing S&P 500 Index stocks on the move are


|
||||||||||||||||||||||||||||||||||||||||||||||||
| 12Stocks.com: Investing in S&P 500 Index with Stocks | |
|
The following table helps investors and traders sort through current performance and trends (as measured by Smart Investing & Trading Score) of various
stocks in the S&P 500 Index. Quick View: Move mouse or cursor over stock symbol (ticker) to view short-term technical chart and over stock name to view long term chart. Click on  to add stock symbol to your watchlist and to add stock symbol to your watchlist and  to view watchlist. Click on any ticker or stock name for detailed market intelligence report for that stock. to view watchlist. Click on any ticker or stock name for detailed market intelligence report for that stock. |
12Stocks.com Performance of Stocks in S&P 500 Index
| Ticker | Stock Name | Watchlist | Category | Recent Price | Smart Investing & Trading Score | Change % | Weekly Change% |
| UPS | United Parcel |   | Transports | 145.09 | 68 | -2.54% | 1.62% |
| TSCO | Tractor Supply | | Services & Goods | 256.86 | 90 | 0.35% | 1.61% |
| HOLX | Hologic | | Health Care | 76.59 | 68 | -0.78% | 1.61% |
| INVH | Invitation Homes | | Financials | 34.11 | 68 | -0.06% | 1.61% |
| PAYX | Paychex | | Services & Goods | 121.43 | 65 | -0.16% | 1.60% |
| CVX | Chevron | | Energy | 162.55 | 88 | -0.18% | 1.59% |
| DTE | DTE | | Utilities | 110.27 | 93 | 0.14% | 1.57% |
| AMZN | Amazon.com | | Services & Goods | 177.34 | 63 | -1.23% | 1.55% |
| K | Kellogg | | Consumer Staples | 58.27 | 93 | 0.22% | 1.55% |
| EL | Estee Lauder | | Consumer Staples | 146.63 | 83 | -1.58% | 1.54% |
| REGN | Regeneron | | Health Care | 910.54 | 32 | 0.35% | 1.53% |
| GWW | W.W. Grainger | | Services & Goods | 957.08 | 58 | 0.13% | 1.53% |
| SBAC | SBA | | Technology | 199.06 | 35 | 0.38% | 1.53% |
| VMC | Vulcan Materials | | Industrials | 255.85 | 58 | -1.34% | 1.51% |
| SNA | Snap-on | | Industrials | 272.85 | 32 | 0.56% | 1.51% |
| YUM | Yum! Brands | | Services & Goods | 140.57 | 93 | 0.34% | 1.49% |
| TSN | Tyson Foods | | Consumer Staples | 60.84 | 88 | -0.23% | 1.48% |
| PEG | Public Service | | Utilities | 66.71 | 81 | 0.33% | 1.48% |
| STE | STERIS | | Health Care | 202.44 | 39 | -1.72% | 1.47% |
| MKC | McCormick & | | Consumer Staples | 74.99 | 81 | -0.04% | 1.45% |
| AIZ | Assurant | | Financials | 176.34 | 58 | 0.01% | 1.44% |
| MAA | Mid-America Apartment | | Financials | 127.90 | 69 | 0.32% | 1.44% |
| PRU | Prudential Financial | | Financials | 112.19 | 70 | 0.12% | 1.43% |
| VRTX | Vertex | | Health Care | 399.90 | 42 | -1.24% | 1.43% |
| BLK | BlackRock | | Financials | 760.58 | 25 | -0.79% | 1.41% |
| For chart view version of above stock list: Chart View ➞ 0 - 25 , 25 - 50 , 50 - 75 , 75 - 100 , 100 - 125 , 125 - 150 , 150 - 175 , 175 - 200 , 200 - 225 , 225 - 250 , 250 - 275 , 275 - 300 , 300 - 325 , 325 - 350 , 350 - 375 , 375 - 400 , 400 - 425 , 425 - 450 , 450 - 475 | ||
 | Click To Change The Sort Order: By Market Cap or Company Size Performance: Year-to-date, Week and Day |  |
|
Get the most comprehensive stock market coverage daily at 12Stocks.com ➞ Best Stocks Today ➞ Best Stocks Weekly ➞ Best Stocks Year-to-Date ➞ Best Stocks Trends ➞  Best Stocks Today 12Stocks.com Best Nasdaq Stocks ➞ Best S&P 500 Stocks ➞ Best Tech Stocks ➞ Best Biotech Stocks ➞ |
| Detailed Overview of S&P 500 Stocks |
| S&P 500 Technical Overview, Leaders & Laggards, Top S&P 500 ETF Funds & Detailed S&P 500 Stocks List, Charts, Trends & More |
| S&P 500: Technical Analysis, Trends & YTD Performance | |
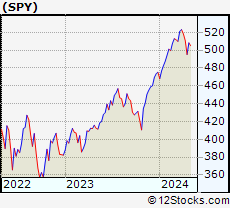
| S&P 500 index as represented by
SPY, an exchange-traded fund [ETF], holds basket of five hundred (mostly largecap) stocks from across all major sectors of the US stock market. The S&P 500 index (contains stocks like Apple and Exxon) is up by 6.15% and is currently outperforming the overall market by 0.81% year-to-date. Below is a quick view of technical charts and trends: | |
 SPY Weekly Chart |
|
| Long Term Trend: Good | |
| Medium Term Trend: Not Good | |
 SPY Daily Chart |
|
| Short Term Trend: Very Good | |
| Overall Trend Score: 58 | |
| YTD Performance: 6.15% | |
| **Trend Scores & Views Are Only For Educational Purposes And Not For Investing | |
| 12Stocks.com: Investing in S&P 500 Index using Exchange Traded Funds | |
|
The following table shows list of key exchange traded funds (ETF) that
help investors track S&P 500 index. The following list also includes leveraged ETF funds that track twice or thrice the daily returns of S&P 500 indices. Short or inverse ETF funds move in the opposite direction to the index they track and are useful during market pullbacks or during bear markets. Quick View: Move mouse or cursor over ETF symbol (ticker) to view short-term technical chart and over ETF name to view long term chart. Click on ticker or stock name for detailed view. Click on to add stock symbol to your watchlist and to view watchlist. |
12Stocks.com List of ETFs that track S&P 500 Index
| Ticker | ETF Name | Watchlist | Recent Price | Smart Investing & Trading Score | Change % | Week % | Year-to-date % |
| SPY | SPDR S&P 500 ETF | | 504.55 | 58 | -0.22 | 1.9 | 6.15% |
| IVV | iShares Core S&P 500 ETF | | 508.76 | 63 | 0.12 | 2.26 | 6.52% |
| VOO | Vanguard 500 ETF | | 465.33 | 63 | 0.11 | 2.25 | 6.53% |
| OEF | iShares S&P 100 | | 239.63 | 58 | -0.13 | 2.11 | 7.27% |
| SSO | ProShares Ultra S&P500 | | 71.69 | 58 | -0.49 | 3.73 | 10.17% |
| UPRO | ProShares UltraPro S&P500 | | 62.49 | 58 | -0.70 | 5.63 | 14.16% |
| SPXL | Direxion Daily S&P500 Bull 3X ETF | | 120.04 | 63 | 0.44 | 6.65 | 15.43% |
| SH | ProShares Short S&P500 | | 12.37 | 42 | 0.20 | -1.79 | -4.81% |
| SDS | ProShares UltraShort S&P500 | | 26.84 | 42 | 0.22 | -3.8 | -10.29% |
| SPXU | ProShares UltraPro Short S&P500 | | 36.25 | 42 | 0.72 | -5.43 | -15.7% |
| SPXS | Direxion Daily S&P 500 Bear 3X ETF | | 9.71 | 32 | -0.41 | -6.27 | -15.93% |
| 12Stocks.com: Charts, Trends, Fundamental Data and Performances of S&P 500 Stocks | |
|
We now take in-depth look at all S&P 500 stocks including charts, multi-period performances and overall trends (as measured by Smart Investing & Trading Score). One can sort S&P 500 stocks (click link to choose) by Daily, Weekly and by Year-to-Date performances. Also, one can sort by size of the company or by market capitalization. |
| Select Your Default Chart Type: | |||||
| |||||
| Click on stock symbol or name for detailed view. Click on to add stock symbol to your watchlist and to view watchlist. Quick View: Move mouse or cursor over "Daily" to quickly view daily technical stock chart and over "Weekly" to view weekly technical stock chart. | |||||

 | UPS United Parcel Service, Inc. |
| Sector: Transports | |
| SubSector: Air Delivery & Freight Services | |
| MarketCap: 81928.9 Millions | |
| Recent Price: 145.09 Smart Investing & Trading Score: 68 | |
| Day Percent Change: -2.54% Day Change: -3.78 | |
| Week Change: 1.62% Year-to-date Change: -7.7% | |
| UPS Links: Profile News Message Board | |
| Charts:- Daily , Weekly | |
| Add UPS to Watchlist: View: Get UPS Trend Analysis ➞ | |
 | TSCO Tractor Supply Company |
| Sector: Services & Goods | |
| SubSector: Specialty Retail, Other | |
| MarketCap: 9692.94 Millions | |
| Recent Price: 256.86 Smart Investing & Trading Score: 90 | |
| Day Percent Change: 0.35% Day Change: 0.90 | |
| Week Change: 1.61% Year-to-date Change: 19.5% | |
| TSCO Links: Profile News Message Board | |
| Charts:- Daily , Weekly | |
| Add TSCO to Watchlist: View: Get TSCO Trend Analysis ➞ | |
 | HOLX Hologic, Inc. |
| Sector: Health Care | |
| SubSector: Medical Instruments & Supplies | |
| MarketCap: 9075.2 Millions | |
| Recent Price: 76.59 Smart Investing & Trading Score: 68 | |
| Day Percent Change: -0.78% Day Change: -0.60 | |
| Week Change: 1.61% Year-to-date Change: 7.2% | |
| HOLX Links: Profile News Message Board | |
| Charts:- Daily , Weekly | |
| Add HOLX to Watchlist: View: Get HOLX Trend Analysis ➞ | |
 | INVH Invitation Homes Inc. |
| Sector: Financials | |
| SubSector: Real Estate Development | |
| MarketCap: 9782.89 Millions | |
| Recent Price: 34.11 Smart Investing & Trading Score: 68 | |
| Day Percent Change: -0.06% Day Change: -0.02 | |
| Week Change: 1.61% Year-to-date Change: 0.0% | |
| INVH Links: Profile News Message Board | |
| Charts:- Daily , Weekly | |
| Add INVH to Watchlist: View: Get INVH Trend Analysis ➞ | |
 | PAYX Paychex, Inc. |
| Sector: Services & Goods | |
| SubSector: Staffing & Outsourcing Services | |
| MarketCap: 20928.8 Millions | |
| Recent Price: 121.43 Smart Investing & Trading Score: 65 | |
| Day Percent Change: -0.16% Day Change: -0.19 | |
| Week Change: 1.6% Year-to-date Change: 2.0% | |
| PAYX Links: Profile News Message Board | |
| Charts:- Daily , Weekly | |
| Add PAYX to Watchlist: View: Get PAYX Trend Analysis ➞ | |
 | CVX Chevron Corporation |
| Sector: Energy | |
| SubSector: Major Integrated Oil & Gas | |
| MarketCap: 121521 Millions | |
| Recent Price: 162.55 Smart Investing & Trading Score: 88 | |
| Day Percent Change: -0.18% Day Change: -0.30 | |
| Week Change: 1.59% Year-to-date Change: 9.0% | |
| CVX Links: Profile News Message Board | |
| Charts:- Daily , Weekly | |
| Add CVX to Watchlist: View: Get CVX Trend Analysis ➞ | |
 | DTE DTE Energy Company |
| Sector: Utilities | |
| SubSector: Electric Utilities | |
| MarketCap: 18218.1 Millions | |
| Recent Price: 110.27 Smart Investing & Trading Score: 93 | |
| Day Percent Change: 0.14% Day Change: 0.15 | |
| Week Change: 1.57% Year-to-date Change: 0.0% | |
| DTE Links: Profile News Message Board | |
| Charts:- Daily , Weekly | |
| Add DTE to Watchlist: View: Get DTE Trend Analysis ➞ | |
 | AMZN Amazon.com, Inc. |
| Sector: Services & Goods | |
| SubSector: Catalog & Mail Order Houses | |
| MarketCap: 998070 Millions | |
| Recent Price: 177.34 Smart Investing & Trading Score: 63 | |
| Day Percent Change: -1.23% Day Change: -2.20 | |
| Week Change: 1.55% Year-to-date Change: 16.7% | |
| AMZN Links: Profile News Message Board | |
| Charts:- Daily , Weekly | |
| Add AMZN to Watchlist: View: Get AMZN Trend Analysis ➞ | |
 | K Kellogg Company |
| Sector: Consumer Staples | |
| SubSector: Processed & Packaged Goods | |
| MarketCap: 20264.6 Millions | |
| Recent Price: 58.27 Smart Investing & Trading Score: 93 | |
| Day Percent Change: 0.22% Day Change: 0.13 | |
| Week Change: 1.55% Year-to-date Change: 4.2% | |
| K Links: Profile News Message Board | |
| Charts:- Daily , Weekly | |
| Add K to Watchlist: View: Get K Trend Analysis ➞ | |
 | EL The Estee Lauder Companies Inc. |
| Sector: Consumer Staples | |
| SubSector: Personal Products | |
| MarketCap: 59521.1 Millions | |
| Recent Price: 146.63 Smart Investing & Trading Score: 83 | |
| Day Percent Change: -1.58% Day Change: -2.35 | |
| Week Change: 1.54% Year-to-date Change: 0.3% | |
| EL Links: Profile News Message Board | |
| Charts:- Daily , Weekly | |
| Add EL to Watchlist: View: Get EL Trend Analysis ➞ | |
 | REGN Regeneron Pharmaceuticals, Inc. |
| Sector: Health Care | |
| SubSector: Biotechnology | |
| MarketCap: 51903.7 Millions | |
| Recent Price: 910.54 Smart Investing & Trading Score: 32 | |
| Day Percent Change: 0.35% Day Change: 3.22 | |
| Week Change: 1.53% Year-to-date Change: 3.7% | |
| REGN Links: Profile News Message Board | |
| Charts:- Daily , Weekly | |
| Add REGN to Watchlist: View: Get REGN Trend Analysis ➞ | |
 | GWW W.W. Grainger, Inc. |
| Sector: Services & Goods | |
| SubSector: Industrial Equipment Wholesale | |
| MarketCap: 12794.8 Millions | |
| Recent Price: 957.08 Smart Investing & Trading Score: 58 | |
| Day Percent Change: 0.13% Day Change: 1.29 | |
| Week Change: 1.53% Year-to-date Change: 15.5% | |
| GWW Links: Profile News Message Board | |
| Charts:- Daily , Weekly | |
| Add GWW to Watchlist: View: Get GWW Trend Analysis ➞ | |
 | SBAC SBA Communications Corporation |
| Sector: Technology | |
| SubSector: Diversified Communication Services | |
| MarketCap: 26712.3 Millions | |
| Recent Price: 199.06 Smart Investing & Trading Score: 35 | |
| Day Percent Change: 0.38% Day Change: 0.76 | |
| Week Change: 1.53% Year-to-date Change: -21.5% | |
| SBAC Links: Profile News Message Board | |
| Charts:- Daily , Weekly | |
| Add SBAC to Watchlist: View: Get SBAC Trend Analysis ➞ | |
 | VMC Vulcan Materials Company |
| Sector: Industrials | |
| SubSector: General Building Materials | |
| MarketCap: 12304.7 Millions | |
| Recent Price: 255.85 Smart Investing & Trading Score: 58 | |
| Day Percent Change: -1.34% Day Change: -3.48 | |
| Week Change: 1.51% Year-to-date Change: 12.7% | |
| VMC Links: Profile News Message Board | |
| Charts:- Daily , Weekly | |
| Add VMC to Watchlist: View: Get VMC Trend Analysis ➞ | |
 | SNA Snap-on Incorporated |
| Sector: Industrials | |
| SubSector: Small Tools & Accessories | |
| MarketCap: 5947.26 Millions | |
| Recent Price: 272.85 Smart Investing & Trading Score: 32 | |
| Day Percent Change: 0.56% Day Change: 1.51 | |
| Week Change: 1.51% Year-to-date Change: -5.5% | |
| SNA Links: Profile News Message Board | |
| Charts:- Daily , Weekly | |
| Add SNA to Watchlist: View: Get SNA Trend Analysis ➞ | |
 | YUM Yum! Brands, Inc. |
| Sector: Services & Goods | |
| SubSector: Restaurants | |
| MarketCap: 18033.3 Millions | |
| Recent Price: 140.57 Smart Investing & Trading Score: 93 | |
| Day Percent Change: 0.34% Day Change: 0.47 | |
| Week Change: 1.49% Year-to-date Change: 7.6% | |
| YUM Links: Profile News Message Board | |
| Charts:- Daily , Weekly | |
| Add YUM to Watchlist: View: Get YUM Trend Analysis ➞ | |
 | TSN Tyson Foods, Inc. |
| Sector: Consumer Staples | |
| SubSector: Meat Products | |
| MarketCap: 22124.1 Millions | |
| Recent Price: 60.84 Smart Investing & Trading Score: 88 | |
| Day Percent Change: -0.23% Day Change: -0.14 | |
| Week Change: 1.48% Year-to-date Change: 13.2% | |
| TSN Links: Profile News Message Board | |
| Charts:- Daily , Weekly | |
| Add TSN to Watchlist: View: Get TSN Trend Analysis ➞ | |
 | PEG Public Service Enterprise Group Incorporated |
| Sector: Utilities | |
| SubSector: Diversified Utilities | |
| MarketCap: 20886 Millions | |
| Recent Price: 66.71 Smart Investing & Trading Score: 81 | |
| Day Percent Change: 0.33% Day Change: 0.22 | |
| Week Change: 1.48% Year-to-date Change: 9.1% | |
| PEG Links: Profile News Message Board | |
| Charts:- Daily , Weekly | |
| Add PEG to Watchlist: View: Get PEG Trend Analysis ➞ | |
 | STE STERIS plc |
| Sector: Health Care | |
| SubSector: Medical Instruments & Supplies | |
| MarketCap: 10875 Millions | |
| Recent Price: 202.44 Smart Investing & Trading Score: 39 | |
| Day Percent Change: -1.72% Day Change: -3.55 | |
| Week Change: 1.47% Year-to-date Change: -7.9% | |
| STE Links: Profile News Message Board | |
| Charts:- Daily , Weekly | |
| Add STE to Watchlist: View: Get STE Trend Analysis ➞ | |
 | MKC McCormick & Company, Incorporated |
| Sector: Consumer Staples | |
| SubSector: Processed & Packaged Goods | |
| MarketCap: 18522.8 Millions | |
| Recent Price: 74.99 Smart Investing & Trading Score: 81 | |
| Day Percent Change: -0.04% Day Change: -0.03 | |
| Week Change: 1.45% Year-to-date Change: 9.6% | |
| MKC Links: Profile News Message Board | |
| Charts:- Daily , Weekly | |
| Add MKC to Watchlist: View: Get MKC Trend Analysis ➞ | |
 | AIZ Assurant, Inc. |
| Sector: Financials | |
| SubSector: Accident & Health Insurance | |
| MarketCap: 6110.3 Millions | |
| Recent Price: 176.34 Smart Investing & Trading Score: 58 | |
| Day Percent Change: 0.01% Day Change: 0.03 | |
| Week Change: 1.44% Year-to-date Change: 4.7% | |
| AIZ Links: Profile News Message Board | |
| Charts:- Daily , Weekly | |
| Add AIZ to Watchlist: View: Get AIZ Trend Analysis ➞ | |
 | MAA Mid-America Apartment Communities, Inc. |
| Sector: Financials | |
| SubSector: REIT - Residential | |
| MarketCap: 11385.5 Millions | |
| Recent Price: 127.90 Smart Investing & Trading Score: 69 | |
| Day Percent Change: 0.32% Day Change: 0.41 | |
| Week Change: 1.44% Year-to-date Change: -4.9% | |
| MAA Links: Profile News Message Board | |
| Charts:- Daily , Weekly | |
| Add MAA to Watchlist: View: Get MAA Trend Analysis ➞ | |
 | PRU Prudential Financial, Inc. |
| Sector: Financials | |
| SubSector: Life Insurance | |
| MarketCap: 21001.6 Millions | |
| Recent Price: 112.19 Smart Investing & Trading Score: 70 | |
| Day Percent Change: 0.12% Day Change: 0.14 | |
| Week Change: 1.43% Year-to-date Change: 8.2% | |
| PRU Links: Profile News Message Board | |
| Charts:- Daily , Weekly | |
| Add PRU to Watchlist: View: Get PRU Trend Analysis ➞ | |
 | VRTX Vertex Pharmaceuticals Incorporated |
| Sector: Health Care | |
| SubSector: Biotechnology | |
| MarketCap: 57669.6 Millions | |
| Recent Price: 399.90 Smart Investing & Trading Score: 42 | |
| Day Percent Change: -1.24% Day Change: -5.01 | |
| Week Change: 1.43% Year-to-date Change: -1.7% | |
| VRTX Links: Profile News Message Board | |
| Charts:- Daily , Weekly | |
| Add VRTX to Watchlist: View: Get VRTX Trend Analysis ➞ | |
 | BLK BlackRock, Inc. |
| Sector: Financials | |
| SubSector: Asset Management | |
| MarketCap: 61284.9 Millions | |
| Recent Price: 760.58 Smart Investing & Trading Score: 25 | |
| Day Percent Change: -0.79% Day Change: -6.04 | |
| Week Change: 1.41% Year-to-date Change: -6.3% | |
| BLK Links: Profile News Message Board | |
| Charts:- Daily , Weekly | |
| Add BLK to Watchlist: View: Get BLK Trend Analysis ➞ | |
| For tabular summary view of above stock list: Summary View ➞ 0 - 25 , 25 - 50 , 50 - 75 , 75 - 100 , 100 - 125 , 125 - 150 , 150 - 175 , 175 - 200 , 200 - 225 , 225 - 250 , 250 - 275 , 275 - 300 , 300 - 325 , 325 - 350 , 350 - 375 , 375 - 400 , 400 - 425 , 425 - 450 , 450 - 475 | ||
| Click To Change The Sort Order: By Market Cap or Company Size Performance: Year-to-date, Week and Day | |
| Select Chart Type: | ||
|
Best Stocks Today 12Stocks.com |
© 2024 12Stocks.com Terms & Conditions Privacy Contact Us
All Information Provided Only For Education And Not To Be Used For Investing or Trading. See Terms & Conditions


One More Thing ... Get Best Stocks Delivered Daily!
Never Ever Miss A Move With Our Top Ten Stocks Lists
Find Best Stocks In Any Market - Bull or Bear Market
Take A Peek At Our Top Ten Stocks Lists: Daily, Weekly, Year-to-Date & Top Trends
Find Best Stocks In Any Market - Bull or Bear Market
Take A Peek At Our Top Ten Stocks Lists: Daily, Weekly, Year-to-Date & Top Trends
S&P 500 Stocks With Best Up Trends [0-bearish to 100-bullish]: Hasbro [100], Wabtec [100], Texas Instruments[100], Boston Scientific[100], Analog Devices[100], Microchip [100], EQT [100], Synchrony Financial[100], Equity Residential[100], Essex Property[100], UDR [100]
Best S&P 500 Stocks Year-to-Date:
NVIDIA [65.69%], Constellation [59.4%], NRG [40.19%], Meta Platforms[39.28%], Progressive [33.59%], Targa Resources[33.28%], Marathon [33.13%], Diamondback [32.05%], Eaton [31.49%], Western Digital[30.58%], Micron [29.04%] Best S&P 500 Stocks This Week:
Hasbro [18.51%], Wabtec [12.21%], Tesla [10.36%], Texas Instruments[10.25%], Microchip [10%], NXP Semiconductors[8.95%], Boston Scientific[8.84%], Analog Devices[8.62%], CoStar [8.08%], NVIDIA [7.68%], Kimberly-Clark [7.33%] Best S&P 500 Stocks Daily:
Hasbro [12.66%], Tesla [12.16%], Wabtec [8.95%], CoStar [7.62%], Texas Instruments[6.40%], Boston Scientific[6.22%], ON Semiconductor[5.52%], Hilton Worldwide[5.33%], Analog Devices[4.86%], Biogen [4.77%], Microchip [4.25%]