
 Login Sign Up


| |||||
 |  | ||||

| 12Stocks.com Market Intelligence |
Best S&P 500 Stocks
|
On this page, you will find the most comprehensive analysis of S&P 500 stocks and ETFs - from latest trends to performances to charts ➞. First, here are the year-to-date (YTD) performances of the most requested S&P 500 stocks at 12Stocks.com (click stock for review):
| NVIDIA 67% | ||
| Caterpillar 21% | ||
| Amazon.com 16% | ||
| Merck 15% | ||
| Walmart 13% | ||
| Google 11% | ||
| JPMorgan Chase 8% | ||
| Chevron 8% | ||
| Microsoft 7% | ||
| Goldman Sachs 5% | ||
| Johnson & Johnson -7% | ||
| Starbucks -8% | ||
| McDonald s -8% | ||
| Apple -14% | ||
| Gilead -18% | ||
| Intel -31% | ||
| Boeing -34% | ||
| Quick: S&P 500 Stocks Lists: Performances & Trends, S&P 500 Stock Charts
Sort S&P 500 stocks: Daily, Weekly, Year-to-Date, Market Cap & Trends. Filter S&P 500 stocks list by sector: Show all, Tech, Finance, Energy, Staples, Retail, Industrial, Materials, Utilities and HealthCare |
| 12Stocks.com S&P 500 Stocks Performances & Trends Daily Report | |||||||||
|
| 
The overall Smart Investing & Trading Score is 36 (0-bearish to 100-bullish) which puts S&P 500 index in short term bearish to neutral trend. The Smart Investing & Trading Score from previous trading session is 26 and an improvement of trend continues. | ||||||||
Here are the Smart Investing & Trading Scores of the most requested S&P 500 stocks at 12Stocks.com (click stock name for detailed review):
|


| 12Stocks.com: Top Performing S&P 500 Index Stocks | ||||||||||||||||||||||||||||||||||||||||||||||||
 The top performing S&P 500 Index stocks year to date are
Now, more recently, over last week, the top performing S&P 500 Index stocks on the move are


|
||||||||||||||||||||||||||||||||||||||||||||||||
| 12Stocks.com: Investing in S&P 500 Index with Stocks | |
|
The following table helps investors and traders sort through current performance and trends (as measured by Smart Investing & Trading Score) of various
stocks in the S&P 500 Index. Quick View: Move mouse or cursor over stock symbol (ticker) to view short-term technical chart and over stock name to view long term chart. Click on  to add stock symbol to your watchlist and to add stock symbol to your watchlist and  to view watchlist. Click on any ticker or stock name for detailed market intelligence report for that stock. to view watchlist. Click on any ticker or stock name for detailed market intelligence report for that stock. |
12Stocks.com Performance of Stocks in S&P 500 Index
| Ticker | Stock Name | Watchlist | Category | Recent Price | Smart Investing & Trading Score | Change % | YTD Change% |
| TAP | Molson Coors |   | Consumer Staples | 64.63 | 58 | 1.17% | 5.58% |
| JPM | JPMorgan Chase | | Financials | 183.06 | 58 | 1.00% | 7.62% |
| RCL | Royal Caribbean | | Services & Goods | 128.91 | 58 | 1.00% | -0.44% |
| AIZ | Assurant | | Financials | 172.44 | 58 | 0.91% | 2.34% |
| AZO | AutoZone | | Services & Goods | 2994.18 | 58 | 0.71% | 15.80% |
| AJG | Arthur J. | | Financials | 235.25 | 58 | 0.54% | 4.61% |
| BRO | Brown & Brown | | Financials | 81.55 | 58 | 0.52% | 14.68% |
| AON | Aon | | Financials | 309.98 | 58 | 0.41% | 6.51% |
| ICE | Intercontinental Exchange | | Financials | 130.90 | 58 | -0.06% | 1.92% |
| ABNB | Airbnb | | Technology | 159.03 | 56 | -0.67% | 16.80% |
| NSC | Norfolk Southern | | Transports | 242.49 | 56 | 0.92% | 2.58% |
| LDOS | Leidos Holdings | | Technology | 124.72 | 56 | 0.77% | 15.22% |
| J | Jacobs Engineering | | Services & Goods | 144.57 | 56 | 0.74% | 11.38% |
| WM | Waste Management | | Industrials | 206.25 | 56 | 0.58% | 15.16% |
| MRK | Merck | | Health Care | 125.21 | 56 | -0.02% | 14.85% |
| PNC | PNC Financial | | Financials | 151.98 | 55 | 2.77% | -1.85% |
| MAA | Mid-America Apartment | | Financials | 126.22 | 55 | 1.28% | -6.13% |
| KO | Coca-Cola | | Consumer Staples | 59.47 | 55 | 0.95% | 0.92% |
| TMUS | T-Mobile US | | Technology | 161.58 | 55 | 0.45% | 0.78% |
| APA | Apache | | Energy | 32.71 | 54 | 0.86% | -8.84% |
| DOW | Dow | | Materials | 56.87 | 54 | 0.67% | 3.70% |
| JCI | Johnson Controls | | Consumer Staples | 64.19 | 54 | 0.66% | 11.36% |
| LKQ | LKQ | | Consumer Staples | 48.81 | 54 | 0.47% | 2.13% |
| NDAQ | Nasdaq | | Financials | 60.22 | 54 | 0.25% | 3.58% |
| WST | West Pharmaceutical | | Health Care | 377.86 | 54 | 0.14% | 7.31% |
| For chart view version of above stock list: Chart View ➞ 0 - 25 , 25 - 50 , 50 - 75 , 75 - 100 , 100 - 125 , 125 - 150 , 150 - 175 , 175 - 200 , 200 - 225 , 225 - 250 , 250 - 275 , 275 - 300 , 300 - 325 , 325 - 350 , 350 - 375 , 375 - 400 , 400 - 425 , 425 - 450 , 450 - 475 , 475 - 500 | ||
 | Click To Change The Sort Order: By Market Cap or Company Size Performance: Year-to-date, Week and Day |  |
|
Get the most comprehensive stock market coverage daily at 12Stocks.com ➞ Best Stocks Today ➞ Best Stocks Weekly ➞ Best Stocks Year-to-Date ➞ Best Stocks Trends ➞  Best Stocks Today 12Stocks.com Best Nasdaq Stocks ➞ Best S&P 500 Stocks ➞ Best Tech Stocks ➞ Best Biotech Stocks ➞ |
| Detailed Overview of S&P 500 Stocks |
| S&P 500 Technical Overview, Leaders & Laggards, Top S&P 500 ETF Funds & Detailed S&P 500 Stocks List, Charts, Trends & More |
| S&P 500: Technical Analysis, Trends & YTD Performance | |
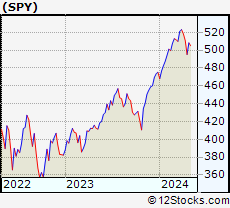
| S&P 500 index as represented by
SPY, an exchange-traded fund [ETF], holds basket of five hundred (mostly largecap) stocks from across all major sectors of the US stock market. The S&P 500 index (contains stocks like Apple and Exxon) is up by 4.95% and is currently outperforming the overall market by 0.87% year-to-date. Below is a quick view of technical charts and trends: | |
 SPY Weekly Chart |
|
| Long Term Trend: Good | |
| Medium Term Trend: Not Good | |
 SPY Daily Chart |
|
| Short Term Trend: Deteriorating | |
| Overall Trend Score: 36 | |
| YTD Performance: 4.95% | |
| **Trend Scores & Views Are Only For Educational Purposes And Not For Investing | |
| 12Stocks.com: Investing in S&P 500 Index using Exchange Traded Funds | |
|
The following table shows list of key exchange traded funds (ETF) that
help investors track S&P 500 index. The following list also includes leveraged ETF funds that track twice or thrice the daily returns of S&P 500 indices. Short or inverse ETF funds move in the opposite direction to the index they track and are useful during market pullbacks or during bear markets. Quick View: Move mouse or cursor over ETF symbol (ticker) to view short-term technical chart and over ETF name to view long term chart. Click on ticker or stock name for detailed view. Click on to add stock symbol to your watchlist and to view watchlist. |
12Stocks.com List of ETFs that track S&P 500 Index
| Ticker | ETF Name | Watchlist | Recent Price | Smart Investing & Trading Score | Change % | Week % | Year-to-date % |
| SPY | SPDR S&P 500 ETF | | 498.82 | 36 | -0.14 | -2.35 | 4.95% |
| OEF | iShares S&P 100 | | 236.60 | 36 | -0.43 | -2.69 | 5.91% |
| SSO | ProShares Ultra S&P500 | | 70.13 | 36 | -0.28 | -4.79 | 7.78% |
| UPRO | ProShares UltraPro S&P500 | | 60.52 | 36 | -0.43 | -7.18 | 10.56% |
| SH | ProShares Short S&P500 | | 12.50 | 69 | 0.24 | 2.54 | -3.77% |
| SDS | ProShares UltraShort S&P500 | | 27.50 | 69 | 0.33 | 5.08 | -8.09% |
| SPXU | ProShares UltraPro Short S&P500 | | 37.53 | 64 | 0.54 | 7.66 | -12.72% |
| 12Stocks.com: Charts, Trends, Fundamental Data and Performances of S&P 500 Stocks | |
|
We now take in-depth look at all S&P 500 stocks including charts, multi-period performances and overall trends (as measured by Smart Investing & Trading Score). One can sort S&P 500 stocks (click link to choose) by Daily, Weekly and by Year-to-Date performances. Also, one can sort by size of the company or by market capitalization. |
| Select Your Default Chart Type: | |||||
| |||||
| Click on stock symbol or name for detailed view. Click on to add stock symbol to your watchlist and to view watchlist. Quick View: Move mouse or cursor over "Daily" to quickly view daily technical stock chart and over "Weekly" to view weekly technical stock chart. | |||||

 | TAP Molson Coors Beverage Company |
| Sector: Consumer Staples | |
| SubSector: Beverages - Brewers | |
| MarketCap: 8619.97 Millions | |
| Recent Price: 64.63 Smart Investing & Trading Score: 58 | |
| Day Percent Change: 1.17% Day Change: 0.74 | |
| Week Change: -2.59% Year-to-date Change: 5.6% | |
| TAP Links: Profile News Message Board | |
| Charts:- Daily , Weekly | |
| Add TAP to Watchlist: View: Get TAP Trend Analysis ➞ | |
 | JPM JPMorgan Chase & Co. |
| Sector: Financials | |
| SubSector: Money Center Banks | |
| MarketCap: 279736 Millions | |
| Recent Price: 183.06 Smart Investing & Trading Score: 58 | |
| Day Percent Change: 1.00% Day Change: 1.81 | |
| Week Change: 0.15% Year-to-date Change: 7.6% | |
| JPM Links: Profile News Message Board | |
| Charts:- Daily , Weekly | |
| Add JPM to Watchlist: View: Get JPM Trend Analysis ➞ | |
 | RCL Royal Caribbean Cruises Ltd. |
| Sector: Services & Goods | |
| SubSector: Resorts & Casinos | |
| MarketCap: 7294.14 Millions | |
| Recent Price: 128.91 Smart Investing & Trading Score: 58 | |
| Day Percent Change: 1.00% Day Change: 1.27 | |
| Week Change: 0.98% Year-to-date Change: -0.4% | |
| RCL Links: Profile News Message Board | |
| Charts:- Daily , Weekly | |
| Add RCL to Watchlist: View: Get RCL Trend Analysis ➞ | |
 | AIZ Assurant, Inc. |
| Sector: Financials | |
| SubSector: Accident & Health Insurance | |
| MarketCap: 6110.3 Millions | |
| Recent Price: 172.44 Smart Investing & Trading Score: 58 | |
| Day Percent Change: 0.91% Day Change: 1.55 | |
| Week Change: -1% Year-to-date Change: 2.3% | |
| AIZ Links: Profile News Message Board | |
| Charts:- Daily , Weekly | |
| Add AIZ to Watchlist: View: Get AIZ Trend Analysis ➞ | |
 | AZO AutoZone, Inc. |
| Sector: Services & Goods | |
| SubSector: Auto Parts Stores | |
| MarketCap: 19128 Millions | |
| Recent Price: 2994.18 Smart Investing & Trading Score: 58 | |
| Day Percent Change: 0.71% Day Change: 21.01 | |
| Week Change: 1.08% Year-to-date Change: 15.8% | |
| AZO Links: Profile News Message Board | |
| Charts:- Daily , Weekly | |
| Add AZO to Watchlist: View: Get AZO Trend Analysis ➞ | |
 | AJG Arthur J. Gallagher & Co. |
| Sector: Financials | |
| SubSector: Insurance Brokers | |
| MarketCap: 14852.2 Millions | |
| Recent Price: 235.25 Smart Investing & Trading Score: 58 | |
| Day Percent Change: 0.54% Day Change: 1.26 | |
| Week Change: 0.29% Year-to-date Change: 4.6% | |
| AJG Links: Profile News Message Board | |
| Charts:- Daily , Weekly | |
| Add AJG to Watchlist: View: Get AJG Trend Analysis ➞ | |
 | BRO Brown & Brown, Inc. |
| Sector: Financials | |
| SubSector: Insurance Brokers | |
| MarketCap: 10475.7 Millions | |
| Recent Price: 81.55 Smart Investing & Trading Score: 58 | |
| Day Percent Change: 0.52% Day Change: 0.42 | |
| Week Change: -0.43% Year-to-date Change: 14.7% | |
| BRO Links: Profile News Message Board | |
| Charts:- Daily , Weekly | |
| Add BRO to Watchlist: View: Get BRO Trend Analysis ➞ | |
 | AON Aon plc |
| Sector: Financials | |
| SubSector: Insurance Brokers | |
| MarketCap: 36870.1 Millions | |
| Recent Price: 309.98 Smart Investing & Trading Score: 58 | |
| Day Percent Change: 0.41% Day Change: 1.28 | |
| Week Change: 0.64% Year-to-date Change: 6.5% | |
| AON Links: Profile News Message Board | |
| Charts:- Daily , Weekly | |
| Add AON to Watchlist: View: Get AON Trend Analysis ➞ | |
 | ICE Intercontinental Exchange, Inc. |
| Sector: Financials | |
| SubSector: Diversified Investments | |
| MarketCap: 46054.6 Millions | |
| Recent Price: 130.90 Smart Investing & Trading Score: 58 | |
| Day Percent Change: -0.06% Day Change: -0.08 | |
| Week Change: -1.98% Year-to-date Change: 1.9% | |
| ICE Links: Profile News Message Board | |
| Charts:- Daily , Weekly | |
| Add ICE to Watchlist: View: Get ICE Trend Analysis ➞ | |
 | ABNB Airbnb, Inc. |
| Sector: Technology | |
| SubSector: Internet Content & Information | |
| MarketCap: 86237 Millions | |
| Recent Price: 159.03 Smart Investing & Trading Score: 56 | |
| Day Percent Change: -0.67% Day Change: -1.07 | |
| Week Change: -0.22% Year-to-date Change: 16.8% | |
| ABNB Links: Profile News Message Board | |
| Charts:- Daily , Weekly | |
| Add ABNB to Watchlist: View: Get ABNB Trend Analysis ➞ | |
 | NSC Norfolk Southern Corporation |
| Sector: Transports | |
| SubSector: Railroads | |
| MarketCap: 36165.4 Millions | |
| Recent Price: 242.49 Smart Investing & Trading Score: 56 | |
| Day Percent Change: 0.92% Day Change: 2.22 | |
| Week Change: -1.32% Year-to-date Change: 2.6% | |
| NSC Links: Profile News Message Board | |
| Charts:- Daily , Weekly | |
| Add NSC to Watchlist: View: Get NSC Trend Analysis ➞ | |
 | LDOS Leidos Holdings, Inc. |
| Sector: Technology | |
| SubSector: Information Technology Services | |
| MarketCap: 11707.5 Millions | |
| Recent Price: 124.72 Smart Investing & Trading Score: 56 | |
| Day Percent Change: 0.77% Day Change: 0.95 | |
| Week Change: -0.81% Year-to-date Change: 15.2% | |
| LDOS Links: Profile News Message Board | |
| Charts:- Daily , Weekly | |
| Add LDOS to Watchlist: View: Get LDOS Trend Analysis ➞ | |
 | J Jacobs Engineering Group Inc. |
| Sector: Services & Goods | |
| SubSector: Technical Services | |
| MarketCap: 9714.8 Millions | |
| Recent Price: 144.57 Smart Investing & Trading Score: 56 | |
| Day Percent Change: 0.74% Day Change: 1.06 | |
| Week Change: -0.06% Year-to-date Change: 11.4% | |
| J Links: Profile News Message Board | |
| Charts:- Daily , Weekly | |
| Add J to Watchlist: View: Get J Trend Analysis ➞ | |
 | WM Waste Management, Inc. |
| Sector: Industrials | |
| SubSector: Waste Management | |
| MarketCap: 46977.4 Millions | |
| Recent Price: 206.25 Smart Investing & Trading Score: 56 | |
| Day Percent Change: 0.58% Day Change: 1.18 | |
| Week Change: 0.43% Year-to-date Change: 15.2% | |
| WM Links: Profile News Message Board | |
| Charts:- Daily , Weekly | |
| Add WM to Watchlist: View: Get WM Trend Analysis ➞ | |
 | MRK Merck & Co., Inc. |
| Sector: Health Care | |
| SubSector: Drug Manufacturers - Major | |
| MarketCap: 192657 Millions | |
| Recent Price: 125.21 Smart Investing & Trading Score: 56 | |
| Day Percent Change: -0.02% Day Change: -0.02 | |
| Week Change: -0.42% Year-to-date Change: 14.9% | |
| MRK Links: Profile News Message Board | |
| Charts:- Daily , Weekly | |
| Add MRK to Watchlist: View: Get MRK Trend Analysis ➞ | |
 | PNC The PNC Financial Services Group, Inc. |
| Sector: Financials | |
| SubSector: Money Center Banks | |
| MarketCap: 41291.5 Millions | |
| Recent Price: 151.98 Smart Investing & Trading Score: 55 | |
| Day Percent Change: 2.77% Day Change: 4.09 | |
| Week Change: 0.9% Year-to-date Change: -1.9% | |
| PNC Links: Profile News Message Board | |
| Charts:- Daily , Weekly | |
| Add PNC to Watchlist: View: Get PNC Trend Analysis ➞ | |
 | MAA Mid-America Apartment Communities, Inc. |
| Sector: Financials | |
| SubSector: REIT - Residential | |
| MarketCap: 11385.5 Millions | |
| Recent Price: 126.22 Smart Investing & Trading Score: 55 | |
| Day Percent Change: 1.28% Day Change: 1.60 | |
| Week Change: -1.49% Year-to-date Change: -6.1% | |
| MAA Links: Profile News Message Board | |
| Charts:- Daily , Weekly | |
| Add MAA to Watchlist: View: Get MAA Trend Analysis ➞ | |
 | KO The Coca-Cola Company |
| Sector: Consumer Staples | |
| SubSector: Beverages - Soft Drinks | |
| MarketCap: 182046 Millions | |
| Recent Price: 59.47 Smart Investing & Trading Score: 55 | |
| Day Percent Change: 0.95% Day Change: 0.56 | |
| Week Change: 2.04% Year-to-date Change: 0.9% | |
| KO Links: Profile News Message Board | |
| Charts:- Daily , Weekly | |
| Add KO to Watchlist: View: Get KO Trend Analysis ➞ | |
 | TMUS T-Mobile US, Inc. |
| Sector: Technology | |
| SubSector: Wireless Communications | |
| MarketCap: 71949 Millions | |
| Recent Price: 161.58 Smart Investing & Trading Score: 55 | |
| Day Percent Change: 0.45% Day Change: 0.73 | |
| Week Change: 0.96% Year-to-date Change: 0.8% | |
| TMUS Links: Profile News Message Board | |
| Charts:- Daily , Weekly | |
| Add TMUS to Watchlist: View: Get TMUS Trend Analysis ➞ | |
 | APA Apache Corporation |
| Sector: Energy | |
| SubSector: Independent Oil & Gas | |
| MarketCap: 1937.53 Millions | |
| Recent Price: 32.71 Smart Investing & Trading Score: 54 | |
| Day Percent Change: 0.86% Day Change: 0.28 | |
| Week Change: -3% Year-to-date Change: -8.8% | |
| APA Links: Profile News Message Board | |
| Charts:- Daily , Weekly | |
| Add APA to Watchlist: View: Get APA Trend Analysis ➞ | |
 | DOW Dow Inc. |
| Sector: Materials | |
| SubSector: Chemicals - Major Diversified | |
| MarketCap: 24098.6 Millions | |
| Recent Price: 56.87 Smart Investing & Trading Score: 54 | |
| Day Percent Change: 0.67% Day Change: 0.38 | |
| Week Change: -1.42% Year-to-date Change: 3.7% | |
| DOW Links: Profile News Message Board | |
| Charts:- Daily , Weekly | |
| Add DOW to Watchlist: View: Get DOW Trend Analysis ➞ | |
 | JCI Johnson Controls International plc |
| Sector: Consumer Staples | |
| SubSector: Auto Parts | |
| MarketCap: 21950.7 Millions | |
| Recent Price: 64.19 Smart Investing & Trading Score: 54 | |
| Day Percent Change: 0.66% Day Change: 0.42 | |
| Week Change: -1.68% Year-to-date Change: 11.4% | |
| JCI Links: Profile News Message Board | |
| Charts:- Daily , Weekly | |
| Add JCI to Watchlist: View: Get JCI Trend Analysis ➞ | |
 | LKQ LKQ Corporation |
| Sector: Consumer Staples | |
| SubSector: Auto Parts | |
| MarketCap: 5633.79 Millions | |
| Recent Price: 48.81 Smart Investing & Trading Score: 54 | |
| Day Percent Change: 0.47% Day Change: 0.23 | |
| Week Change: -0.89% Year-to-date Change: 2.1% | |
| LKQ Links: Profile News Message Board | |
| Charts:- Daily , Weekly | |
| Add LKQ to Watchlist: View: Get LKQ Trend Analysis ➞ | |
 | NDAQ Nasdaq, Inc. |
| Sector: Financials | |
| SubSector: Diversified Investments | |
| MarketCap: 14885.2 Millions | |
| Recent Price: 60.22 Smart Investing & Trading Score: 54 | |
| Day Percent Change: 0.25% Day Change: 0.15 | |
| Week Change: -2.11% Year-to-date Change: 3.6% | |
| NDAQ Links: Profile News Message Board | |
| Charts:- Daily , Weekly | |
| Add NDAQ to Watchlist: View: Get NDAQ Trend Analysis ➞ | |
 | WST West Pharmaceutical Services, Inc. |
| Sector: Health Care | |
| SubSector: Medical Instruments & Supplies | |
| MarketCap: 9989 Millions | |
| Recent Price: 377.86 Smart Investing & Trading Score: 54 | |
| Day Percent Change: 0.14% Day Change: 0.53 | |
| Week Change: -0.56% Year-to-date Change: 7.3% | |
| WST Links: Profile News Message Board | |
| Charts:- Daily , Weekly | |
| Add WST to Watchlist: View: Get WST Trend Analysis ➞ | |
| For tabular summary view of above stock list: Summary View ➞ 0 - 25 , 25 - 50 , 50 - 75 , 75 - 100 , 100 - 125 , 125 - 150 , 150 - 175 , 175 - 200 , 200 - 225 , 225 - 250 , 250 - 275 , 275 - 300 , 300 - 325 , 325 - 350 , 350 - 375 , 375 - 400 , 400 - 425 , 425 - 450 , 450 - 475 , 475 - 500 | ||
| Click To Change The Sort Order: By Market Cap or Company Size Performance: Year-to-date, Week and Day | |
| Select Chart Type: | ||
|
Best Stocks Today 12Stocks.com |
© 2024 12Stocks.com Terms & Conditions Privacy Contact Us
All Information Provided Only For Education And Not To Be Used For Investing or Trading. See Terms & Conditions


One More Thing ... Get Best Stocks Delivered Daily!
Never Ever Miss A Move With Our Top Ten Stocks Lists
Find Best Stocks In Any Market - Bull or Bear Market
Take A Peek At Our Top Ten Stocks Lists: Daily, Weekly, Year-to-Date & Top Trends
Find Best Stocks In Any Market - Bull or Bear Market
Take A Peek At Our Top Ten Stocks Lists: Daily, Weekly, Year-to-Date & Top Trends
S&P 500 Stocks With Best Up Trends [0-bearish to 100-bullish]: Kinder Morgan[100], Wells Fargo[100], Bunge [100], Consolidated Edison[100], Lockheed Martin[100], Charles Schwab[100], Conagra Brands[100], Genuine Parts[100], United Airlines[100], Dominion [95], Progressive [95]
Best S&P 500 Stocks Year-to-Date:
NVIDIA [66.66%], Constellation [57.45%], Meta Platforms[38.28%], NRG [36.11%], Progressive [34.35%], Marathon [33.2%], Targa Resources[31.03%], Diamondback [30.74%], Western Digital[29.2%], Eaton [28.4%], Micron [27.36%] Best S&P 500 Stocks This Week:
United Airlines[23.18%], UnitedHealth [14.33%], Genuine Parts[10.93%], Globe Life[10.86%], American Airlines[8.4%], ProShares UltraPro[7.66%], Southwest Airlines[7.43%], Wells Fargo[7.31%], V.F [6.11%], Morgan Stanley[5.88%], Centene [5.68%] Best S&P 500 Stocks Daily:
Fifth Third[5.13%], American Express[4.47%], Kinder Morgan[3.51%], Bank of America[3.40%], Wells Fargo[3.17%], Bunge [2.96%], PNC Financial[2.77%], Generac Holdings[2.63%], Synchrony Financial[2.48%], Citizens Financial[2.46%], Truist Financial[2.42%]